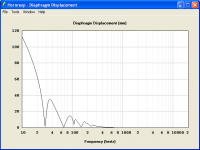
Josh already measured driver excursion minimum to occur at 28 Hz wich matches the Akaback sim.
The driver excursion curve sharply defines the LF, the impedance curve peaks are perhaps easier to read in the excursion maxima areas, but either can give you the information needed to tell if the cabinet is performing like the sim.
I find excursion more important than impedance.
Can you accurately measure excursion across several frequencies? Can those results be used to determine if there is significant losses due to leaks or panel vibration?
IMO, if the output differs significantly from the model, the easiest thing to do would be to take an impedance response curve to determine what's happening and what could be contributing to the difference in output. In fact, I usually find myself doing the impedance response FIRST, as it only takes a few minutes and can be done more accurately than either a FR or excursion test, and I can correct any issues that it highlights before going through the trouble of doing the other tests.
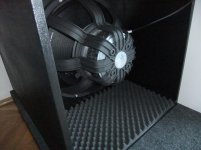
Epa...The hatch above the driver really can't be effectively braced very well. It doesn't matter a whole lot because the planned use has the cabs sitting on that panel. Thats why I didn't worry about it.
As far as getting an impedance measurement that is just regular procedure with any cab. The cause of variations from the simulated impedance still has to be determined just like with a response, or decay measurement.
As far as getting an impedance measurement that is just regular procedure with any cab. The cause of variations from the simulated impedance still has to be determined just like with a response, or decay measurement.
Used to use a white dot, now use a silver Sharpie dot.how do you measure excursion.
white dot metod?
you mean something like thin foil?silver Sharpie dot.
i stil have to measure my excursion .
It is easy to get excursion results accurate to within a millimeter, which is only a fraction of the Xmax potential of high Xmax subs.Can you accurately measure excursion across several frequencies? Can those results be used to determine if there is significant losses due to leaks or panel vibration?
Excursion won't tell you about losses due to leaks or panel vibration, but ears and eyes do a good job with those issues at low frequencies.
An impedance sweep for high cabinets is a useful "fingerprint", leaking HF compression drivers are harder to detect by ear in use since the leak noise is masked by the reproduced spectrum, though a frequency sweep below the pass band will still reveal the problems.
An impedance tester certainly can be useful, but is one of the few audio tools that I have not felt compelled to purchase.
If I ran a rental shop, I'd purchase one to avoid the noisy sine wave sweep testing required to properly check out a speaker after return.
Art
"Sharpie" is a trade name for a sharp pointed felt tip marker, they are available in many colors, silver simply has the best contrast of the available colors on a black speaker cone.you mean something like thin foil?
i stil have to measure my excursion .
I used to use White Out or Liquid paper to apply the dot, but Sharpie pens are more convenient, and don't dry out so fast, and are useful for labeling all sorts of audio gear.
It is easy to get excursion results accurate to within a millimeter, which is only a fraction of the Xmax potential of high Xmax subs.
How long does it take to measure what the driver excursion looks like across the full passband of the system?
An impedance check literally takes about a second or two with a WT3. I'd have finished running several tests on my system, identified any issues with it, resolved them and moved on to other things while you're still trying to figure out how far that white dot is moving at different frequencies 🙂.
FWIW, here's a link that shows how I used the impedance response to demonstrate the impact of adding bracing to a small tapped horn: The Subwoofer DIY Page v1.1 - Projects : Using Impedance Graphs . Note also that it's possible this type of testing could also be used to determine where it would be best to add bracing, and also where it doesn't have to be, which could help to optimize the weight of the box.
Takes a few minutes to make accurate excursion measurements, also giving a chance to hear if there are resonance or vibration problems.How long does it take to measure what the driver excursion looks like across the full passband of the system?
An impedance check literally takes about a second or two with a WT3. I'd have finished running several tests on my system, identified any issues with it, resolved them and moved on to other things while you're still trying to figure out how far that white dot is moving at different frequencies 🙂.
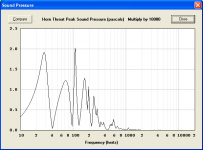
Using a sine wave sweep takes only seconds to identify the excursion minima and maxima frequencies, which basically shows the inverse of the impedance curve.
An impedance test is fast, but does not predict what the excursion is at various power levels, which is important, even if it does take some time. Sims don't accurately predict the excursion below Fb, the speaker compliance can make a large difference from predictions.
A frequency/phase response test will point out the other issues that the impedance test would, and only takes seconds (after the half hour of set up🙄)
Having designed, built, and in a few instances copied high output subs for decades, I have learned where and how much bracing is needed, and how to build an air-tight box, so the boxes don't have the issues you describe in "The Subwoofer DIY Page v1.1 - Projects : Using Impedance Graphs" 😉.
Good article, almost makes me want to buy an impedance tester, but I'd still rather put my money in more drivers than more test instruments.
By the way, what was the FR and phase change result of the extra bracing in your article?
Art
Last edited:
tnx art"Sharpie" is a trade name for a sharp pointed felt tip marker, they are available in many colors, silver simply has the best contrast of the available colors on a black speaker cone.
I used to use White Out or Liquid paper to apply the dot, but Sharpie pens are more convenient, and don't dry out so fast, and are useful for labeling all sorts of audio gear.
Having designed, built, and in a few instances copied high output subs for decades, I have learned where and how much bracing is needed, and how to build an air-tight box, so the boxes don't have the issues you describe in "The Subwoofer DIY Page v1.1 - Projects : Using Impedance Graphs" 😉.
LOL - that particular box was deliberately built without braces. See The Subwoofer DIY Page v1.1 - Projects : "Proof of Concept #2" for more information.
By the way, what was the FR and phase change result of the extra bracing in your article?
I didn't measure it, as it wasn't the purpose of the exercise to determine that. In any case, some HornResp modelling suggested that the effect of the bracing that I added on the FR would be very minor.
I did however measure the FR changes with the addition of the "dogfood duct" mod (to address the midbass "notch" that sometimes happens with TH designs). The results suggest the mod might be useful to extend response, but they also suggest that the test horn's mouth might be too small, though I'm not sure why yet. I plan to do a rebuild later this year, proper bracing and mouth size 🙂.
Here is a small update nothing major just an impedance measurement. There is no damping in the cab for this measurement. Unfortunately I have not had much chance to mess with the Othorn's yet due to some unexpected matters and various projects investigating drivers for other people. I am trying to get those done so I can concentrate on these. I hope to be able to try out a few different applications of some dampening materials in the cab and see what that does to the response shape, efficiency and resonances. After that is settled upon it will be time for testing outdoors with power.

Here is a small update nothing major just an impedance measurement. There is no damping in the cab for this measurement. Unfortunately I have not had much chance to mess with the Othorn's yet due to some unexpected matters and various projects investigating drivers for other people. I am trying to get those done so I can concentrate on these. I hope to be able to try out a few different applications of some dampening materials in the cab and see what that does to the response shape, efficiency and resonances. After that is settled upon it will be time for testing outdoors with power.
Nice. How does it compare to the predicted impedance response curve? Do you have a way of overlaying the curves? I usually export the data and use Excel's graphing tool for that purpose.


Hi there,
do you have any experience with Faital 18XL1500 driver, I am making Tapped Horn now with 18-inch driver, 21-inch was to big. TH will be W 22.83 x H 49.21 x D 30.00 and the horn path will be 15.47 feel long.
Hello ZivkoF. I do not have any direct experience with the Faital but either it or its little brother (I do not remember which.) were tested in VC magazine and did rather well. The specs should be accurate to base a design on.
Here is a bit of an update on this 27Hz TH design. I finally had a chance to get outdoors with it. Unfortunately it was a bit of a bitter sweet event involving both good and bad.
First the bad part...I have damaged one of my 21SW152-4's during the testing which prevented me from getting the full data set and it will need reconed. Truthfully the fact that they have both survived unscathed everything they have been through thus far is impressive to say the least so I'm not discouraged by that.
The good is that I did get some measurements and much of it was better than I had hoped for. The raw response shape is what I would call pretty good for a TH and the 40Hz response blip I encountered during the initial close mic measurements is gone so that was obviously some sort of in room acoustic artifact. Additionally the response decay is much much cleaner than I had expected with very little ringing exhibited. I have only seen this type of data for a few TH's, pipes and FLH's but usually due to the nature of their operation there are some prolonged resonances which can ring and color the sound somewhat, usually associated with high Q notches or peaks in the response shape. Most higher order systems seem to exhibit these to one degree or another.
The 1w/1m sensitivity result is also good and I was able to test the cab with and without damping in a couple of places along the internal pathway and also with a rigged up throat compression plate which attempts to compensate for the large volume of air contained inside of the large 21" cone. This test was inspired by some discussion that occured in a different TH thread here at DIYAudio a few months back. This extra volume of air is not usually accounted for in the horn models very well and small differences in the throat section between the models and the real world system can account for significant response differences. Anyway I made a very simple plate and installed it under the driver which did improve the top end response and sensitivity somewhat compared to the measurements without it. Unfortunately this plate is likely the cause of the damaged driver. This cabinet is already out there beyond recommended conventional practice with a 4/1 compression ratio on a 21" driver. The addition of the plate further decreased the throat volume by a significant amount and truthfully I did not verify with certainty whether physical contact of the driver cone with the plate was impossible prior to letting it rip. The result was a damaged cone with some buckling in a few spots and separation from the surround at one point. I suspect that this is caused by simply too much pressure on the cone rather than physical contact but it could be either.
Now...Let me explain what the system was being subjected to at the time that the driver cone broke down. This was during maximum output burst testing with a Powersoft K10 run on 240V and bridged into a single cab. The amplifier was being driven into clipping with a 6.5cycle duration shaped burst of 63Hz. I'm not exactly sure how much voltage or power that is but let's just assume it is just a smidge more than recommended or would be used as "program" power. I usually take 3 or 4 readings at least to make sure that the results are repeatable. If the distortion gets out of hand or distress starts to become readily apparent I will stop increasing the level. This cab was actually ok up to amplifier clipping at 125,100,80 and 63Hz but on the 3rd full power burst the output dropped considerably and the tone became different indicating that something had given way. Turns out it was the driver cone. I'm not sure whether it physically contacted the plate in the throat or whether the pressures were simply too great for repeated blasts at that level. The output being recorded was just above 128dB at 63Hz at 4 meters outdoors ground plane which equates to about 134dB 1m fullspace(anechoic) or just above 140dB at 1m halfspace. Higher readings were obtained at 80,100 and 125Hz. (The levels involved require measuring with the microphone at a 4m distance from the cabinet in order to avoid overloading the input stage.) Hopefully with removal of the additional throat plate the second drivers cone will survive this type of abuse. I believe it will.
I will post the pictures and measurements to go with all of this in awhile.
First the bad part...I have damaged one of my 21SW152-4's during the testing which prevented me from getting the full data set and it will need reconed.
Truthfully the fact that they have both survived unscathed everything they have been through thus far is impressive to say the least so I'm not discouraged by that. The good is that I did get some measurements and much of it was better than I had hoped for. The raw response shape is what I would call pretty good for a TH and the 40Hz response blip I encountered during the initial close mic measurements is gone so that was obviously some sort of in room acoustic artifact. Additionally the response decay is much much cleaner than I had expected with very little ringing exhibited. I have only seen this type of data for a few TH's, pipes and FLH's but usually due to the nature of their operation there are some prolonged resonances which can ring and color the sound somewhat, usually associated with high Q notches or peaks in the response shape. Most higher order systems seem to exhibit these to one degree or another.
The 1w/1m sensitivity result is also good and I was able to test the cab with and without damping in a couple of places along the internal pathway and also with a rigged up throat compression plate which attempts to compensate for the large volume of air contained inside of the large 21" cone. This test was inspired by some discussion that occured in a different TH thread here at DIYAudio a few months back. This extra volume of air is not usually accounted for in the horn models very well and small differences in the throat section between the models and the real world system can account for significant response differences. Anyway I made a very simple plate and installed it under the driver which did improve the top end response and sensitivity somewhat compared to the measurements without it. Unfortunately this plate is likely the cause of the damaged driver. This cabinet is already out there beyond recommended conventional practice with a 4/1 compression ratio on a 21" driver. The addition of the plate further decreased the throat volume by a significant amount and truthfully I did not verify with certainty whether physical contact of the driver cone with the plate was impossible prior to letting it rip. The result was a damaged cone with some buckling in a few spots and separation from the surround at one point. I suspect that this is caused by simply too much pressure on the cone rather than physical contact but it could be either.
Now...Let me explain what the system was being subjected to at the time that the driver cone broke down. This was during maximum output burst testing with a Powersoft K10 run on 240V and bridged into a single cab. The amplifier was being driven into clipping with a 6.5cycle duration shaped burst of 63Hz. I'm not exactly sure how much voltage or power that is but let's just assume it is just a smidge more than recommended or would be used as "program" power. I usually take 3 or 4 readings at least to make sure that the results are repeatable. If the distortion gets out of hand or distress starts to become readily apparent I will stop increasing the level. This cab was actually ok up to amplifier clipping at 125,100,80 and 63Hz but on the 3rd full power burst the output dropped considerably and the tone became different indicating that something had given way. Turns out it was the driver cone. I'm not sure whether it physically contacted the plate in the throat or whether the pressures were simply too great for repeated blasts at that level. The output being recorded was just above 128dB at 63Hz at 4 meters outdoors ground plane which equates to about 134dB 1m fullspace(anechoic) or just above 140dB at 1m halfspace. Higher readings were obtained at 80,100 and 125Hz. (The levels involved require measuring with the microphone at a 4m distance from the cabinet in order to avoid overloading the input stage.) Hopefully with removal of the additional throat plate the second drivers cone will survive this type of abuse. I believe it will.
I will post the pictures and measurements to go with all of this in awhile.
Here is a bit of an update on this 27Hz TH design. I finally had a chance to get outdoors with it. Unfortunately it was a bit of a bitter sweet event involving both good and bad.
First the bad part...I have damaged one of my 21SW152-4's during the testing which prevented me from getting the full data set and it will need reconed.
The good is that I did get some measurements and much of it was better than I had hoped for. The raw response shape is what I would call pretty good for a TH and the 40Hz response blip I encountered during the initial close mic measurements is gone so that was obviously some sort of in room acoustic artifact. Additionally the response decay is much much cleaner than I had expected with very little ringing exhibited. I have only seen this type of data for a few TH's, pipes and FLH's but usually due to the nature of their operation there are some prolonged resonances which can ring and color the sound somewhat, usually associated with high Q notches or peaks in the response shape. Most higher order systems seem to exhibit these to one degree or another.
The 1w/1m sensitivity result is also good and I was able to test the cab with and without damping in a couple of places along the internal pathway and also with a rigged up throat compression plate which attempts to compensate for the large volume of air contained inside of the large 21" cone. This test was inspired by some discussion that occured in a different TH thread here at DIYAudio a few months back. This extra volume of air is not usually accounted for in the horn models very well and small differences in the throat section between the models and the real world system can account for significant response differences. Anyway I made a very simple plate and installed it under the driver which did improve the top end response and sensitivity somewhat compared to the measurements without it. Unfortunately this plate is likely the cause of the damaged driver. This cabinet is already out there beyond recommended conventional practice with a 4/1 compression ratio on a 21" driver. The addition of the plate further decreased the throat volume by a significant amount and truthfully I did not verify with certainty whether physical contact of the driver cone with the plate was impossible prior to letting it rip. The result was a damaged cone with some buckling in a few spots and separation from the surround at one point. I suspect that this is caused by simply too much pressure on the cone rather than physical contact but it could be either.
Now...Let me explain what the system was being subjected to at the time that the driver cone broke down. This was during maximum output burst testing with a Powersoft K10 run on 240V and bridged into a single cab. The amplifier was being driven into clipping with a 6.5cycle duration shaped burst of 63Hz. I'm not exactly sure how much voltage or power that is but let's just assume it is just a smidge more than recommended or would be used as "program" power. I usually take 3 or 4 readings at least to make sure that the results are repeatable. If the distortion gets out of hand or distress starts to become readily apparent I will stop increasing the level. This cab was actually ok up to amplifier clipping at 125,100,80 and 63Hz but on the 3rd full power burst the output dropped considerably and the tone became different indicating that something had given way. Turns out it was the driver cone. I'm not sure whether it physically contacted the plate in the throat or whether the pressures were simply too great for repeated blasts at that level. The output being recorded was just above 128dB at 63Hz at 4 meters outdoors ground plane which equates to about 134dB 1m fullspace(anechoic) or just above 140dB at 1m halfspace. Higher readings were obtained at 80,100 and 125Hz. (The levels involved require measuring with the microphone at a 4m distance from the cabinet in order to avoid overloading the input stage.) Hopefully with removal of the additional throat plate the second drivers cone will survive this type of abuse. I believe it will.
I will post the pictures and measurements to go with all of this in awhile.
Thanks Josh Ricci for great information on your new Othorn tapped horn. Glad to hear that your measurements wre much better than you hoped for. I am also very, very happy with my new TH_1819, my compression ratio is lower than yours 2.16/1 and I did put also some damping near the throat and at the exit of the mouth and dont hear any kind of ringing or resonences. Great Ricci we are all crazy Tapped Horners 🙂
Attachments
Here are some pics...
Here is the generic throat plate that I added to try and improve the expansion. Essentially this is the scrap cutout from an 18", 15" and 12" driver stacked. High tech! 🙄

Here are some pics of the driver cone showing the damage. The creases were formed on the tighter end of the throat right at the beginning of the horn path. I do not think that enough excursion was produced to physically contact the throat plate shown above but I am not sure of that. That may be what happened.
Here are some GP measurements taken at 18.6v (100w into the 3.4ohm impedance min) . I tried a few different tests: 1. a generous amount of damping in the last 2 turns of the horn and in the throat and first turn. 2. The empty undamped cab as designed, 3. With the stepped throat plate added under the driver and 4. with only the damping in the throat. After looking at a couple of different measurement types the damping did nothing that would justify the small hit in efficiency taken by using it. It showed negligible improvements in group delay, decay rates, response flattening, etc and a noticeable cut in sensitivity so I will be using none in this cab. As can be seen the orange trace with the throat plate added increased the top end efficiency somewhat and flattened response a little. This was the reason that I decided to try testing with it. Unfortunately since the driver was damaged in the process I have decided to revert back to using the cabs as designed with slightly degraded top end but hopefully less stress on the driver cone at maximum drive levels.
Here is basic raw response of the cab with the phase shown at an 18.6v drive level. Overall I think the response shape and phase is very good and relatively flat for an unprocessed TH cab.
As I have found when testing cabs outdoors the sensitivity comes in much higher than the simulations would suggest. My guess is that this is due to directivity and/or mic proximity to reflected energy from a large cabinet. However comparing 10m 18.6v to 1m 1.86v measurement indicates not as much difference as would be needed. Voltage input was almost exactly 1.86v at the cabinet terminals. I've also noticed that some manufacturers seem to end up with a sensitivity some 3dB or so higher than would be expected with no explanation. Anyone have any ideas?

Waterfall and group delay show rapid decay and loss of 30dB of energy with little ringing except for near 105Hz. This is much better than I had expected and indicates that the Othorn should be capable of excellent sound if the distortion is well controlled. (I already know that the response can be made flat without much effort, there is little ringing or resonance and that the headroom for BIG dynamics or response modification to suit to taste is there).
Here is the generic throat plate that I added to try and improve the expansion. Essentially this is the scrap cutout from an 18", 15" and 12" driver stacked. High tech! 🙄
An externally hosted image should be here but it was not working when we last tested it.
Here are some pics of the driver cone showing the damage. The creases were formed on the tighter end of the throat right at the beginning of the horn path. I do not think that enough excursion was produced to physically contact the throat plate shown above but I am not sure of that. That may be what happened.
An externally hosted image should be here but it was not working when we last tested it.
An externally hosted image should be here but it was not working when we last tested it.
Here are some GP measurements taken at 18.6v (100w into the 3.4ohm impedance min) . I tried a few different tests: 1. a generous amount of damping in the last 2 turns of the horn and in the throat and first turn. 2. The empty undamped cab as designed, 3. With the stepped throat plate added under the driver and 4. with only the damping in the throat. After looking at a couple of different measurement types the damping did nothing that would justify the small hit in efficiency taken by using it. It showed negligible improvements in group delay, decay rates, response flattening, etc and a noticeable cut in sensitivity so I will be using none in this cab. As can be seen the orange trace with the throat plate added increased the top end efficiency somewhat and flattened response a little. This was the reason that I decided to try testing with it. Unfortunately since the driver was damaged in the process I have decided to revert back to using the cabs as designed with slightly degraded top end but hopefully less stress on the driver cone at maximum drive levels.
An externally hosted image should be here but it was not working when we last tested it.
Here is basic raw response of the cab with the phase shown at an 18.6v drive level. Overall I think the response shape and phase is very good and relatively flat for an unprocessed TH cab.
An externally hosted image should be here but it was not working when we last tested it.
As I have found when testing cabs outdoors the sensitivity comes in much higher than the simulations would suggest. My guess is that this is due to directivity and/or mic proximity to reflected energy from a large cabinet. However comparing 10m 18.6v to 1m 1.86v measurement indicates not as much difference as would be needed. Voltage input was almost exactly 1.86v at the cabinet terminals. I've also noticed that some manufacturers seem to end up with a sensitivity some 3dB or so higher than would be expected with no explanation. Anyone have any ideas?
Waterfall and group delay show rapid decay and loss of 30dB of energy with little ringing except for near 105Hz. This is much better than I had expected and indicates that the Othorn should be capable of excellent sound if the distortion is well controlled. (I already know that the response can be made flat without much effort, there is little ringing or resonance and that the headroom for BIG dynamics or response modification to suit to taste is there).
An externally hosted image should be here but it was not working when we last tested it.
An externally hosted image should be here but it was not working when we last tested it.
Last edited:
Hi Josh,
Any indication of the cone edge folding back from contact? On the back of the cone there would probably be a crease.
I think I would probably remove the L12 wedge and rebuild the cone correction to spec in an effort to equalize the pressure. A top bearing bit on a laminate trimmer or even a long bit with a long shaft could be used. Rotozip...
- Home
- Loudspeakers
- Subwoofers
- The Othorn tapped horn