
Done for the day... need to clean up before my family arrives.
Sounds familiar....the project looks exceptional. You must be super excited for a listen.
Evan
I am excited about that! Hope to be there in about 2 weeks... if everything goes as planned.
Just had to check one little thing (it's late here), the wiggle is something at the entrance of the enclosure.
I can knock it down a tiny bit further by adding wool felt around the first inch or so right behind the driver. So I think that just about wraps up the impedance tests. It mostly seems to come from the obstruction of the driver terminals blocking some air in the narrow passage.
Last edited:
I don't remember if you choose to isolate each driver or not, but if you did not then the measurements in the test enclosure will not reflect that of the actual 25 driver line. Might be chasing a non existant ghost.
I know... I have dividers (with holes) between every driver, so up to a point it is closed.
I just wanted to satisfy my curiosity where the wiggle came from. It will be nicely averaged between the 25 chambers with alternating driver mounting.
Just wanted to make sure I could repeat results so I know what to do in the actual line itself. The curve looks pretty clean compared to the full stuffing ones I showed before. What is left is in a part of the frequency range that gets knocked down with EQ. It is the most efficient frequency range of the line.
I have a "curtain" of wool felt about an inch behind the drivers, behind that is the fiberglass fill so it won't make it's way into the vent and other parts of the driver.
Leaves me with plenty of room for the wiring as well.
I'll run an impedance test on the full lines to compare when the time comes...
Last edited:
....I'll run an impedance test on the full lines to compare when the time comes...
Whoohoo
 It is getting close now 🙂
For a moment I thought I was alone here in chasing these impedance plots...
But I remembered seeing a reference to it a long time ago. A google search found that plot for me again. Look at the impedance plot on this page from Linkwitz designing his Pluto speaker:
Pluto construction
Basically the same thing I was doing chasing that little wiggle 😀.

See the difference in a well stuffed plot with fiberglass and angel hair compared to the attempt from early this morning(!) with wool felt and fiberglass
the purple trace is the separate baffle with speaker
But I remembered seeing a reference to it a long time ago. A google search found that plot for me again. Look at the impedance plot on this page from Linkwitz designing his Pluto speaker:
Pluto construction
Basically the same thing I was doing chasing that little wiggle 😀.
See the difference in a well stuffed plot with fiberglass and angel hair compared to the attempt from early this morning(!) with wool felt and fiberglass
the purple trace is the separate baffle with speaker
Last edited:
elegant way to get rid of your surplus plumbing... 😀Look at the impedance plot on this page from Linkwitz designing his Pluto speaker:
Pluto construction
Basically the same thing I was doing chasing that little wiggle 😀.
First one is up and running... First impression: very happy 😀.
I'll wait to say more until I run the second one and proper EQ.
For now I just used an estimate from the known EQ curves...
I'll wait to say more until I run the second one and proper EQ.
For now I just used an estimate from the known EQ curves...
Congratulations...
In my experience, you can usually tell in a few minutes if a component has that "something special". Sounds like you are on track for a great stereo experience.
Keep up the good work and keep us posted.
In my experience, you can usually tell in a few minutes if a component has that "something special". Sounds like you are on track for a great stereo experience.
Keep up the good work and keep us posted.
First one is up and running... First impression: very happy 😀.
I'll wait to say more until I run the second one and proper EQ.
For now I just used an estimate from the known EQ curves...
Hooray! First Sound!

Congratulations...
In my experience, you can usually tell in a few minutes if a component has that "something special". Sounds like you are on track for a great stereo experience.
Keep up the good work and keep us posted.
I know what you mean, there were 4 people in the house when I fired it up for the first time. I noticed everybody was moving along with the music. I.m.h.o. that is a very good sign. One thing I noticed on my experience with audio, car or home: timing is everything!
Congratulations!
And take it from one who has lived with these kind of speakers, you will have an even greater grin on your face, when you get the pair up and running...;-)
Great work!
Koldby
And take it from one who has lived with these kind of speakers, you will have an even greater grin on your face, when you get the pair up and running...;-)
Great work!
Koldby
Thank you, Koldby for giving me the idea for this baffle! 😀
After seeing those sleek towers of you with the recessed speakers I was sold!
After seeing those sleek towers of you with the recessed speakers I was sold!
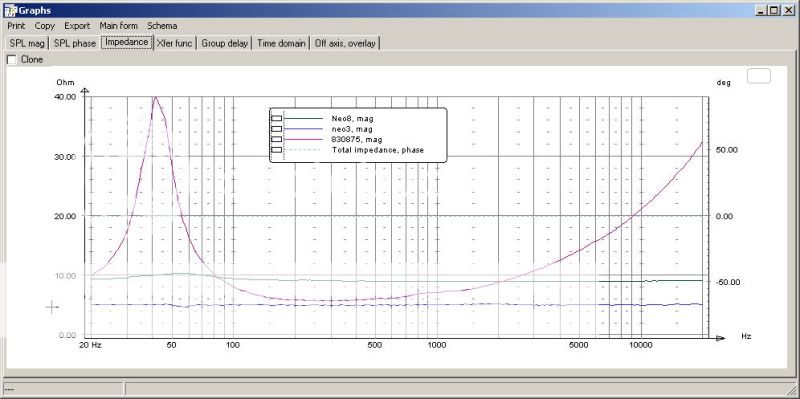
Impedance and Phase of the finished speaker:

(had to wait for everyone to be asleep 😉)
As I see it, the test speaker paid off. Still a wiggle in the peak of the resonance from all the different drivers adding up (I guess).
The peak is surprisingly low at 150 Hz. Not bad at all. Hope the next one stacks up.
Would love to see an Impedance plot of one of the arrays from you guys, Koldby? Halair?
Last edited:
I know you will have a huge grin on your face when you sit down and listen to both of them for the first time.
All that work paid off.
All that work paid off.
.....Still a wiggle in the peak of the resonance from all the different drivers adding up (I guess).....
Hi wesayso allow me post this fantastic thread those arrays really got some care and ended stunning beautiful, great thanks sharing.
Let's say the drivers and box volumes are reasonable matched specs. Could it be the different groups of drivers not have same cable lenght, it's a guess one would cut cables to the groups of speakers nearest the common point where amp low z arrive a little shorter than groups farther away giving a uneven electrical path to common dampening z and time to stop drivers at same time. Reason could also be drivers need run in time to get same mechanical flex and thereby start/stop synchronicity.
Cable length probably doesn't matter as electrical signals travel ~1 ft (11 inches) per nanosecond. 8 ft difference is 8 ns or characteristic freq of circa 100MHz - too high to show up in the kHz regime. I have seen wiggles on my impedance sweeps and often it was something loose. Like a panel or driver not screwed in tight. You might have cracked basket, however, the wiggles are so small I wouldn't worry unless you hear something. What does the harmonic distortion plots look like? Is there a HD peak near the resonance peak wiggle of 150Hz? That freq is close to resonance frequency of cabinets.
Cable length isn't the cause, as X explained. I looked for impedance plots of line arrays using google and found two that actually confirm somewhat what I have been thinking:
Final Array Measurements
(image from above linked page, by Rob Elder, used for reference)
Here you see the same wiggles except there's also a few wiggles (resonances of the cabinet) in the downward curve.
Another I found:
http://www.htguide.com/forum/showthread.php?31848-New-Home-for-the-BG-Ribbons-Part-27&p=472006&viewfull=1#post472006
(image from above linked thread, by user chasw98, used for reference)
Same wiggle at reference peak, no cabinet as it is open baffle.
So my take on this would still be the different drivers adding up with series/parallel wiring. I guess if you only used parallel wiring it would even out the resonance peaks. And give you an impossible load for the amplifier.
I took impedance measurements of every single speaker while on the baffle and the spread of resonance peaks is a rather big area:

The average peak from these 25 drivers lands at 138 Hz. The shape of all those plots agrees quite well with the wiggle seen in the
finished array.
I'm pleased to see that smooth phase curve and the generally clean impedance plot. It seems to indicate a lack of resonances of the cabinet.
Laying my ear flat to the back and sides while playing music reveals no sounds whatsoever. 🙂
Final Array Measurements
(image from above linked page, by Rob Elder, used for reference)
Here you see the same wiggles except there's also a few wiggles (resonances of the cabinet) in the downward curve.
Another I found:
http://www.htguide.com/forum/showthread.php?31848-New-Home-for-the-BG-Ribbons-Part-27&p=472006&viewfull=1#post472006
(image from above linked thread, by user chasw98, used for reference)
Same wiggle at reference peak, no cabinet as it is open baffle.
So my take on this would still be the different drivers adding up with series/parallel wiring. I guess if you only used parallel wiring it would even out the resonance peaks. And give you an impossible load for the amplifier.
I took impedance measurements of every single speaker while on the baffle and the spread of resonance peaks is a rather big area:
The average peak from these 25 drivers lands at 138 Hz. The shape of all those plots agrees quite well with the wiggle seen in the
finished array.
I'm pleased to see that smooth phase curve and the generally clean impedance plot. It seems to indicate a lack of resonances of the cabinet.
Laying my ear flat to the back and sides while playing music reveals no sounds whatsoever. 🙂
Last edited:
Nice work Wesayso - I think you have driven this to ground. One could simulate the effect of 25 parallel-series drivers (with 25 driver specs with different fs for each) in a sealed cabinet and see what predicted impedance curves look like. Actually, I have a detailed model of your tower including the vent holes in between each box - I used for a simulation of the analog EQ circuit and predicted EQ curve needed a while back. 🙂
- Home
- Loudspeakers
- Full Range
- The making of: The Two Towers (a 25 driver Full Range line array)