I figured as much about your post being aimed at nc... but I'm sure there are enough readers following this so for reasons of clarity I posted the idea behind my plans 🙂.
and I appreciate those pictures and am looking forward to doing similar ones myself. I see the reduction of the amount of "hash" in an unsmoothed measurement from averaging but what I would really like to see is how big a difference there is in a highly smoothed average that one might equalize to compared to a similarly smoothed single point measurement at the sweet spot.
Lately I've just been manually EQing to a single point measurement with FDW5 window while I sort things out. I knew that wasn't optimal but had other things to deal with first - and the results were very listenable.
I have a new mic and a new sound card, maybe things will be different. I thought my soundcard mic inputs had blown as I had lost about 40 db of sensitivity on both mic and timing loopback inputs. Further investigation pointed to a driver issue but re-downloading drivers didn't help. I wouldn't be surprised if this was a Windows update audio glitch as at the same time I began experiencing dropouts in the audio stream. But I will never know because I used this as an excuse to buy that Motu Ultalite MKIV I've been wanting.
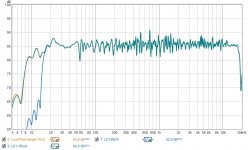
This is the difference between the two with 1/6 Octave smoothing, var smoothing will give greater resolution in the bass, FDW's have similar trends to the smoothed graphs.
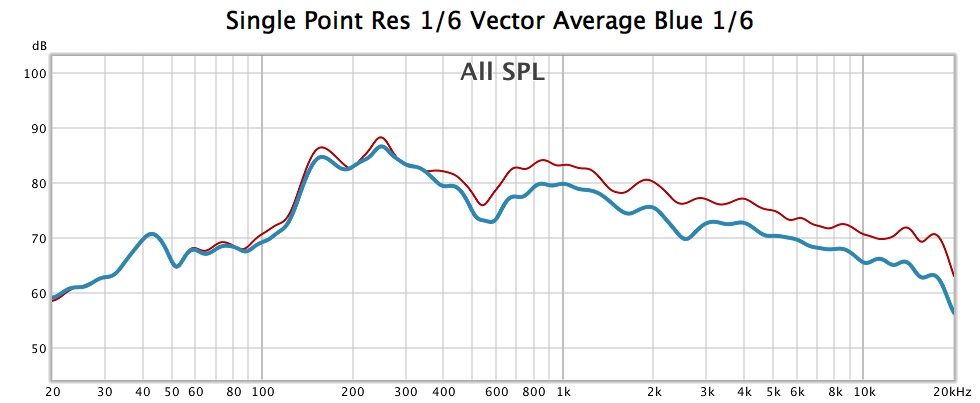
What it says to me is that the room adds sound above transition fairly evenly and some of the dips are filled in by the reflections, others are created. It's another way of looking at the data to see if you can get an answer on where to target processing.
I like that you don't need as much smoothing to see the general trend of the graph.
These were taken in an untreated room so they are a worst case scenario.
Attachments

Hey guys, very nice..the attention on averaging...and on what to correct.
I still feel like a babe in the woods here...watching closely.
Heading to a two-day Rational Acoustics class next month, that has a block devoted to averaging techniques. Hopefully will gain something to share....
I still feel like a babe in the woods here...watching closely.
Heading to a two-day Rational Acoustics class next month, that has a block devoted to averaging techniques. Hopefully will gain something to share....
Thanks for posting the graphs. Looks like the difference is pretty close to a shelving function applied to above the room transition. If that is the case can we simply take some averaged measurements and apply shelf funtion to personal taste?
you certainly can start with an HF shelf, as I have. what to do beyond that is the question as the room inevitably intrudes
Thanks for posting the graphs. Looks like the difference is pretty close to a shelving function applied to above the room transition. If that is the case can we simply take some averaged measurements and apply shelf function to personal taste?
It depends on your room and if any treatment has been applied, that trend does not appear in wesayso's measurements because of his damping panels. Try it and see what you have.
Due to some unfortunate life events I haven't been able to make much progress.
I did play around with my processing to see if I could win something there. I have often mentioned I do some phase manipulation down low in my room. Basically trying to get the timing results at the listening spot. In order to get there I went outside of the usual DRC_FIR recommended parameters for excess phase correction. It's all documented here in this thread.
I've revisited that part of my processing chain. It turns out I can actually win something there. To speed up processing I advocated a 2 step processing. In other words, run a correction on the measured result with DRC_FIR. Manipulate that some with a bit of EQ and run the result trough DRC again.
Instead of having those big parameters to "fix" the lower phase I reverted back to settings close to default within DRC and use RePhase for phase manipulation after the first run of DRC.
Many words here but the end result is promising. The excess phase numbers determine the smoothness of the pré peak build-up. The way I've had it set, with bigger numbers than advertised, this build up of the wave was left more "uncontrolled" for lack of better words. This meant that the pré ringing was significantly higher than it needs to be.
Old settings to let DRC_FIR correct phase were like this:
I reverted back to these numbers:
At first I tried to have 2 different processing templates, still letting DRC_FIR correct the phase (so rough EP settings at the first stage, followed by finer secondary steps) but the end result was still very much like the first stage.
By separating these steps, using RePhase to do the phase manipulation, I did see a positive change for the better. Everything from 200 Hz and up shows a remarkable improvement in pré ringing, bringing it down way further than before.
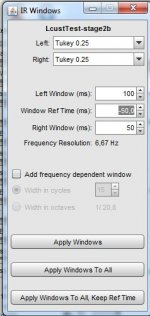
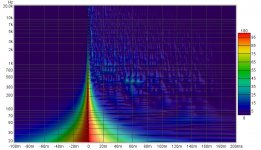
In order to see the pré ringing quickly I often use a gating window in REW that zooms in on everything before the peak, something like this:

(I probably have mentioned this before)
Don't use any smoothing (not even 1/48 octave) or FDW's.
I did play around with my processing to see if I could win something there. I have often mentioned I do some phase manipulation down low in my room. Basically trying to get the timing results at the listening spot. In order to get there I went outside of the usual DRC_FIR recommended parameters for excess phase correction. It's all documented here in this thread.
I've revisited that part of my processing chain. It turns out I can actually win something there. To speed up processing I advocated a 2 step processing. In other words, run a correction on the measured result with DRC_FIR. Manipulate that some with a bit of EQ and run the result trough DRC again.
Instead of having those big parameters to "fix" the lower phase I reverted back to settings close to default within DRC and use RePhase for phase manipulation after the first run of DRC.
Many words here but the end result is promising. The excess phase numbers determine the smoothness of the pré peak build-up. The way I've had it set, with bigger numbers than advertised, this build up of the wave was left more "uncontrolled" for lack of better words. This meant that the pré ringing was significantly higher than it needs to be.
Old settings to let DRC_FIR correct phase were like this:
Code:
--EPWindowGap=17 --EPLowerWindow=13094 --EPPFFinalWindow=13094 --EPUpperWindow=17 --EPWindowExponent=1.1I reverted back to these numbers:
Code:
--EPWindowGap=32 --EPLowerWindow=1366 --EPPFFinalWindow=1366 --EPUpperWindow=32 --EPWindowExponent=0.97At first I tried to have 2 different processing templates, still letting DRC_FIR correct the phase (so rough EP settings at the first stage, followed by finer secondary steps) but the end result was still very much like the first stage.
By separating these steps, using RePhase to do the phase manipulation, I did see a positive change for the better. Everything from 200 Hz and up shows a remarkable improvement in pré ringing, bringing it down way further than before.
In order to see the pré ringing quickly I often use a gating window in REW that zooms in on everything before the peak, something like this:
(I probably have mentioned this before)
Don't use any smoothing (not even 1/48 octave) or FDW's.
Attachments
By the way, this train of thought was inspired by published wavelets from nc535. Keep posting your results guys, lets advance our results together!
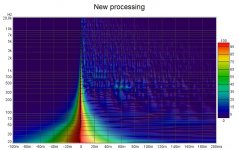
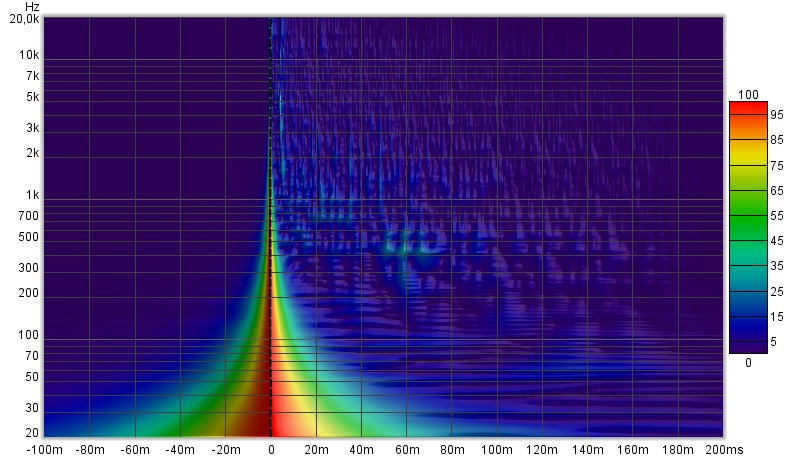
Pictures are worth more than words I guess, lets see a comparison:
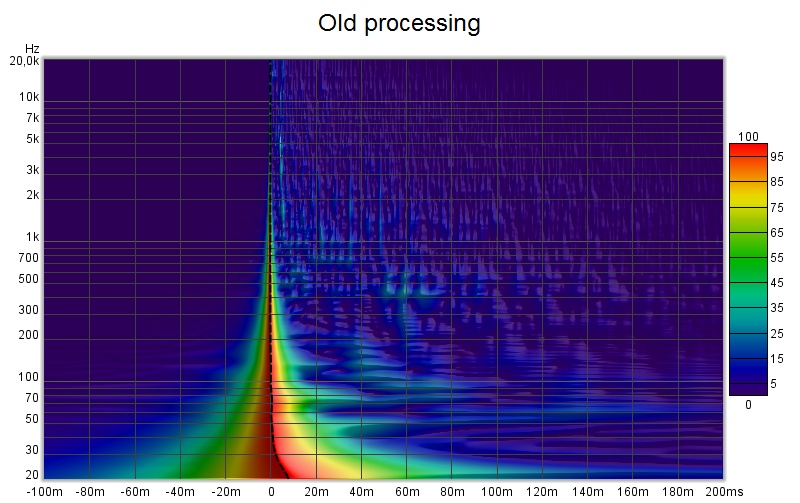
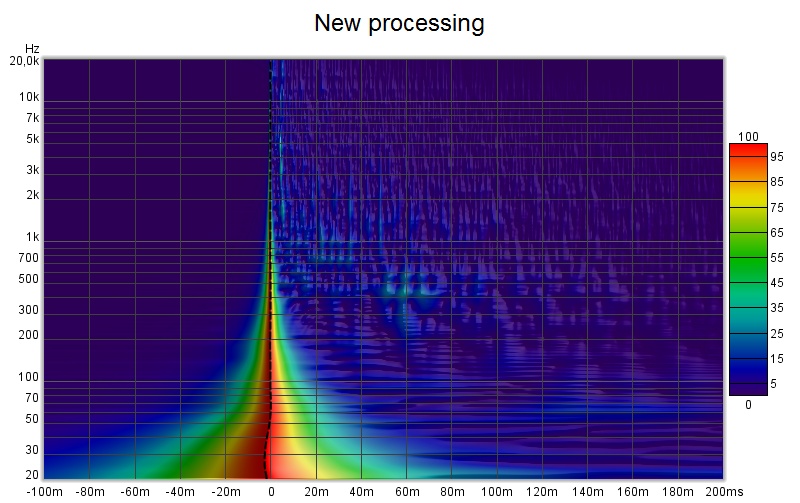
Don't mind the differences in phase, curvature etc... that's still to be solved. The second graph is extending flat all the way to 10 Hz, that still needs fixing.
Look at the deep purple/blue sea to the left of the peak instead. That's where the mayor differences are.
Pictures are worth more than words I guess, lets see a comparison:
Don't mind the differences in phase, curvature etc... that's still to be solved. The second graph is extending flat all the way to 10 Hz, that still needs fixing.
Look at the deep purple/blue sea to the left of the peak instead. That's where the mayor differences are.
Attachments

Last edited:
Code:
--EPWindowGap=17 --EPLowerWindow=1366 --EPPFFinalWindow=1366 --EPUpperWindow=17 --EPWindowExponent=0.97A small update after many trials to see where the optimum results can be achieved.
In between I'm still listening to the old version, There's still enough to do before I can get going with a direct comparison. Listening to a lot of Pink Floyd these days and am loving it.
I do wonder if these tweaks will have a big influence. Time will tell.
Attachments

By the way, this train of thought was inspired by published wavelets from nc535. Keep posting your results guys, lets advance our results together!
Don't mind the differences in phase, curvature etc... that's still to be solved. The second graph is extending flat all the way to 10 Hz, that still needs fixing.
Look at the deep purple/blue sea to the left of the peak instead. That's where the mayor differences are.
It looks like you are flattening phase all the way to the bottom these days. Thinking back to development of my Synergies, does that represent a change in your thinking?
I really hesitate to dial in that much correction. I'm at 65K taps just to be able to correct magnitude at 20 Hz
No, that will change again once I apply the room curve. I'm only concentrating on a flat target with minimum pré-ringing at the moment.
It's still early in the process, I intent to apply the room curve and low frequency roll-off separately within JRiver.
It's still early in the process, I intent to apply the room curve and low frequency roll-off separately within JRiver.
Here's the final shape of the flat target (flat out to at least 10 Hz). It won't ever be run like this, it is just the first step of separating the processing from the target EQ.
This way it becomes easier to EQ to a target/room curve with IIR PEQ. Similar to EQ-ing a driver flat and then applying the crossover 😉.
I've spend lots of time to find the way to do it while minimising the pré ringing compared to earlier attempts.
Next step is to do the same with an averaged multipoint measurement. I'll first try it out on earlier (averaged) measurements,
this one was done with a single point measurement.
Attachments
Last edited:
I'm working hard to get my double DRC processing working, while keeping it simple. Not an easy task.
In the old single point days, I would just measure... let DRC do it's correction and look at the prediction to see if I was in the ball park. Next I would take new measurements with the correction applied and EQ based on those to balance/even out the left and right channels.
With averaged measurements that's quite a bit of work. In other words I cannot simply take control measurements to see if all goes well.
If you measure "live" out in the room you apply the microphone compensation to see what you get. DRC's predictions also apply that correction and gets you close to a right prediction. However my own "virtual predictions" differ ever so slightly from those DRC predictions. The virtual predictions are just an impulse of the measured result run though JRiver with convolution and maybe some EQ. However, the measured REW results when exported lack the microphone compensation values. So the prediction needs the CAL file for the microphone applied to it.
If I work with the DRC predictions, the first round of DRC processing needs the microphone compensation within DRC, the second round has to omit this compensation step as it is already present in the (first) prediction.
If I use the virtual JRiver runs as the base, both rounds of DRC need microphone compensation. Very easy to get it wrong.
That's when control measurements come in handy 🙂. But I simply don't have the time...
I brought up that issue of mic correction not being in the export to John of REW and he didn't see this issue. I know when I view an mdat on another computer the correction seems to have been applied despite not having the correction file configured on that 2nd computer. A mic corrected IR export from REW would be nice.
And I agree, the DRC process has too many steps, too many opportunities to make a mistake or simply takes so much time you can't experiment as much as you would like.
I'm using simple REW FDW and measurement averaging to get good results quickly then seduced into listening instead of going further. With your subs you may have to do XO or blend with subs outside DRC then apply DRC as final correction/global EQ.
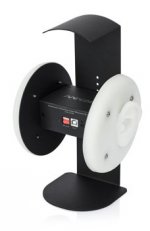
Ronald, I recall you were wanting to experiment with head-mounted microphones on foam wig stands for your filtering work. Just wanted to make you aware of these should your budget ever allow: 3Dio Free Space Binaural Microphone
With averaged measurements that's quite a bit of work. In other words I cannot simply take control measurements to see if all goes well.
I have been letting my ears be the guide for that step as average check measurements are a time eater.
I also like using REW for all the combination stages rather than measuring through Jriver to save me time, without doing check measurements it's hard to say if small errors are creeping in.
Ronald, I recall you were wanting to experiment with head-mounted microphones on foam wig stands for your filtering work. Just wanted to make you aware of these should your budget ever allow: 3Dio Free Space Binaural Microphone
Thanks for the tip, I remember BYRTT showing me this one from MiniDSP:
miniDSP EARS - USB Headphone Test Fixture
Attachments
I have been letting my ears be the guide for that step as average check measurements are a time eater.
I also like using REW for all the combination stages rather than measuring through Jriver to save me time, without doing check measurements it's hard to say if small errors are creeping in.
I'll compare the DRC predictions with convolution in REW (A * B) and JRiver virtual run through and pick one to go with. Both REW and JRiver will need the mic compensation applied.
I've just done this test. The FR curve of DRC (predicted) and JRiver with Mic compensation are more or less identical. REW's (A * B) result only differs below 20 Hz.
The interesting part is, REW and JRiver agree on phase timing, while DRC's prediction slightly differs from that.
Attachments
Last edited:
This leads me to my conclusion that I'll continue to use (and trust in) JRiver's virtual runs. The differences are small, it won't change things much, but when optimising things you've got to pick one or the other anyway. The JRiver way is the slowest and most time consuming for me to use, but I'll take it anyway.
Much of the work I've done so far will still be mostly valid for the JRiver runs (like the RePhase edits etc.)
Much of the work I've done so far will still be mostly valid for the JRiver runs (like the RePhase edits etc.)
Last edited:
- Home
- Loudspeakers
- Full Range
- The making of: The Two Towers (a 25 driver Full Range line array)