There is a problem with wet play. It's a one way street. For reasons no one has yet worked out, once you wet play a record you always have to wet play it.
It's been my Experience that Nylon is hydroscopic.. It happily absorbs water. That would certainly explain the why of it.
No idea if LP's contain Nylon though.
Maybe it does... as part of the Concoction?
Hi LDHi Hans, the floor of 1/f noise should have a -6dB/octave gradient if it is there and dominant, but neither your measured nor calculated curves show this. I don't understand where the idea of a 250Hz corner comes from, but you can see in my measured dry plot there is no corner: the line pretty much follows -6dB/octave.
LD
Scott Wurcer spoke some wise words when he said: It is not important who is right, all that matters is to get it right".
I took your picture, and painted in blue a 6dB/oct line starting at 100Hz.
As you can see, this differs from the noise in your picture.
Then I painted in yellow the base noise line.
The point where the measured noise lies 3 dB above the base noise is the corner frequency.
This is roughly at the same 250 Hz as in my measurement.
Compare this mechanism to 1/f noise in Fets and Op amps.

Hans
Hi LD
Scott Wurcer spoke some wise words when he said: It is not important who is right, all that matters is to get it right".
I took your picture, and painted in blue a 6dB/oct line starting at 100Hz.
As you can see, this differs from the noise in your picture.
Then I painted in yellow the base noise line.
The point where the measured noise lies 3 dB above the base noise is the corner frequency.
This is roughly at the same 250 Hz as in my measurement.
Compare this mechanism to 1/f noise in Fets and Op amps.
View attachment 573226
Hans
Hi Hans, thanks and no problems here.
You happen to have selected a start point and arbitrary region where the fit is particularly poor, not least because there is a lot going on. The octave between 1kHz and 2kHz and thereabouts, for example, shows -6dB or so, and so on. What is clear is that there is a gradient, whereas there is no gradient in the measurement with low friction. Also thoroughly clear is a -10 to -15dB reduction in noise level, on average, as measured, with low friction, whilst signal level remained roughly constant.
Yes, one has to be selective to say the curve roughly fits 1/f, but does for at least an octave or two. However, the fit is not good especially at low f. The mechanism I believe is stick-slip motion, and although the friction force may follow a 1/f flicker law, motion itself only results when friction force exceeds a certain threshold, and only motion produces noise. It is very different from mechanisms in semiconductors, I think, which behave more ideally.
At certainty of ruining your test disc, you could repeat my result for yourself, but IME it tallies with audible results and I would stand by the measurement result, if not the interpretation and explanation of mechanism/law.
Even if it means that 'better than cutter S/N noise spec' is achievable, because I doubt that spec anticipated ultra-low playback friction.
LD
Even if it means that 'better than cutter S/N noise spec' is achievable, because I doubt that spec anticipated ultra-low playback friction.
LD
Good to see you back, your stuff challenges a lot and I love it. A complete understanding of static and dynamic friction is not for the faint of heart and I can easily see why this was never addressed full on.
Last edited:
1/f friction noise that starts and stops in the middle of the frequency range?Yes, one has to be selective to say the curve roughly fits 1/f, but does for at least an octave or two. However, the fit is not good especially at low f. The mechanism I believe is stick-slip motion, and although the friction force may follow a 1/f flicker law, motion itself only results when friction force exceeds a certain threshold, and only motion produces noise. It is very different from mechanisms in semiconductors, I think, which behave more ideally.
Highly unlikely to my opinion.
I will try to perform this experiment next week.At certainty of ruining your test disc, you could repeat my result for yourself, but IME it tallies with audible results and I would stand by the measurement result, if not the interpretation and explanation of mechanism/law.
But as you know, just one test does hardly prove anything, but it may help to further support a suspicion.
Hans
Good to see you back, your stuff challenges a lot and I love it. A complete understanding of static and dynamic friction is not for the faint of heart and I can easily see why this was never addressed full on.
Thank you, Scott. By no means am I always right either ! And yes, the role of friction in surface noise seems under-addressed at minimum, yet I have no doubt it can have profound effect and unifies a lot of otherwise difficult to explain observations.
1/f friction noise that starts and stops in the middle of the frequency range?
Highly unlikely to my opinion.
It is a complex artefact of the random nature of stick-slip mechanics involved, I think.
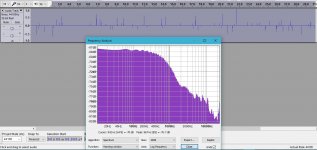
A few years back I successfully simulated authentic sounding surface noise, crackle-pop-tick. I used a pink noise sample, and applied a noise gate with a threshold a few dB below peak level, leaving just the residue with amplitude above, say -2dB. The waveform resulting is a random series of short spikey events which vary in amplitude. It is immediately audibly recognisable as very similar to surface noise.
In mechanics, I believe the pink noise represents random variation in friction force between stylus and groove. Above a certain threshold, a stylus can stick/lose contact with the groove, and this is represented by the noise gate threshold.
Attached is an example of a waveform and its spectrum for a 30s sample at -2dB. You can see the events resemble random amplitude impulse like spikes which occur randomly in time. The resulting spectrum is complex, random to a large extent, and has gradients which characterise certain regions.
Obviously, this is only a crude simulation, but I found the resulting spectrum is always complex, has many regions, and depends critically upon the colour of the pink noise source as well as the threshold. Most remarkable is how much like real crackle-pop-tick noise this sounds !
LD
Attachments
Last edited:
LD,It is a complex artefact of the random nature of stick-slip mechanics involved, I think.
A few years back I successfully simulated authentic sounding surface noise, crackle-pop-tick. I used a pink noise sample, and applied a noise gate with a threshold a few dB below peak level, leaving just the residue with amplitude above, say -2dB. The waveform resulting is a random series of short spikey events which vary in amplitude. It is immediately audibly recognisable as very similar to surface noise.
In mechanics, I believe the pink noise represents random variation in friction force between stylus and groove. Above a certain threshold, a stylus can stick/lose contact with the groove, and this is represented by the noise gate threshold.
Attached is an example of a waveform and its spectrum for a 30s sample at -2dB. You can see the events resemble random amplitude impulse like spikes which occur randomly in time. The resulting spectrum is complex, random to a large extent, and has gradients which characterise certain regions.
Obviously, this is only a crude simulation, but I found the resulting spectrum is always complex, has many regions, and depends critically upon the colour of the pink noise source as well as the threshold. Most remarkable is how much like real crackle-pop-tick noise this sounds !
LD
When comparing noise from a recording with a silent track and a recording with a 0dB 1Khz tone, when the needle would be loosing contact every now and then with the groove, it would certainly happen more often when following a strongly modulated tone than with an absolutely flat groove without any modulation at all, wouldn't it ?
And following your suggestion on this phenomenon, the spectrum of the noise would change accordingly, especially in the range up to 2Khz where energy in your figure is the highest.
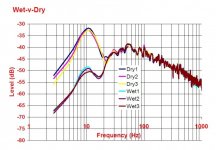
However, look at the figure below representing the spectra of the left and the right channel in both situations. LF Noise is not affected by the 1Khz tone.

The lower spectrum is recorded with the arm in the air and the motor running, showing the background noise of the whole playback system.
And what about static electricity as a probable cause for causing clicks ?
A highly static LP produces much more click to my experience.
Could it be that a fluid helps in suppressing this ?
Hans
When comparing noise from a recording with a silent track and a recording with a 0dB 1Khz tone, when the needle would be loosing contact every now and then with the groove, it would certainly happen more often when following a strongly modulated tone than with an absolutely flat groove without any modulation at all, wouldn't it ?
Yes. And exactly this happens. In programme material when there is a clear loud high pitch tone, background crackle-pop can be significantly elevated. There is a particular Tom Petty track which demonstrates this beautifully, I'll look it out. On some test records, loud test tones which are inaudible to me because they are, say at 18kHz, can clearly have notable elevation in surface noise when the test tone starts and stops. In other program material, such effects are masked by the level of the programme material itself; only certain material allows it to be heard because programme material masks it, but it probably happens often, whenever trackability is stressed.
It is not mistracking, in the classic sense; it arises because difficult tracking programme material 'consumes' VTF budget, then threshold for friction force required to cause the stylus to lose contact becomes lower, so surface noise notably goes up.
In arms with an offset angle, the effect is often more pronounced on one channel, depending on skate force balance. This is because the offset angle invokes variation in skate torque in response to variations in friction, and peaks always pull the stylus onto the inner groove wall.
However, look at the figure below representing the spectra of the left and the right channel in both situations. LF Noise is not affected by the 1Khz tone.
If I understand the plot, there is about 4-6dB difference w/o the test tone, over at least apportion of the LF spectrum.
Another huge discovery for me was the effect of ultra-low friction on sub audio spectrum, specifically the arm-suspension resonance. Attached is a plot showing LF spectrum wet-versus dry, repeated three times for certainty because it is such a remarkable result.
You can see there is a profound reduction in the amplitude of the classic arm resonant response, whilst the Q remains roughly unaltered implying damping remains unaltered !!
After much thought, I realised that random variation in friction causes random variation in skate force. I concluded that reduction in random groove-stylus friction reduces stimulus for motion of the arm, hence reduction of the amplitude of the resonance in the spectrum because a significant stimulus has been reduced. The arm is thus far more stable with ultra-low stylus-groove friction.
This, I believe, is evidence that friction force varies.
And what about static electricity as a probable cause for causing clicks ?
A highly static LP produces much more click to my experience.
Could it be that a fluid helps in suppressing this ?
Reduction is surface noise correlates very well with reduction in friction coefficient, it doesn't matter how reduction in friction is obtained.
It could well be that friction and static correlate, of course. But some friction reducing methods also introduce terrible static problems, which show up as a completely separate sound and noise problem whilst being effective at reducing crackle-pop-tick. This leads me to think the noise mechanism isn't static discharge. Also see the link with trackability above.
LD
Attachments
Look again and you will see that the portion that is higher in noise is the noise with an unmodulated trace. This does not correspond with your findings in any way.If I understand the plot, there is about 4-6dB difference w/o the test tone, over at least apportion of the LF spectrum.
Looking at your figure, it must be that some form of a rumble filter is attenuation the low frequencies.Another huge discovery for me was the effect of ultra-low friction on sub audio spectrum, specifically the arm-suspension resonance. Attached is a plot showing LF spectrum wet-versus dry, repeated three times for certainty because it is such a remarkable result.
You can see there is a profound reduction in the amplitude of the classic arm resonant response, whilst the Q remains roughly unaltered implying damping remains unaltered !!
In my recording no rumble filtering at all was taken place (-3dB at 1Hz), and I see nothing of the sort of bump that you have at 10 Hz.
Again our findings are completely different for whatever reason.
I respect your findings, but I can only repeat that results of the measurements of one set, do not implicate a general truth.
One swallow does not make a summer.
As promised, I will do a dry and wet measurement in the coming week and report my findings.
Hans
Last edited:
Another huge discovery for me was the effect of ultra-low friction on sub audio spectrum, specifically the arm-suspension resonance. Attached is a plot showing LF spectrum wet-versus dry, repeated three times for certainty because it is such a remarkable result.
You can see there is a profound reduction in the amplitude of the classic arm resonant response, whilst the Q remains roughly unaltered implying damping remains unaltered !!
Wonderful, an experiment that works on any expendable LP. My take is a simple 20dB reduction in excitation of the resonance. BTW I've played with ClickFix a free Audition and CoolEdit plug-in which operates on signal statistics not spectrum and works amazingly well with a very clever alternative to straight interpolation.
Last edited:
Wonderful, an experiment that works on any expendable LP. My take is a simple 20dB reduction in excitation of the resonance. BTW I've played with ClickFix a free Audition and CoolEdit plug-in which operates on signal statistics not spectrum and works amazingly well with a very clever alternative to straight interpolation.
Yes, it's so easy and tempting to write off test discs with this stuff. This one is easy and cheap though. Will check out those plug ins, though I find it hard to imagine how they can distinguish noise from content, especially in the context of comments that noise is content specific?
Look again and you will see that the portion that is higher in noise is the noise with an unmodulated trace. This does not correspond with your findings in any way.
I did look again, and it's not possible to tell from your plot which curve is which because colours are the same and they cross over. In any event, a 4-6dB difference is surely unexpected, would need explaining, and would fit if there were some confusion as to which trace is which ?
In any event, 1kHz at 0dB (5.6cm/s) is not exactly a tracking challenge. To see the effect clearly it's necessary to stretch trackability somewhat.
Looking at your figure, it must be that some form of a rumble filter is attenuation the low frequencies.
In my recording no rumble filtering at all was taken place (-3dB at 1Hz), and I see nothing of the sort of bump that you have at 10 Hz.
Again our findings are completely different for whatever reason.
The cartridge-arm resonance at c 10Hz is well known, pronounced, and shows up readily in just about all LF spectra. It's a crucial part of cartridge-arm mechanics. My preamps have a roll off with a corner c 3Hz, so what you see is pretty much what you get. The curious question is why you apparently don't see it in your plots, Hans ?
LD
Hans, I looked again at your plot. If you check out the octaves above and below the 1kHz test tone, you'll see the noise floor is c 6-8dB higher when the test tone is present, also there is notable difference between the channels when the test tone is present, more noise on one channel - see my mail above!
LD
LD
1) I am afraid you are loosing yourself into details that have a completely different reason to be there.Hans, I looked again at your plot. If you check out the octaves above and below the 1kHz test tone, you'll see the noise floor is c 6-8dB higher when the test tone is present, also there is notable difference between the channels when the test tone is present, more noise on one channel - see my mail above!
LD
What you see around 1Khz are of course the sidebands belonging to the type of windowing, making the peak somewhat wider and the sidebands significantly lower. In this particular case the sidebands are starting at ca -80 dB below the peak, you can't get it better than that.
2) And the difference of 1 or 2 dB in noise between channels is also completely insignificant in a noisy signal.
Concentrate on significant facts and not on details of details.
3) A 1Khz 0dB signal is a giant step in strain on the needle compared to a blank trace, you do not seem to accept information that does not fit into your theories.
Again I do not doubt your measurements, but your attempts to explain and prove things are not enough substantiated.
Before jumping to conclusions, one will have to collect much more data from different platforms.
The information provided by me has no other reason than to show how much platforms can differ.
I can only repeat, one swallow does not make a summer.
Hans
1) I am afraid you are loosing yourself into details that have a completely different reason to be there.
What you see around 1Khz are of course the sidebands belonging to the type of windowing, making the peak somewhat wider and the sidebands significantly lower. In this particular case the sidebands are starting at ca -80 dB below the peak, you can't get it better than that.
OK, but these are your measurements, and I don't see the point in analysis and presentation that isn't capable of resolving the phenemenom you are looking for. Even so, there are interesting hints such as difference between channels, and differences in the lf spectrum, outside the sidebands.
What one might say, positively, is your setup and test disc appears very quiet, and you apparently are looking for a phenemenum that isn't prominent or perhaps isn't even there in that particular test and conditions.
As already said, your LF analysis appears to lack the normal cart-arm resonance, for example, which is also very odd.
A 1Khz 0dB signal is a giant step in strain on the needle compared to a blank trace,
Not really, Hans. In fact it might only represent c 12.5um of tracking deflection, peak groove angle c 9 deg, peak groove curvature c 500um, and about 50G of peak stylus acceleration. That is all pretty modest and undemanding stuff.
IME, the increase in surface noise phenomenum you're looking for shows up readily near the limit of trackability, for example c 18kHz@2.5 cm/S, acceleration near 500G. Also, moving up in tone frequency helps clear the audioband of sidebands and artefacts, makes it easier to analyse and, indeed, clearly hear the noise difference IME.
An audio track which shows it up beautifully is the intro to You Can Still Change Your Mind, Tom Petty, MCA MCF3098. Later versions deleted the intro, perhaps because it is a very loud warble sweep starting at about 8khz that no doubt proved difficult? It is actually a sped up piano arpeggio ! What one notices is significant and sudden increase in surface noise as the sweep begins.
And no worries, this is just an interesting DIY discussion, not some peer review !
LD
Last edited:
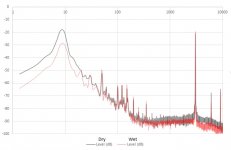
AFAIK, the only other case of someone sacrificing a test disc in the cause of examining wet-v-dry noise, appears to confirm my own measurements.
Both as to significant improvement to general noise floor, c 6 - 10dB, and significant improvement to cart-arm resonance amplitude, ie arm stability.
Attached is the spectrum for wet versus dry, but since the files came from a 3rd party some time ago, I know few details. It seems to be a c 3kHz test tone, in two wav sample files.
Anyways, here's the raw spectra, attached that show the analysis.
LD
Attachments
As already said, your LF analysis appears to lack the normal cart-arm resonance, for example, which is also very odd.
For sure my cart arm shows like every other 2nd order system a resonance peak when stimulating with sweeping sinewave.
So nothing special, but this is hardly reflected in the noise when playing a blank trace or a 1Khz tone.

I will inform Max Verstappen that 50G is still pretty modest 😀In fact it might only represent c 12.5um of tracking deflection, peak groove angle c 9 deg, peak groove curvature c 500um, and about 50G of peak stylus acceleration. That is all pretty modest and undemanding stuff.
I can't confirm nor deny this. I simply do not have this record but it does not seem to be the kind of music that is normally played.An audio track which shows it up beautifully is the intro to You Can Still Change Your Mind, Tom Petty, MCA MCF3098. Later versions deleted the intro, perhaps because it is a very loud warble sweep starting at about 8khz that no doubt proved difficult? It is actually a sped up piano arpeggio ! What one notices is significant and sudden increase in surface noise as the sweep begins.
But I have the impression we are deviating from the original subject, being that playing wet has a significant bonus in noise production as opposed to dry playing.
It would be more scientifically if we both start with recording blank tracks dry and wet from 10Hz to 2Khz or if you prefer to 20 Khz using known parameters like filter bandwidth, with a known recording time and the same number of spectra used for averaging.
That prevents us from comparing apples to oranges.
From there on we can go step by step and try to understand what the differences are and the why of these differences.
Hans
I was wondering why the correct SRA wasn't mentioned as #1 improvement for reducing tracking noise. At least in my system it worked better than anything else. The typically recommended VTA adjustments are useless in most cases because the stylus is more off than what a little up or down would be able to correct. How to Use a USB Digital Microscope to set 92 Degree Stylus Rake Angle (SRA) | Analog Planet
- Home
- Source & Line
- Analogue Source
- Reducing Record Surface Noise - I want to know all Approaches