Thanks Matt, I'll try what you suggested. Where is the best place to leave feedback, possible bugs and suggestions.Hi @Stuartmp, Currently you need to make a change to offsets, exit the settings, run, measure, stop, make a change, etc. Since you only need to do this once, it should't be too much of a bother.
There's currently a limitation where the settings can only be changed while the acquisition is stopped. That's because a sample rate change will force a reset of the DAC and ADC, and that can cause a very audible pop if things are running, so, for now, the sample rate changes (and thus the setting dialog) can only be changed while stopped.
On this forum, on Github etc?
For example. It maybe a good idea to automatically reset the averaging on amplitude or frequency changes. As if you change frequency for example and have averages set to 20 it takes quite a while to correct. It would be great if when you change frequency the averaging automatically resets.
Hi Stuart the most monitored forum is usually the QuantAsylum Forum forum--if you think a question has universal appeal then posting there is probably the best. Otherwise send to support or you can also post here but it's not as monitored. Additionally, the forum runs on Discourse which is phenomenal for sharing data. No having to save a picture to a file, upload, etc. Just copy the graph to your clipboard and paste into your forum post.
You can reset the averaging by pressing the "reset" button adjacent the averaging control. I think some control changes automatically restart it, but not all do. Sometimes it's kind of nice to turn it on and see the display morph over several cycles to the new value as it makes it easy to see if the noise is drifting up or down, or spurs are growing or shrinking.
Unrelated: An IEM tester starts shipping this week: Introducing the QA490
If you are developing and selling IEMs, this should be a very cost effective way to get some deep testing on the end of your manufacturing line.
2 quick question , just to check does anyone knows from top of their head, prior to try reading through 2K7 posts :
-files in #1 are last/actual ones ?
-are there Gerber files available, lazy to deal/involve all shipping headaches with Epcb just for one pcb ?
TIA
OK, I've done my homework - crawled through all posts 🙂
last QA400 interface iteration (QA400 interface gen 3) is in post #1129 QuantAsylum QA400 and QA401
now, just to find someone able to extract Gerber files from ExpressPCB ..... 🙂
This may solve your problem...
pdf2gerb: Convert PDF to Gerber and NC Drill formats
Personally, I'd extract the two layers using Photoshop as 600dpi jpg's and retrack using Sprint Layout which has the ability to load bitmaps of pcb's so they can be tracked and then output as gerbers and drill files. That way you know you output is correct. I do this regularly so I'm happy to recommend the method.
Attachments
Last edited:
now, just to find someone able to extract Gerber files from ExpressPCB ..... 🙂
Someone might have done this for transferring to Kicad. As far as I understand the ExpressPCB is either in XML or can be exported as XML. A littlebit of Python might do the trick to get it to Kicad format. But, as said. Someone might already have done it. A quick Google seems to indicate that others have looked at it. Schematic being the difficult part.
Mogens
A lot of people have visited this problem and very few have actually succeded. The one stand out was Copper Connection which could read EPCB files directly and if you had the paid registered version you could also output gerber and drill files. Didn't go down well with EPCB who promptly bought out the rights and then shut it down.
Although it could be an interesting challenge it's probably quicker to just redo the layout in Kicad.
Mogens
Mogens
thank you boyz for all the tricks
sorta busy with all other projects, but I hope finding some time to make that fine interface, so be able to use my QA400 in safer way
for now, EMU1212 was good enough , even with very crude passive interface box, but really needing something made in proper way
sorta busy with all other projects, but I hope finding some time to make that fine interface, so be able to use my QA400 in safer way
for now, EMU1212 was good enough , even with very crude passive interface box, but really needing something made in proper way
Distortion Measurements
Hi Guy's
I just thought that I would share some information & photo's showing the distortion measurements of my Honey Badger using the QuantAsylum QA401.
I only received the QA401 last week, and so far, I'm very happy with its performance.
I initially ran some loop back tests and discovered that the lowest THD levels were achieved with a input level of -10dBV and the lowest THD+N levels were achieved with a input level of 0dBV.
I was able to see a loop back THD distortion of 0.00025% at -10dBV input level and a loop back THD+N distortion of 0.00090% at 0dBV input level.
So I decided to try and find a common input level where I could still achieve good loopback results. It turned out that -5dBV was the best choice.
At a input level of -5dBV I was able to achieve 0.00037% THD and 0.00082% THD+N respectively during a loopback test.
I then accurately measured the gain of the Honey Badger. In my case it was 28.52dB or 26.6667 AV.
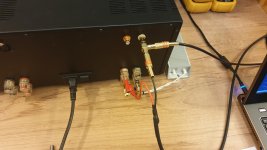
I wanted to test the amplifier at a medium power levels to begin with so I decided 80 WRMS into 8 ohms would be a good starting point. This equates to an output level of about 25.29V or about 28dBV. I also needed to make some type of attenuation circuit to drop that output level down to -5dBV so I could optimism the readings for the QA401.
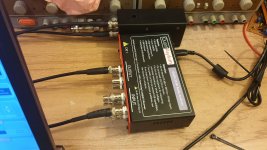
This was done by making a L-Pad attenuation circuit. It's the little black box behind the QA401.I measured the input impedance of the QA401 to be about 99K. I then created a spreadsheet to do the calculations for me. See the attached zip file if your interested. In future I will install a 6 position switch with different attenuation levels so I can run a range of output levels and still have -5dBV input into the QA401.
I then adjusted the Input gain level of the y-axis dBV scale on the QA401 so I could see the output power level on the display of the QA401.
The math to set the right level in the input box provided was 28.52 dB (from the Honey Badger) + 5.1 dB (which was the input level that I was getting without and input gain level adjustment due to my attenuation circuit) - 0.5dBV (which was the output level of the QA401 that I needed to achieve a output level from the Honey Badger of 28dBv or 80WRMS) this gave me a final value of 33.1dB
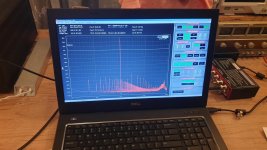
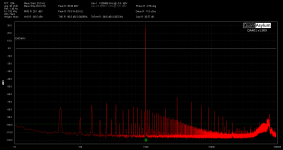
The results were very satisfying and a great starting point for further tweaking and measurement. I have attached a few images of my setup and the result plot.
I was able to achieve a reading of 0.00296% THD and 0.00374% THD+N.
To be honest I have no idea how to interpret the rest of the distortion levels and the harmonics caused by the 50Hz on the power supply.
Is this normal or is this an issue?
I would love to hear some feedback on this plot and what you guys think.
Cheers.
Hi Guy's
I just thought that I would share some information & photo's showing the distortion measurements of my Honey Badger using the QuantAsylum QA401.
I only received the QA401 last week, and so far, I'm very happy with its performance.
I initially ran some loop back tests and discovered that the lowest THD levels were achieved with a input level of -10dBV and the lowest THD+N levels were achieved with a input level of 0dBV.
I was able to see a loop back THD distortion of 0.00025% at -10dBV input level and a loop back THD+N distortion of 0.00090% at 0dBV input level.
So I decided to try and find a common input level where I could still achieve good loopback results. It turned out that -5dBV was the best choice.
At a input level of -5dBV I was able to achieve 0.00037% THD and 0.00082% THD+N respectively during a loopback test.
I then accurately measured the gain of the Honey Badger. In my case it was 28.52dB or 26.6667 AV.
I wanted to test the amplifier at a medium power levels to begin with so I decided 80 WRMS into 8 ohms would be a good starting point. This equates to an output level of about 25.29V or about 28dBV. I also needed to make some type of attenuation circuit to drop that output level down to -5dBV so I could optimism the readings for the QA401.
This was done by making a L-Pad attenuation circuit. It's the little black box behind the QA401.I measured the input impedance of the QA401 to be about 99K. I then created a spreadsheet to do the calculations for me. See the attached zip file if your interested. In future I will install a 6 position switch with different attenuation levels so I can run a range of output levels and still have -5dBV input into the QA401.
I then adjusted the Input gain level of the y-axis dBV scale on the QA401 so I could see the output power level on the display of the QA401.
The math to set the right level in the input box provided was 28.52 dB (from the Honey Badger) + 5.1 dB (which was the input level that I was getting without and input gain level adjustment due to my attenuation circuit) - 0.5dBV (which was the output level of the QA401 that I needed to achieve a output level from the Honey Badger of 28dBv or 80WRMS) this gave me a final value of 33.1dB
The results were very satisfying and a great starting point for further tweaking and measurement. I have attached a few images of my setup and the result plot.
I was able to achieve a reading of 0.00296% THD and 0.00374% THD+N.
To be honest I have no idea how to interpret the rest of the distortion levels and the harmonics caused by the 50Hz on the power supply.
Is this normal or is this an issue?
I would love to hear some feedback on this plot and what you guys think.
Cheers.
Attachments
Last edited:

HpW- please explain more what you are seeing with the QA401 on phase noise. I have been using it in ASIO quite successfully for some time with a variety of software, including another utility to convert to a windows audio device to support some obsolete software.
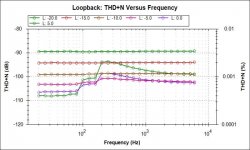
The graphic below from the QA401 user manual presumably illustrates normal results when using the THD vs Freq test plugin. The system returns a similar drop in THD at low frequencies on a 6LU8 pentode SE.
While it would be nice to take credit for -80 dB THD below ~200 Hz with this circuit neither the QA401 readout while the sweep is in process or other measurement devices return those numbers. Above ~200 Hz THD looks correct. Below it's ~20 dB optimistic.
No combination of settings appear to alter this behaviour. Am I missing something? Thanks.
Attachments
Some catchup work that is hopefully interesting...
There's a post up on a new product called the QA440. This is a relay box that provides 5 stereo pairs of relays for whatever routing needs you might have during testing. For example, using this box you could test a 5.1 amp, with every channel under load. And then, the relay box would cycle through and measure each channel in sequence. The software interface is REST, meaning you can configure the relays with common internet protocols (eg HTTP PUT). And it will be integrated into Tractor so that setting the routing is easily specified as part of automated testing.
Preview: QA440 Multimode Relay
Next is a post on using the QA451 with external loads. A ~700W Behringer class D amp is used, as well as some nice load resistors I'd not know about until a user pointed me to them.
Using the QA451 with External Loads
Finally, if you haven't yet seen a powered speaker cabinet where the only input on the back is an ethernet receptacle, get ready. At the NAMM show earlier this year Dante exploded versus the year prior. The refinement hasn't stopped. And it's rapidly making its way into home audio. This protocol is extremely important, and Audinate has a huge silicon portfolio to speed the arrival into other products. But for pro audio, it's here.
A post looking at how to test a Dante receiver with the QA401 is located linked below.
Audio over IP
I'd not say the Dante receiver is in the hifi realm, but its pretty good. The larger point of the post is how to test a Dante receiver.
Are there any ASIO drivers in existence that work for the QA400?
I have one (and really like it) but basically the Win7 laptop it currently runs on needs to be repurposed. Many hours of compatibility mode and virtual machine attempts later have all ended in failure. Would really like to get it working with one of the other measurement software tools if possible rather than have to shell out for new hardware...
Any and all suggestions welcome.
QA400 won't run on anything later than Win7.
I also have one and use a refurbished Lenovo X201 i5 laptop running Win7 for the purpose, paid £65 for the laptop...
I also have one and use a refurbished Lenovo X201 i5 laptop running Win7 for the purpose, paid £65 for the laptop...
QA400 help
Hello,
I use my 400 infrequently enough that I forget a lot of the startup info and have to muddle around muttering (MAM)
I think I remember a few postings with "quick start" advice, but with the number of 400/1 postings now over 2700 searching becomes a formidable task.
Anyone remember any of these postings? Also could they be put in some kind of a "sticky" category.
Thank You
Charles
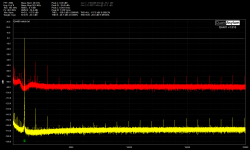
I got a QA480 from the limited run. Its proving its value. I have several measurements using it and the QA401.
The first plot is the QA480+QA401 (yellow trace) compared to the Shibasoku 725D using the Shibasoku AM70A oscillator as a source. Its not the lowest distortion source I have but convenient for this comparison. Except for the differences in harmonic level on H2 H6 the plots track quite well. The close in differences are typical when the residual of the source and the residual of the analyzer are similar in magnitude- they add and subtract. The Red trace is the residual at the output of the 725D. The actual levels are very similar but different references. The QA401 does not provide for separate reference levels for each channel.
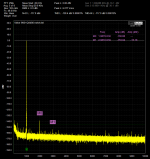
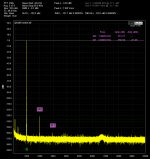
The second plot is my battery powered Victor through the QA480 notch into the QA401. This is an early Victor. I believe the current ones are better. And finally the QA480 oscillator into the QA401.
Next task- use the QA401 with my passive B&K notch now that the process is together.
The first plot is the QA480+QA401 (yellow trace) compared to the Shibasoku 725D using the Shibasoku AM70A oscillator as a source. Its not the lowest distortion source I have but convenient for this comparison. Except for the differences in harmonic level on H2 H6 the plots track quite well. The close in differences are typical when the residual of the source and the residual of the analyzer are similar in magnitude- they add and subtract. The Red trace is the residual at the output of the 725D. The actual levels are very similar but different references. The QA401 does not provide for separate reference levels for each channel.
The second plot is my battery powered Victor through the QA480 notch into the QA401. This is an early Victor. I believe the current ones are better. And finally the QA480 oscillator into the QA401.
Next task- use the QA401 with my passive B&K notch now that the process is together.
Attachments
- Home
- Design & Build
- Equipment & Tools
- QuantAsylum QA400 and QA401