Alright, lets assume the surround is completely out of phase, 180 deg. Lets simplify so that the out of phase radiating area equals radiating area on the center thats in phase, 0 deg. We have now effectively two transducers, completely out of phase with equal output magnitude because radiating areas are equal, lets also assume the displacement is equal for both, and they would cancel each other completely at some frequencies to some directions.
As long as there is no phase difference or magnitude difference between the two to any observation point they would perfectly cancel. If either is attenuated or phase difference appears then the cancellation is less and we'd get some output.
If its a 15cm diameter driver this is the size of the ring radiator the surround makes, and the center is somewhat smaller, lets guestimate it is 10cm in diameter. Both of their acoustic centers co-locate. Different size means they would start to beam at different frequency, some output difference would happen and less cancellation would emerge to off-axis. Now we just estimate the lowest frequency either of them starts to beam to get lowest frequency where their radiation differs to any direction.
15cm driver starts to narrow response when the 15cm is more than roughly 1/4 wavelength. When its half wavelength there is quite much cancellation to the sides already so lets multiply 15cm with 4 to get to 60cm, to about 500Hz. Below this frequency there is no difference in sound to any direction at any circumstance, even in this absolute worst ideal situation. We got this number already few posts back 🙂 On normalized polar chart there would be no difference to any direction, no bundling up on the off-axis responses below 500Hz and even then they would gradually start to differ, very little in this thought experiment. There would be no off-axis hump at 300Hz like in post #130.
Ok, what if the surround breaks up so that half of the cone, like half moon, is in opposite polarity than the other half? We'd get no sound on-axis because we'd be equidistant and they would again cancel out up to some frequency related to the size of the radiators. To extreme off-axis at 90 degrees the other half would be furthest away than the other and we would get constructive or destructive interference based on the distance. When they are half wavelength apart there would be first constructive interference peak, this is lowest frequency they are in phase to any direction. Below this frequency its all destructive interference to any direction. Acoustic centers would be about 10cm apart, absolute worst case 15cm because thats the maximum size of the transducer, or so so this would be 30cm at most, about 1kHz.
As we see there is no condition on the driver that would explain any output difference at 300Hz with 15cm, or smaller driver, because it is a point source at these wavelenghts. First small deviation we would get with a 15cm driver would be about 60cm wavelength, when furthest points of the driver start to interfere with each other. This is the 1/4wl rule of "point source". The driver is in phase with itself to any direction on longer than 4x diameter wavelengths.
The surround can be decoupled, the whole cone could be a checker board outputting any phase, but the response would be exactly same to any direction which would show no undulations varying with direction in a normalized polar graph. In other words its a point source up to some frequency.
From this we can reason that the feature around 300Hz in the hificompass normalized polar graphs with these ~15cm diameter drivers is from something else than from the drivers. There is already analyze where it is, its the IEC baffle they use. Any differences in the feature between the drivers is due to the baffle, or from any other variable in the measurement procedure than the drivers themselves. We see there is some so we can conclude there is differences also higher up in frequency, we can logically reason the measurement occasion has some variance to it, but its quite close, within 1db or so.
For sure, closer to 1kHz and beyond we'd get more and more differences between the drivers themselves as wavelength approaches size of the drivers.
Last edited:

Differences in graphs in post #130 below say 500Hz, or 800Hz, seem to be within about 1db, that is quite good accuracy for non laboratory measurements and I suspect its about the same measurement setup for all of them. The purifi driver measurement is a bit outlier, perhaps there is different baffle in use or some other difference, or perhaps it is the driver already. Sd seems to be wee bit smaller at least, and its high tech, but it can't bent physics. My estimations are rough so the error can be there or in the measurement setup.
If the responses are windowed, semi-anechoic, difference in the windowing function / time would perhaps show up. I suspect this is the case in responses in post #136, there would be some undultations due to box back shape below 1kHz, they are just mostly windowed out with short window times in home measurements.
Bundling up, or the edge diffraction, that is visible around 300Hz in the post #130 is found in the post #136 but there its at 1500Hz-2000Hz region. 2000Hz would be about 17cm so the baffle is about 34cm.
Last edited:
Tmuikku – your thought experiment and theoretical analysis of ¼ wave behavior makes sense. All four drivers have nearly the same Sd. It seems that within the simplifying assumptions you have made, surround antiphase behavior is not a good explanation of the differing polar responses below 500 hz.
Perhaps the differences are not real but just measurement noise. It does not look noise to me, however. I would expect noise to be more random.
Perhaps the differences are the result of some kind of measurement error or inconsistent measurement process at Hificompass. But my measurements of two drivers are very similar to his measurements.
Perhaps there is some sort of bias that is inherent in the way we all do gated far field measurements. @tktran303 has a strange bunching of polar responses at 500 Hz that do not appear in the Klippel NFS measurements. I have found odd differences in gated far field measurements made in different rooms where the gate window was small enough that the room should make no difference. It is a bit of a mystery…
I still believe that the differences in driver surround may explain some of the polar response variations below 1k, but there may be (probably are) other contributing factors as well.
j.
Yes, something else than the driver. The thing is that the graphs we are comparing are normalized which shows response to any direction in relation to on-axis response. Basically normalized graph shows directivity.
Directivity is related to physical size and shape and wavelength. Physical size and shape covers the transducer size and the construct size it is attached to.
When the physical sizes of drivers we are looking at are very close to each other it means they ought to have exactly same normalized response up to some frequency until wavelength is short enough for any interference to happen. When the drivers are ~2kHz in size, their directivity ought to be roughly equal perhaps roughly up to 1kHz above which wavelength is short enough so that cone shape, breakup, surround etc, can show difference. If you see differences in normalized graphs much below this frequency, it has to be some else secondary sound source like the construct, some room reflection or something else.
If the responses were not normalized, then there would be more variation between the drivers, peaks and dips here and there even low in frequency, different high and low passes etc.
The construct, IEC baffle or a box, affects directivity and makes secondary sounds. Sound from the driver expands along the construct meets a corner and diffracts, a secondary sound source happens and we now see undulations in the normalized graph, two sound sources making interference, direct sound and diffracted sound. Two (or more) sound sources have different path length difference to various directions observation points so the directivity of the whole system is affected by the structure. The bigger the structure, the longer path length difference can happen between sound source(s) and the lower in frequency we see these undulations in the magnitude response on the normalized graph.
Then there is windowing, which affects what is included in the frequency response. At home one might need to use perhaps 3ms window to exclude secondary sound sources from the room boundaries, reflections. 3ms is roughly 1m of sound travel. Now, imagine you are measuring spinorama, rotating axis on the baffle. While measuring the direct sound arrives to mic and the mic records for the next 3ms and anything arriving into the mic within that window makes into frequency response. Lets figure out if we get effect of box back edge diffraction included: Measuring on-axis, If baffle was 20cm wide and box 40cm deep, sound would get to box back edge in 50cm, then head back towards the mic roughly another 50cm so it would come roughly 1m later than direct sound to the mic and would miss the window and completely absent in frequency response. Basically we don't see the box back edge diffraction with such short window on axis for such box.
Now, when one continues taking the spinorama, box is now rotated 90deg, whats the path length difference now? First 10cm from transducer center to box edge, direct sound continues toward mic while diffracted sound heads toward the back edge, 40cm later it diffracts at the back edge and secondary sound heads toward the mic. Coming roughly 40cm + some trigonometry cm later now partially fits within the 3ms window and now the frequency response shows some interference, constructive or destructive depending on wavelength and the path length difference. Measuring 180deg behind the box, sound diffracting around all sides of the box arrives roughly simulataneously to the mic, everything included, not much hint of any secondary sound sources.
I suggest everyone to play with vituixcad as there its possible to play with multiple sound sources interfering in real time, helps to gain intuition on the interference stuff. With ideal sound source there is no undulation in response until another sound source is introduced, interference. Its great fun 😀
Last edited:
I’ve wondered too if the time window is of any effect, but not with 10ms and reasonable shaping.
As requested, I will detail my attempts to find these three papers in the archives of the AES but a search under title +/- author +/- keywords failed on all counts.ChatGPT, or DingbatChat as I name it on my Home Screen; needs a little guidance-
me-
Which studies have suggested that distortion levels as low as 0.01% can be audible in music reproduction?
Dingbat-
“ There have been several studies that suggest that distortion levels as low as 0.01% can be audible in music reproduction. Here are a few examples:
"Audibility of a Single Percentage of Harmonic Distortion in Audio Amplifiers" by Floyd Toole and Stanley Lipshitz (published in the Journal of the Audio Engineering Society in 1981). This study found that even small amounts of distortion can be audible, and that distortion levels below 0.1% can still have a noticeable effect on the sound quality.
"Perception of Distortion in Amplifiers" by Richard Cabot and Charles Waddell (published in the Journal of the Audio Engineering Society in 1991). This study found that distortion levels as low as 0.01% can be audible in certain circumstances, and that some listeners are more sensitive to distortion than others.
"Subjective Assessment of Low-Level Distortion in Audio Systems" by Joshua Reiss and David Borwick (published in the Journal of the Audio Engineering Society in 2004). This study found that distortion levels as low as 0.01% can be audible in certain types of music and with certain types of listeners, and that the audibility of distortion can be influenced by factors such as listening level and musical content.
Overall, these studies suggest that distortion levels as low as 0.01% can be audible in music reproduction, and that even small amounts of distortion can have an impact on the perceived sound quality”
I then searched ALL issues of the JAES in the years cited - none of these articles were present.
Now its possible that the older two articles got 'lost' but the recent 2004 paper should be searchable, even as a convention preprint as digital archiving was well underway at the AES by then. So I emailed Professor Reiss who kindly replied very promptly to inform me that neither he nor David Borwick (now deceased) ever wrote any article of that title.
Conclusion: ChatGPT is full of it. Unless someone can actually produce those papers - and they are of interest to me. So please reply if anyone has a copy!
regards
Alan
Hello Jim,
I have seen this step around 500 Hz a thousand times, actually, in my case it was a little lower, around 400 Hz instead. I saw it on the sonogram and it made me sad, because I knew it would mess up my DI. These horns ...
 sono hor.png")
So the saddle, on the horizontal angles at least, was obviously around 400 Hz:
 line.png")
It leaves this pronounced and ugly step in DI, made more obvious here by only including horizontal angles:

However, turning to vertical, this is a totally different story. The positive vertical angles of a two-way cabinet, pointing upwards:
 line updward.png")
... and negative angles, pointing downwards:
 line downward.png")
and as sonogram:
 sono ver.png")
DI for vertical angles has a very different pattern. Smooth around the discussed frequency, with a much sharper narrow-wide peaking higher up:

All angles:

This is obviously simulation data, from the well known ath software. At post 10,005 I had even once complained about the phenomenon in my data. Sitting at the wrong computer, I cannot give you the correct dimensions of the enclosure. It must be something very close to 32 x 60 x 27 cm (w:h:d). The simulated driver that generates these data has the SD of a PHL 3411, a ten inch driver. Not the same, but similar box: https://www.diyaudio.com/community/attachments/box-png.1046323/
My point being: This data does not include edge surround phase, and yet a step is visible, especially for horizontal dimensions. I assume this is related to diffraction and / or back wave cancellation.
I have seen this step around 500 Hz a thousand times, actually, in my case it was a little lower, around 400 Hz instead. I saw it on the sonogram and it made me sad, because I knew it would mess up my DI. These horns ...
So the saddle, on the horizontal angles at least, was obviously around 400 Hz:
It leaves this pronounced and ugly step in DI, made more obvious here by only including horizontal angles:
However, turning to vertical, this is a totally different story. The positive vertical angles of a two-way cabinet, pointing upwards:
... and negative angles, pointing downwards:
and as sonogram:
DI for vertical angles has a very different pattern. Smooth around the discussed frequency, with a much sharper narrow-wide peaking higher up:
All angles:
This is obviously simulation data, from the well known ath software. At post 10,005 I had even once complained about the phenomenon in my data. Sitting at the wrong computer, I cannot give you the correct dimensions of the enclosure. It must be something very close to 32 x 60 x 27 cm (w:h:d). The simulated driver that generates these data has the SD of a PHL 3411, a ten inch driver. Not the same, but similar box: https://www.diyaudio.com/community/attachments/box-png.1046323/
My point being: This data does not include edge surround phase, and yet a step is visible, especially for horizontal dimensions. I assume this is related to diffraction and / or back wave cancellation.
As requested, I will detail my attempts to find these three papers in the archives of the AES but a search under title +/- author +/- keywords failed on all counts.
I then searched ALL issues of the JAES in the years cited - none of these articles were present.
Now its possible that the older two articles got 'lost' but the recent 2004 paper should be searchable, even as a convention preprint as digital archiving was well underway at the AES by then. So I emailed Professor Reiss who kindly replied very promptly to inform me that neither he nor David Borwick (now deceased) ever wrote any article of that title.
Conclusion: ChatGPT is full of it. Unless someone can actually produce those papers - and they are of interest to me. So please reply if anyone has a copy!
regards
Alan
Thanks for letting me know, and correcting this.
so ChatGPT is officially the new Facebook. A whole lot of hot air... which will certainly attract a big following. And monetize later.
In future, I will remember to "ask it anything and get an answer at the level of a high schooler, albeit with the confidence of our best politicians"
A visual guide to the features seen in the polarmap. Width and depth and rear diffraction are not modelled in spliced nearfield measurements using basic diffraction simulation. So a simulation like this has the potential to be more accurate than a real measurement in this regard.My point being: This data does not include edge surround phase, and yet a step is visible, especially for horizontal dimensions. I assume this is related to diffraction and / or back wave cancellation.
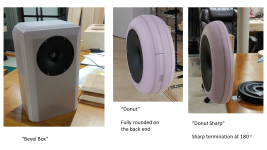
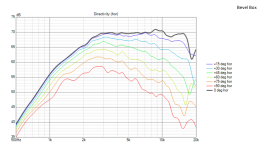
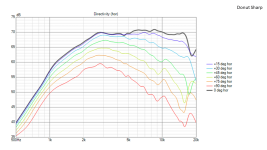
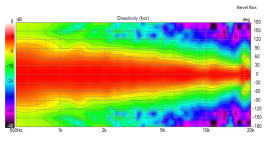
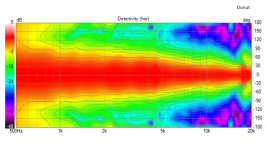
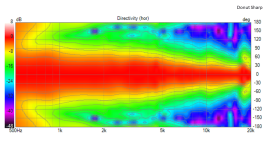
In post# 111, I showed a modified tweeter housing, the Donut with a sharp termination at 180 degrees. I decided to remeasure all my tweeter housing options under the same conditions to get maximum consistency. I made 0 – 180 degree horizontal measurements, in 15 degree increments. I completed this latest round of measurements a few weeks ago, but vacation and other things got in the way of posting.
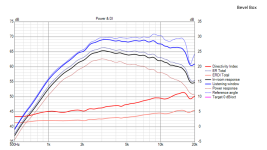
I am showing the bevel box data just for documentation purposes. At this point I am committed to a free standing waveguide, so after this point I will no longer be doing any development work on the bevel box concept.
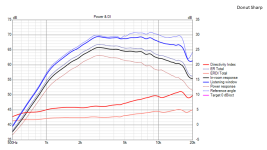
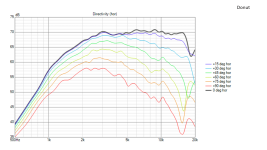
When I loaded the data into VituixCad, I applied a first order high pass filter at 7.5 kHz to all the data. I find this flattens the waveguide response and makes it easier to visually evaluate. All the data you see below is filtered this way.
The differences between the three options are fairly subtle. Nothing stands out as a defect in any of the three. I believe the “Donut Sharp” has a better response than the “Donut”, and that is how I am proceeding.
j.
I am showing the bevel box data just for documentation purposes. At this point I am committed to a free standing waveguide, so after this point I will no longer be doing any development work on the bevel box concept.
When I loaded the data into VituixCad, I applied a first order high pass filter at 7.5 kHz to all the data. I find this flattens the waveguide response and makes it easier to visually evaluate. All the data you see below is filtered this way.
The differences between the three options are fairly subtle. Nothing stands out as a defect in any of the three. I believe the “Donut Sharp” has a better response than the “Donut”, and that is how I am proceeding.
j.
Attachments
-
 Slide1.PNG265.6 KB · Views: 222
 -
 Slide2.PNG62.2 KB · Views: 223
 -
 Slide3.PNG62.3 KB · Views: 202
 -
 Slide4.PNG62.4 KB · Views: 190
 -
 Slide6.PNG62.8 KB · Views: 186
 -
 Slide5.PNG62.5 KB · Views: 184
 -
 Slide7.PNG62.7 KB · Views: 182
 -
 Slide8.PNG183.4 KB · Views: 174
 -
 Slide9.PNG178.2 KB · Views: 177
 -
 Slide10.PNG182.7 KB · Views: 213
About HifiCompass measurements showing directivity around 4-500Hz for midwoofers,
I PM'd Yevgeniy and he was kind to answer. He uses stardard finite baffle without back chamber, so ripple is cancellation of the backwave at the edge. The difference between various drivers comes from random difference in conditions and is purely an artefact and to be discarded.
Slava Ukraini!

I PM'd Yevgeniy and he was kind to answer. He uses stardard finite baffle without back chamber, so ripple is cancellation of the backwave at the edge. The difference between various drivers comes from random difference in conditions and is purely an artefact and to be discarded.
Slava Ukraini!
Thanks for clearing that up for us. So according to Yevgeniy, the test expert who conducted the tests, the differences we see in @HiFiCompass polar measurements below 500 Hz are a result of test limitations.
The impetus for this huge sidetrack discussion was originally my measured differences in polar response in the 600 - 1k region between two very similar midwoofers in very similarly size/shape cabinets.
Post# 112 https://www.diyaudio.com/community/threads/purifi-waveguide-project.394174/page-6#post-7295782
At this point I still have no definitive answer: The polar responses I measured from 600 - 1k were different, and the VituixCad-calculated DI curves were different. Are the differences in DI a result of inherent driver differences, or a result of small differences in cabinet shape/size?
It is not an important question at the moment. In the first place, the design for this project is fixed except for some small details. In the second place, I do not believe that +/- 1 dB variations in DI spread over half an octave are significant or audible. But I am open minded on this, because a lot of people spend a lot of effort managing the directivity below 1k, and +/- 1 dB seems important to them.
Thanks to everyone for participating in this discussion.
j.
The impetus for this huge sidetrack discussion was originally my measured differences in polar response in the 600 - 1k region between two very similar midwoofers in very similarly size/shape cabinets.
Post# 112 https://www.diyaudio.com/community/threads/purifi-waveguide-project.394174/page-6#post-7295782
At this point I still have no definitive answer: The polar responses I measured from 600 - 1k were different, and the VituixCad-calculated DI curves were different. Are the differences in DI a result of inherent driver differences, or a result of small differences in cabinet shape/size?
It is not an important question at the moment. In the first place, the design for this project is fixed except for some small details. In the second place, I do not believe that +/- 1 dB variations in DI spread over half an octave are significant or audible. But I am open minded on this, because a lot of people spend a lot of effort managing the directivity below 1k, and +/- 1 dB seems important to them.
Thanks to everyone for participating in this discussion.
Swift Victory to Ukraine !Slava Ukraini!
j.
Let me quote myself a little:About HifiCompass measurements showing directivity around 4-500Hz for midwoofers,
I PM'd Yevgeniy and he was kind to answer. He uses stardard finite baffle without back chamber, so ripple is cancellation of the backwave at the edge. The difference between various drivers comes from random difference in conditions and is purely an artefact and to be discarded.
Slava Ukraini!
View attachment 1161532
"Hi Juha,
that frequency responses wiggles up to about 600 Hz, of course, has nothing to do with a speaker operating in piston mode. They are exclusively related to:
1. Parasitic constructive/destructive interference between the direct wave from the speaker and waves reflected from the edges of the test baffle.
2. Parasitic constructive/destructive interference between the direct wave from the speaker and the waves from back side of the speaker cone propagated around the edges of the test baffle.
3. The peak/dip magnitude and position on the frequency axis depend on wave path differences in each position of the microphone (at different measurement angles)
This is an unavoidable measurement artifact when measured on a finite size test baffle. Don't take them into account.
In my more late measurements (all the Purifi PTT... and some others) I tried to isolate back wave a little better, so this may some positive effect on that unevenness.
In any case I wouldn't give too serious attention to that region"
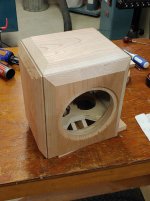
The midrange cabinets are constructed. I have some cosmetic trim to add at each corner, then I am going to profile them with a block plane and sandpaper to remove all sharp edges.
I used a tenoning jig on the table saw to cut the bevels. I bonded the cherry panels to the plywood box with construction adhesive. I was concerned I would have trouble maintaining the position of the panels since I have no mechanical interface or index between the panel and the inner box. I did a few mock-ups, and found it would be no problem, and it wasn't... I just pressed the panels down into place, applied a 50 lb weight, and let it cure. Total wall thickness is 1.5 inch.
The next step will be constructing the tweeter housings (free standing waveguides). My foam "donut" was 255 mm diameter. After applying the 37 mm radius roundover, there was about a 6 mm flat spot between the edge of Satori waveguide and the start of the foam donut radius. I will reduce my overall diameter to minimize that flat spot.
j.
Attachments
The waveguide housing will be constructed of laminated layers of cherry. Someday I would like to fabricate an entire waveguide from laminated wood, but I think I need a CNC router for that. It's good to have future projects lined up !

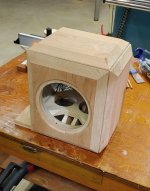
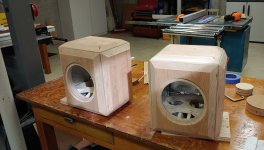
The midrange cabinet has been profiled, and trial fit with the PTT6.5M.


j.
j.
An interesting similar project.. just thought of sharing this one 🙂
https://www-donhighend-de.translate...aVRrWys&_x_tr_sl=auto&_x_tr_tl=en&_x_tr_hl=en
https://www-donhighend-de.translate...aVRrWys&_x_tr_sl=auto&_x_tr_tl=en&_x_tr_hl=en
Looking at the pictures of your nicely produced cabinets, i wonder of the sides of the woofer opening are beveled enough.
Given the order of construction and the geometry, I was not able to router a full depth chamfer on the inside of the woofer hole. The inner baffle (plywood) is partially chamfered, and then there is a step between the inner and outer (cherry) baffle. It should be enough. This is a scale representation.

- Home
- Loudspeakers
- Multi-Way
- Purifi + Waveguide Project