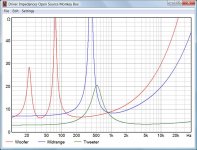
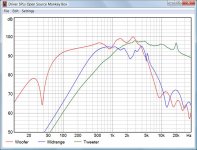
That looks good. Your SPL levels are a bit high (+1.5 dB ?), but that isn't a problem. The only critical thing is the woofer peak at 500-600 Hz which is clearly higher than in my simulation. An artifact from manufacturer datasheet?
Attached are my results for comparison. 🙂
Attached are my results for comparison. 🙂
Attachments
Hi Dissi,
Thanks, interesting to compare your simulation results.
How did you do these simulations? For example the bafflestep simulation of the woofer and midrange?
We used TSP and SPL measurements of Matthias to make SPL simulations of the drivers in the cabinet. For an overall frequency SPL fitting for woofer and midrange we had to add +1.5 dB to the meaurements. Our bafflestep simulation of the woofer done by Leap can be a little too optimistic, maybe +1 dB too high. But we used it, because the measurement has a poor frequency resolution with only a 3 ms gate time of Matthias' measurement.
From my side I have some plans to do some investigation on bafflesteo simulation using outdoor measurements.
At this time I have a 11 inch woofer mounted in a cabinet with about the same size as the Monkey box. So, it is interesting to check it also with that speaker using longer FFT gate time.
In your midrange SPL I don't see any bafflestep boost between 500 and 1000 Hz. How did you realize that SPL in the simulation?
Last edited:
...using longer FFT gate time.
I am working on it. Started building the tower yesterday. Family, friends and neighbours have that funny expression in their faces...
I am working on it. Started building the tower yesterday. Family, friends and neighbours have that funny expression in their faces...
🙂 Success !!! I am looking forward!
How did you realize that SPL in the simulation?
Hi Paul,
I model the drivers in the cabinet they were measured in and adjust the model until simulated impedance and SPL response do match with the measurements. Baffle step is always included.
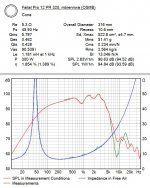
Attached are the TSP I use. Note that Sd of the woofer and Mms of the midrange are different from the datasheet. I don't take datasheets from Faital and Volt as reality since their measurements usually differ from third party measurements and measurement conditions actually are unknown.
Attachments

Dissi,
Now I understand, you also use the measurements done by Matthias.
What I have seen during the modelling of the drivers with his measurements... making a low frequency driver model using the TSP calculated out of the measured impedance by Matthias, the low frequency SPL of the model is 1.5 dB higher. Also the high frequency response of the measurement was 1.5 dB lower than the SPL of a model I made at first with datasheet SPL data.
So, by increasing the measurement SPL +1.5 dB, all fits perfect overall at low and high frequencies. Also for the midrange, the high frequency level of the measurement was too low.
In that way I have increased all driver SPL measurements of Matthias with +1.5 dB. And that is the difference you also see now between your and my simulations.
Probably the bafflestep response of the woofer in the measurement is too low. Matthias is measuring outdoors now and maybe we have a better view on that. Also for the midrange response around 500 - 1000 Hz, there still are some little doubts.
As we have no anechoic room available for this project, we have to work with the tools we have 🙂.
I model the drivers in the cabinet they were measured in and adjust the model until simulated impedance and SPL response do match with the measurements.
I am impressed how those modeling tools work out to give surprisingly accurate curves! Cool!
Dissi, what software package did you use for this? What drive voltage did you assume for the SPL curves? Did you see a similar offset as with the Leap model relative to the measured SPL curves (1.5 dB)?
🙂 Success !!! I am looking forward!
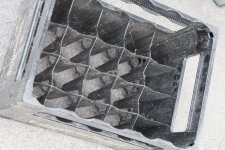
I spent the day with some gardening work (photo attached). It's not the best season for this stuff, my fingers were frozen. Once I had everything set up, the amp started blowing fuses. Once I had this fixed with my frozen fingers it was 15:00. It was 15:25 when I realised that I need to turn on the phantom power for the microphone. From then on, things went ok, I think. I still need to clean up and process the data. Expect to see anechoic response to below 100 Hz...
Attachments
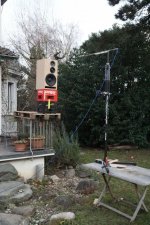
Impressive tower! 🙂 I expect you will have good measurements that way. Very curious about it.
I also have to do some measurements outdoors soon, not the ideal period of the year for that.
I also have to do some measurements outdoors soon, not the ideal period of the year for that.
Looking at the picture, I cannot help but wonder to what extent the crates function as a pseudo/enlarged baffle, thus polluting measurements.
Any views on that?
Any views on that?
Looking at the picture, I cannot help but wonder to what extent the crates function as a pseudo/enlarged baffle, thus polluting measurements.
Any views on that?
Maybe the modellers around here could estimate the effects by assuming an enlarged baffle. I am not worried too much because the lower edge is the one furthest away from the mid/tweeter, so it gets the least exposure for baffle diffraction.
Impressive tower! 🙂 I expect you will have good measurements that way. Very curious about it.
Here's the data. The plots with the acoustic data show the on-axis (black), 30° horizontal "inside" (red) and 30° horizontal "outside" (blue). The data files are in the ZIP.
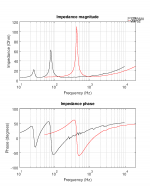
I also did some impedance curves to check if the TSP are any different in the cold outdoor air. It looks like the bass reflex tuning frequency is a bit higher, and also the VM752 resonance peak is about 10% higher than in my indoor measurements. I guess this is due to lower Cms / stiffer suspension parts. Maybe that's something to keep in mind for the models.
I had some issues with the tweeter measurements. First I had some churchbells interfering with the acoustic tests (you'll see some "very long ringing" in the time-domain data). When I wanted to do the final impedance sweep I blew that amplifier fuse again (I believe the DC block at the amp input is bust). I decided to skip the impedance sweep and clean up the garden before it was dark.
I guess these data should give conclusive information on the baffle-step and splicing questions.
Attachments
I had a first look at the measurements.
For midrange and tweeter we can be sure that the SPL of my last frd's is very close to the outdoor measurements.
I had expected more of this outdoor measurement to interprete the woofer bafflestep. That the resolution is so bad below 1 kHz. And the dip at 400 Hz, looks like a reflection somewhere. Difficult to say if the bafflestep boost of the measurement is lower or equal than the Leap simulation.
If I compare my outdoor measurements with the Clio, there is also a poor frequency resolution but the mean value is correct down to about 400 Hz, with the Clio unsmoothed setting. I look further to it...
For midrange and tweeter we can be sure that the SPL of my last frd's is very close to the outdoor measurements.
That's good to know! At least, progress!
I had expected more of this outdoor measurement to interprete the woofer bafflestep. That the resolution is so bad below 1 kHz. And the dip at 400 Hz, looks like a reflection somewhere.
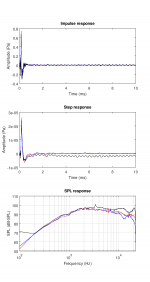
The frequency resolution is given by the inverse of the length of the anechoic part of the impulse response (12.3 ms or 81 Hz for the woofer).
I am pretty sure the "400 Hz" feature is something that happens in the box itself. It does not change in the off-axis measurements, and I also get the dip at 410 Hz in my AJ Horn model. The dip at 400 Hz corresponds to a wave length of about 0.9 m, or 2.5 ms. Looking at the step response you see a dip at about 2.5 ms after the main pulse at the start. This dip looks a bit like the pulse emitted from the rear side of the cone into the box. The box height + port-length add up to about 0.9 m / 2.5 ms... maybe an internal resonance feature, or port resonance? I guess we might look into this a bit closer in the future. I'll have to add some damping material at some point, and maybe we can try an internal Helmholtz absorber to improve this. I don't think the 400 Hz feature is something that should be "treated" by the x-over.
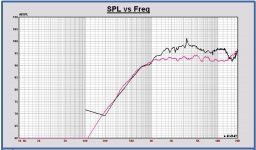
I attached an SPL plot where I used a much longer gate time and 1/4 octave smoothing in red (black is anechoic). With a little bit of imagination you can see the SPL plateau at about 92 dB from 100 to 200 Hz (full space) and then the plateau at about 97 dB from 700 to 2000 Hz (half space). I agree the transition in between is a bit funky, and it may be better to rely on some modelled / assumed SPL curve shape in this range for the x-over development.
Attachments

Some comparing plots.
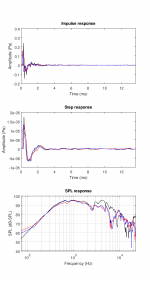
No 1.5 dB correction applied yet in outdoor measurement.
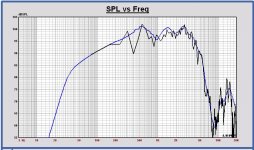
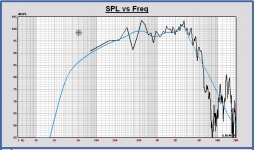
Woofer outdoor (black) versus Leap sliced curve (blue)
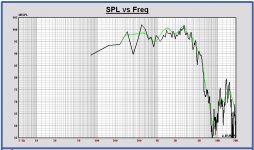
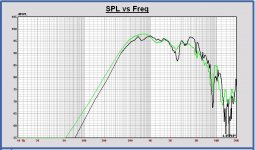
Woofer outdoor (black) versus indoor curve (green)
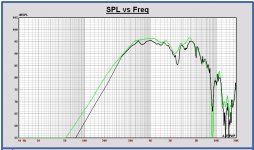
Midrange outdoor (black) versus Leap sliced curve (green)
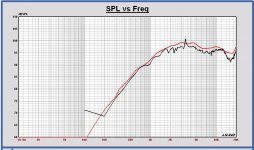
Tweeter outdoor (black) versus Leap sliced curve (red)
You have to be careful placing horizontal planes close to a speaker.
A friend of me measured a speaker standing on two little tables on each other of each 40 cm high. The plane between the two tables caused a seriuos dip at 400 Hz. In the indoor measuremet this dip isn't there or is it smoothed maybe?
What about the bear containers, is there a plane between the two?
No 1.5 dB correction applied yet in outdoor measurement.
Woofer outdoor (black) versus Leap sliced curve (blue)
Woofer outdoor (black) versus indoor curve (green)
Midrange outdoor (black) versus Leap sliced curve (green)
Tweeter outdoor (black) versus Leap sliced curve (red)
You have to be careful placing horizontal planes close to a speaker.
A friend of me measured a speaker standing on two little tables on each other of each 40 cm high. The plane between the two tables caused a seriuos dip at 400 Hz. In the indoor measuremet this dip isn't there or is it smoothed maybe?
What about the bear containers, is there a plane between the two?
Attachments
Last edited:
You have to be careful placing horizontal planes close to a speaker ... What about the bear containers, is there a plane between the two?
Well, not a proper plane. But I looking inside the crates I realised the cobwebs might not be efficient enough to deal with all those cavities. Lots of potential resonator "tubes" in there, two stacked on top of each other... Hmmmmmmm.
Attachments
Difficult to say what the crates do, the best is a pole under the cabinet.
Shall I update the frd's with the outdoor measurements?
I will have a look to the woofer bafflestep response also. I have seen there is still some ripple in my frd SPL response out of the datasheet sampling, which increases the bafflestep boost a little. That is not good, an error from my side. I have to data splice only the Leap simulation with the measurement.
Is there is a need for a little smoothing of the outdoor SPL curves before or shall I use them unsmoothed?
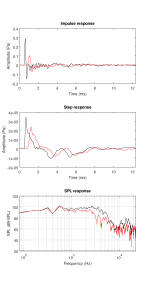
Here are the curves for a new splicing.
The outdoor curves + 1.5dB in black. The Leap sims in color.
I reviewed the woofer bafflestep response in Leap. It is closer to the measurement now. I have done a bafflestep calculation closer to the speaker at 50 cm and applied that on the infinite baffle response.
Woofer can be spliced around 700 Hz. Midrange around 350 Hz and tweeter at 200 Hz.
Edit: Maybe it is better to offset the measured curves only by + 0.5 to + 1 dB now and not +1.5 dB. For the best fit on all curves.
I will have a close look on that.
Attachments

Last edited:
Here are the curves for a new splicing
That looks really good!
What is your concept idea for the x-over? Still following the lines of post 119?
Here the curves with outdoor measurements only + 0.5 dB offset.
Much better !!
Much better !!
Attachments


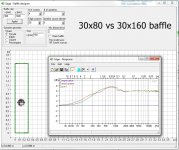
This Edge simulations shows 1dB difference between baffles. So, the plastic crates' effect will most likely get masked below other uncertainties and tolerances.
When making up a stand for measurement, try to find round objects like a trash can or place boxes with the edge pointing to mic!
When making up a stand for measurement, try to find round objects like a trash can or place boxes with the edge pointing to mic!
Attachments
Last edited:
- Home
- Loudspeakers
- Multi-Way
- Open Source Monkey Box