Interesting to watch this process, but a 31 component crossover? Should be 12 or less. If not, you have selected the wrong drivers! Know this is a work in progress and there will be some whittling down component wise. But still, need to work the natural driver roll offs and such. Otherwise the cost to build this thing will be just plain prohibitive for most mortals.
Why not using air core coils in the woofer filter with about 1.5 Ohm extra serial resistance and the air core coils are much better. But the SPL in passband will be 1 dB lower. Minimum impedance will become 6 Ohm.
Yes, that would work. However, that would mean to give up the 92 dB goal by burning energy in a resistor just to reduce the impedance dip. Would it be better to make a compromise to the "8 Ohm" impedance goal by saying that the dip is at 31 Hz, which is really at the limit of the Monkey Coffin pass band. This would allow us to just leave the bass filter and 92 dB sensitivity where it is.
What do you guys think?
...a 31 component crossover? Should be 12 or less. If not, you have selected the wrong drivers! ...need to work the natural driver roll offs and such. Otherwise the cost to build this thing will be just plain prohibitive for most mortals.
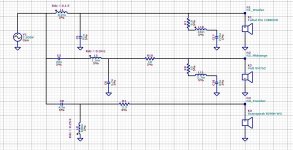
Yes, there may be 31 parts in the schematic. However, "only" 16 of these parts are really dedicated to the filters. The remaining parts are for impedance compensation of the drivers, which is required for the filters to work properly.
I am not (yet) worried about the cost of the x-over. The drivers themselves are also expensive, and I think saving money by not using the best x-over concept would be awkward. Also, we certainly did work out the "natural driver roll offs" in depth (just take a look at the past few pages of this thread).
Yet, your point for a "simpler" x-over with less parts is certainly well taken. The first post of this thread says this:
The speaker should be straight forward to make for DIY novices (we don't want to scare them, we want them to run to the hardware shop and build stuff on their kitchen table). There is no point in designing for expert builders, because they will design their own speakers anyway.
Personally, I am not scared of building a complex x-over. However, others might be. It would therefore be nice to have a simpler x-over for such builders.
We don't have to agree on one x-over for the Monkey Coffin. We can have two (or more), targeting different goals. I'd therefore suggest to follow up on the more complex filter, optimising the acoustics of the Monkey Coffin. For cases where this filter is too complicated/complex/difficult/whatever, we can always design a simpler x-over (compromising the performance somewhat).
In my opinion, Paul has already laid out a good starting point for the "complex" filter version. I'd like to suggest to follow up on this first and learn a few things along the way. The "simple" filter should be done afterwards, when we know what to watch out for. I believe this is a more efficient approach than trying to design two filters at the same time.
Last edited:
... but a 31 component crossover? Should be 12 or less...
John, it is a choice that you have to make. With less components it has to be lower order and not so well on a target.
In attach a LR2 at 500 and 2500 Hz. In fact it has 9 components, but as you have to compensate for the impedance peak of both the basreflex and midrange impedance in this speaker concept, you need 15 components.
No problem to design also a low budget filter if that is wanted.
Edit: crossing post with the one of Matthias. I have the same thought about the xo design...
Attachments
Last edited:
Using iron core coil types for the woofer, isn't it worse for THD at high power?
I don't have experience with it, just a thought...
I don't have experience with it, just a thought...
Using iron core coil types for the woofer, isn't it worse for THD at high power?
I don't have experience with it, just a thought...
Yes, high power means big and high-quality cores to keep DC resistance low and avoid saturation of the core. High power is not on the top of the Monkey Coffin priority list, but we should not ignore core saturation issues.
Low DC resistance may be a concern if we want to squeeze out every fraction of a decibel. This would mean to accept the impedance dip at 31 Hz, which goes a bit lower than the 6.4 Ohm limit of the "8 Ohm" rating. I would be okay to accept this compromise, since 31 Hz really is at the limit of how deep the Monkey Coffin will go anyway. Objections, suggestions?
Last edited:
If there are not objections to continue even with the less-than-8-Ohm dip at 31 Hz, I'd suggest to continue looking into Pauls "complex" filter idea. The on-axis response looks pretty much perfect already. Paul, can Leap do an off-axis analysis? It would be interesting to see if the dispersion of the drivers works out ok at the x-over points.
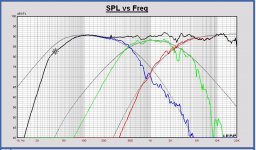
I already started with it 🙂. The results in attach. I just post now the plots, later on we can discuss about it. Woofer off axis not done yet.can Leap do an off-axis analysis? It would be interesting to see if the dispersion of the drivers works out ok at the x-over points...
All analysis based on the measurements of 21-12-2018 done by Matthias indoor.
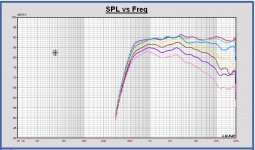
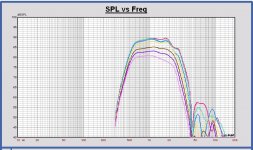
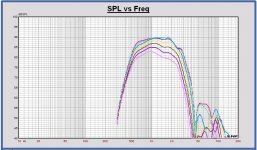
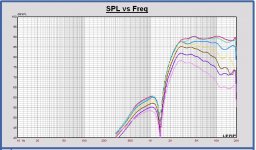
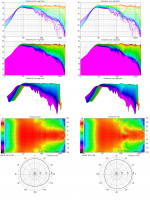
In the plots the SPL 0 15 30 45 60 75 90 degrees horizontal EL3 filtered inside and outside the cabinet, for tweeter and midrange.
Same for the sum of the filtered midrange and tweeter.
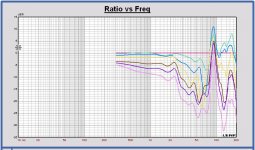
Also the directivity index in the single horizontal half plane using inside and outside off axis repsonses for the tweeter, the midrange and the sum.
- SPL tweeter inside filtered
- SPL tweeter outside filtered
- SPL midrange inside filtered
- SPL midrage outside filtered
- SPL sum inside filtered
- SPL sum outside filtered
- DI sum (black), midrange (green) and tweeter (red)
Attachments
-
 20181231 MonkeyB DI Volt-Scan-sum with EL3.JPG135.9 KB · Views: 124
 -
 20181231 MonkeyB sum Volt-Scan SPL outside EL3 filtered.JPG138.1 KB · Views: 128
 -
 20181231 MonkeyB sum Volt-Scan SPL inside EL3 filtered.JPG141.7 KB · Views: 115
 -
 20181231 MonkeyB Volt VM752 SPL outside EL3 filtered.JPG147.6 KB · Views: 108
 -
 20181231 MonkeyB Volt VM752 SPL inside EL3 filtered.JPG146.9 KB · Views: 315
 -
 20181231 MonkeyB Scan2904 SPL outside EL3 filtered.JPG146.5 KB · Views: 317
 -
 20181231 MonkeyB Scan2904 SPL inside EL3 filtered.JPG146.7 KB · Views: 323
Last edited:
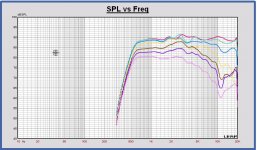
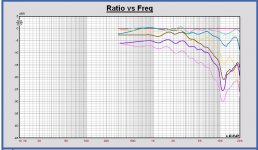
Some interesting plots, the unfiltered off axis SPL of tweeter and midrange, inside and outside, normalized to the their on-axis response.
What initially concerns me is the DI peak of the tweeter around 4 kHz.
What initially concerns me is the DI peak of the tweeter around 4 kHz.
Attachments
-
 20181231 MonkeyB VoltVM752 SPL outside unfiltered normalzed to 0deg.JPG146.5 KB · Views: 116
 -
 20181231 MonkeyB VoltVM752 SPL inside unfiltered normalzed to 0deg.JPG144 KB · Views: 123
 -
 20181231 MonkeyB Scan2904 SPL outside unfiltered normalzed to 0deg.JPG140.8 KB · Views: 103
 -
 20181231 MonkeyB Scan2904 SPL inside unfiltered normalzed to 0deg.JPG132.4 KB · Views: 117
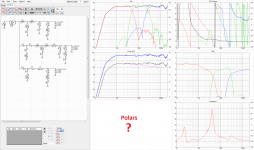
First one below variances of hor/ver polar examples can be plotted in free VituixCAD if feeded with enough data, if interested any those visuals for monkey box i can try it out if helped with off axis curves and X/Y position of drivers relative to microphone. Second one below is monkey box using post 511 response files and post 479 impedance files plus post 518 XO network.
Attachments
Hi Byrtt, thanks for your feedback.
If I understand correct, for the vertical off axis SPL in your simulation the position of the drivers is not yet taken into account. That is important of course. A mechanical drawing of the cabinet baffle is on the Matthias' link The Open Source Monkey Coffin repository | audioroot.
I still have to do some optimization of the xo. Not looked yet in detail to the phase response and not to the overall power response. Some tuning will be done for an optimal behavior on these points. But no big changes to be expected.
How to interprete the polar diagram at the bottom of the directivity plots in your simulation?
I have not simulated yet myself the vertical off axis response. In your simulations it looks quite good at the xo frequency, but we have to do it with vertical spacing between the drivers.
Earlier simulations I did with the 3rd order elliptical filter shows a good vertical dispersion because of the small overlap between the midrange and the tweeter with this kind of filter.
Edit: it looks VituixCAD looks much more interesting to do off axis analysis than Leap.
Byrtt, can you do the simulation again inclusive the X,Y,Z coordinates of the drivers, like you are mentioning also. And microphone at 3m distance at tweeter - midrange on axis and at a height between tweeter and midrange.
Last edited:
Sorry if i probably i didnt explain good enough in first place but the polar plots seen there is example from another speaker and general thought was if you liked those then if i feeded VituixCAD with more data maybe those type of polars for monkey box could guide or help your decision process or at least be interesting alternative and thanks link to that mechanical drawing.
Byrtt, you also use the off axis measurements done by Matthias in your off axis simulation? I just ask to be sure, sorry that I don't know anything of VituixCAD now. 🙂
No off axis data was used because thought maybe they won't match the ones of yours from post 511.
Therefor the second of attachments showing monkey box curves is only using those three on axis responses from post 511 and polar plots into VituixCAD will not start build up before feeded with off axis responses.
In your supported link i see now the zip archive with off axis responses and a link to acoustic center data, so will try out fill in more data about off axis-responses/acoustic-center/X-Y position of drivers and get back either tonight or first thing tommorrow, in meantime have a best happy new year.
Last edited:
Byrtt, the off axis repsonses of the zip file cannot be used for your simulation, because there is some delay in the measurements. At first a minimum phase transform has to be applied on the measurements. We come back on it later. Also for you, a happy new year.
Happy New Year to everyone!
I am amazed (again) by how well the different simulatios seem to give very consistent results. It seems that software and operators seem to do the right things 🙂
Byrtt: it would be GREAT if you could implement a complete Monkey Coffin model! Paul does a great job with Leap, but it's always better to have a consistency check. In addition, it might be useful in the future to have a VituixCAD project that can be used by everyone (Leap is very good, but unfortunately outdated and not available for new users anymore).
As Paul already mentioned, I am trying to keep a collection of the more relevant data for the Monkey Coffin design here. Let me know if you're missing something! I will do my best to add the necessary data (either from what I already have, or do some new measurements).
The initial off-axis analysis in post 527 looks pretty decent to me -- although I am not (yet) very experienced about which features matter most in those dispersion plots. Paul: the tweeter DI peak at about 4 kHz is pretty small compared to other features in this diagram (post 528). Why are you concerned about it?
Paul, Byrtt, everyone: it would be great if we could establish a complete dispersion model for the whole Monkey Coffin system (including the woofer). I have big hopes for this! I can barely hold myself from ordering x-over parts to get the prototype x-over going 😉
Happy new Year : )
In it looks very powerfull and freeware agree it could be good thing get VituixCAD up running and of course will share project file if we can get it up full blown, so far we could see its in agreement using the three on axis files, i'm no long time or super user of VituixCAD but have enjoyed its many tools and power to simulate textbook digital stuff.
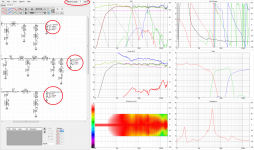
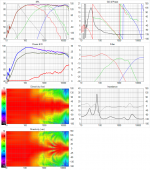
Have converted phase to MP for the 36 horizontal off axis files from zip folder and for on axis i use the three merged ones from post 511, then set X/Y/Z position numbers for each driver where Z number is acoustic center relative to design axis and WM752 is reference point for designaxis. This outputs below visuals for design axis marked with red and X/Y/Z is also marked with red so you could check them out for errors.
So far couldn't find any vertical axis measurements into that zip folder, but biggest problem that needs your help is stopband tails is interpolated for all those measurements that is missing data for example below 300Hz, to show what i mean see second visual for 12PR320 where we see those off axis responses is bad interpollated compared to the on axis merged one, graph at button is with normalization.
Will imagine if we can get correct stopband tails for all these horizontal off axis and also feed some vertical off axis measurements with good tails that polar plots plus power response and directivity starts make usefull graphs to take decitions for final design.
In it looks very powerfull and freeware agree it could be good thing get VituixCAD up running and of course will share project file if we can get it up full blown, so far we could see its in agreement using the three on axis files, i'm no long time or super user of VituixCAD but have enjoyed its many tools and power to simulate textbook digital stuff.
Have converted phase to MP for the 36 horizontal off axis files from zip folder and for on axis i use the three merged ones from post 511, then set X/Y/Z position numbers for each driver where Z number is acoustic center relative to design axis and WM752 is reference point for designaxis. This outputs below visuals for design axis marked with red and X/Y/Z is also marked with red so you could check them out for errors.
So far couldn't find any vertical axis measurements into that zip folder, but biggest problem that needs your help is stopband tails is interpolated for all those measurements that is missing data for example below 300Hz, to show what i mean see second visual for 12PR320 where we see those off axis responses is bad interpollated compared to the on axis merged one, graph at button is with normalization.
Will imagine if we can get correct stopband tails for all these horizontal off axis and also feed some vertical off axis measurements with good tails that polar plots plus power response and directivity starts make usefull graphs to take decitions for final design.
Attachments
Last edited:
Have converted phase to MP for the 36 horizontal off axis files from zip folder and for on axis i use the three merged ones from post 511, then set X/Y/Z position numbers for each driver where Z number is acoustic center relative to design axis and WM752 is reference point for designaxis. This outputs below visuals for design axis marked with red and X/Y/Z is also marked with red so you could check them out for errors.
The numbers with red markings seem okay to me, except that I don't know the sign convention used in Vituix. Also, how do these numbers relate to the baffle position? The VM752 acoustic center is most likely not flush with the baffle surface.
How / where does Vituix take the baffle shape into account?
So far couldn't find any vertical axis measurements into that zip folder
There are no vertical dispersion measurements so far. How necessary / important are these?
...biggest problem that needs your help is stopband tails is interpolated for all those measurements that is missing data for example below 300Hz
The dispersion measurements were done in my workshop, where I can't get anechoic data to below 300 Hz. My outdoor measurements included only a very small number of off-axis measurements, simply because it was difficult to get the geometry of the microphone position relative to the baffle right in this setup. However, I don't think dispersion does much to the SPL response curves below 300 Hz, where the wavelength is larger than the drivers (or the whole speaker).
I'd therefore suggest either of these approaches:
- Just use the data as they are, and don't look at dispersion below 300 Hz.
- Use the low-frequency parts of the curves from post 511 and splice these to the off-axis measurements.
Happy New Year!
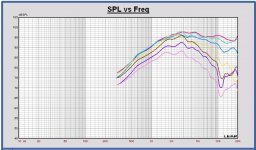
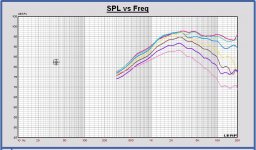
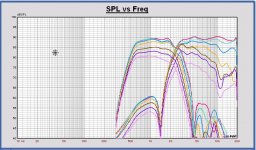
I made two horizontal off axis SPL plots of the filtered tweeter and midrange together in one plot for both inside and outside the cabinet. And also added the horizontal SPL off axis response of the tweeter inside and outside.
You can see there is a well behavior inside and that it is worse at the outside at 60 degrees and higher. A classical known problem with cabinets with flat front panel around 60 degrees off axis.
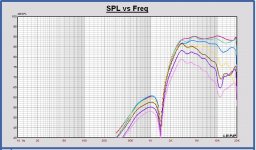
The 60 degrees peak is located around 2.8 kHz. In the tweeter DI in the single horizontal plane in post 527, a dip can be seen at 2.8 kHz, resulting in a peak at 4 kHz, it depends how you look to it. The tweeter DI curve concerns me, because it is not so monotone decreasing from high to low frequencies. Now it should be useful to have the IEC baffle measurements of the tweeter with waveguide to do an exact analysis. Probably this behavior is caused by the baffle diffraction.
With this cabinet with the asymmetric horizontal position of mirange and tweeter there is a different behavior at both sides of the cabinet. I am wondering now if it isn’t better to place drivers symmetric as a better compromise. It is a separate study to be done in the future.
Some general thoughts:
- Together with the horizontal dispersion, the vertical dispersion is interesting to look to the diffraction behavior of the tweeter and the midrange w.r.t. the distance from the cabinet top and the shape of the cabinet edges. For evaluation of the xo, in fact there is no real need for vertical off axis curves, as the behavior can be predicted knowing the vertical distance between the drivers and the type of xo that is used. But a total dispersion analysis is a very good check of the total speaker behavior, creating polar diagrams and DI curves of the total sum.
- In the vertical off axis SPL sum response some dips and peaks can be expected around the xo frequencies, in a way some DI peaks will appear also at these frequencies. The width of these peaks depends on the width of the xo overlap zones. To simulate the total DI in a single hemisphere, the filtered vertical dispersion curves are needed.
- In Leap it is a lot of work to create the vertical off axis sum curves. Measured curves cannot be assigned to the driver model. The Volt VM752 and the tweeter with waveguide cannot be exactly modelled in Leap. So, it is more easy to do the vertical dispersion analysis with an other sw like VituixCAD for example. If really needed it can be done in Leap. Only in the case good driver models can be made, a very exact analysis can be made.
I made two horizontal off axis SPL plots of the filtered tweeter and midrange together in one plot for both inside and outside the cabinet. And also added the horizontal SPL off axis response of the tweeter inside and outside.
You can see there is a well behavior inside and that it is worse at the outside at 60 degrees and higher. A classical known problem with cabinets with flat front panel around 60 degrees off axis.
The 60 degrees peak is located around 2.8 kHz. In the tweeter DI in the single horizontal plane in post 527, a dip can be seen at 2.8 kHz, resulting in a peak at 4 kHz, it depends how you look to it. The tweeter DI curve concerns me, because it is not so monotone decreasing from high to low frequencies. Now it should be useful to have the IEC baffle measurements of the tweeter with waveguide to do an exact analysis. Probably this behavior is caused by the baffle diffraction.
With this cabinet with the asymmetric horizontal position of mirange and tweeter there is a different behavior at both sides of the cabinet. I am wondering now if it isn’t better to place drivers symmetric as a better compromise. It is a separate study to be done in the future.
Some general thoughts:
- Together with the horizontal dispersion, the vertical dispersion is interesting to look to the diffraction behavior of the tweeter and the midrange w.r.t. the distance from the cabinet top and the shape of the cabinet edges. For evaluation of the xo, in fact there is no real need for vertical off axis curves, as the behavior can be predicted knowing the vertical distance between the drivers and the type of xo that is used. But a total dispersion analysis is a very good check of the total speaker behavior, creating polar diagrams and DI curves of the total sum.
- In the vertical off axis SPL sum response some dips and peaks can be expected around the xo frequencies, in a way some DI peaks will appear also at these frequencies. The width of these peaks depends on the width of the xo overlap zones. To simulate the total DI in a single hemisphere, the filtered vertical dispersion curves are needed.
- In Leap it is a lot of work to create the vertical off axis sum curves. Measured curves cannot be assigned to the driver model. The Volt VM752 and the tweeter with waveguide cannot be exactly modelled in Leap. So, it is more easy to do the vertical dispersion analysis with an other sw like VituixCAD for example. If really needed it can be done in Leap. Only in the case good driver models can be made, a very exact analysis can be made.
Attachments
-
 20190101 MonkeyB SPL outside tweeter no xo 0 15 30 45 60 75 90 deg.JPG141.1 KB · Views: 102
 -
 20190101 MonkeyB SPL inside tweeter no xo 0 15 30 45 60 75 90 deg.JPG145.7 KB · Views: 281
 -
 20190101 MonkeyB SPL outside midrange tweeter with xo 0 15 30 45 60 75 90 deg.JPG152.6 KB · Views: 283
 -
 20190101 MonkeyB SPL inside midrange tweeter with xo 0 15 30 45 60 75 90 deg .JPG156 KB · Views: 292
The numbers with red markings seem okay to me, except that I don't know the sign convention used in Vituix. Also, how do these numbers relate to the baffle position? The VM752 acoustic center is most likely not flush with the baffle surface.
How / where does Vituix take the baffle shape into account?...
Thanks checking red markings.
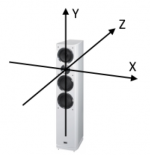
X/Y/Z convention, relative to center at left side of X axis its minus and right side is plus direction, relative to center below of Y axis its minus and above is plus direction, relative to center in front of Z axis its minus and behind is plus direction:
My gut feeling is the more axis we feed of measurements the better and baffle shape is build into those measurements, i know there is many tools build in that can simulate baffle or nearby boundery but think their use is more for initial planning of a new build so one can get a feeling where we are in planning before buying the real stuff, for example those tools can also at same output neat off axis data based on piston diameters but when it comes to the real world build and use of waveguides think its about feed the real world measurements.
Saw your post over at kimmosto's thread, think a little help for VituixCAD can be found at this link schroll down to bottom of page (Software) where there is some tutorials but think more important is download pdf file "Measurement Preparations" and to get a real feeling of navigating menus try download the real world build project called "Epe-3W_demo.zip" seen as second visual below and unzip it to users folder "Documents\VituixCAD\Projects".
...There are no vertical dispersion measurements so far. How necessary / important are these?...
Okay it is me that is wrong then in that i thought seen them somewhere, think for education of ourselves relative to real world sensed sound stage they can be good if you know what i mean for example when we make subjective conclusions there can be good hints in those polars 🙂
...The dispersion measurements were done in my workshop, where I can't get anechoic data to below 300 Hz. My outdoor measurements included only a very small number of off-axis measurements, simply because it was difficult to get the geometry of the microphone position relative to the baffle right in this setup. However, I don't think dispersion does much to the SPL response curves below 300 Hz, where the wavelength is larger than the drivers (or the whole speaker).
I'd therefore suggest either of these approaches:
- Just use the data as they are, and don't look at dispersion below 300 Hz.
- Use the low-frequency parts of the curves from post 511 and splice these to the off-axis measurements.
Thanks then think i try merge tails from post 511 where the off axis curves is cut.
Attachments
Last edited:
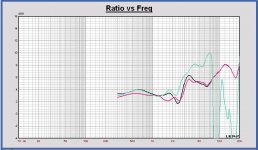
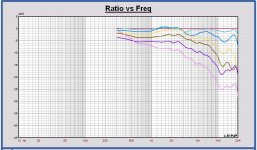
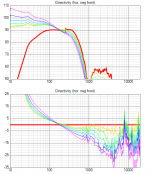
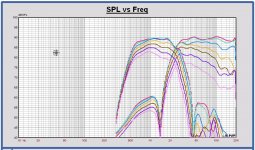
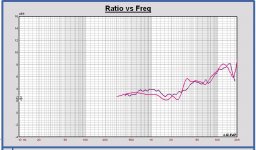
Just to understand the tweeter DI behavior, in the attached plot, I have compared the directivity index of the Scanspeak R2904 with WG148 waveguide mounted in the cabinet of Pida (violet curve) and the Monkey box cabinet (red curve).
The cabinet made by Pida is designed with curved cabinet edges. As far as I can understand it at this moment, that is the reason for the different DI curves.
I don't see it as a problem in the Monkey Box, because we have agreed at the start of the project to keep the cabinet simple.
The cabinet made by Pida is designed with curved cabinet edges. As far as I can understand it at this moment, that is the reason for the different DI curves.
I don't see it as a problem in the Monkey Box, because we have agreed at the start of the project to keep the cabinet simple.
Attachments
- Home
- Loudspeakers
- Multi-Way
- Open Source Monkey Box