I have written a bit about that... go this thread
New active 3-Way, Hypex and SB
and see post # 42 and 43.
New active 3-Way, Hypex and SB
and see post # 42 and 43.
Jim, how did you smooth the cal file? I have the same issue. My ECM8000 calibrated by Kim G has been great for years but only cal'ed to 24khz. So some years ago I got a mic from Cross spectrum Labs cal'ed out to 48khz but it had a stitch in the treble that showed up in measurements when I knew it shouldn't. Otherwise the two mics measured very close. If I can smooth that stitch I'd be happy.
how did you smooth the cal file?
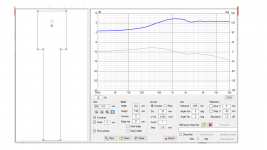
VituixCad2 has a function. In the graphic I show the OEM mic calibration and the 1/1 octave smoothed calibration.
My microphone calibration files were simple text files, hopefully your are also. I made a copy of the calibration file, and changed the file extension to *.txt. Then I opened VituixCad2 and opened the "tools" tab, then "calculator". I imported the calibration file as "A", and I got an error message that the file did not contain phase... I clicked OK and continued. I set smoothing first to 1/3 octave, and saved the file under a new name.
I then evaluated the effect on the on-axis impulse files previously recorded in ARTA. 1/3 octave smoothing of the calibration did not get the job done. I tried 1/2 octave, and finally 1/1 octave. That finally removed the "fingerprints" from the measured responses.
Be careful when working in the "calculator" page in VituixCad. There are a lot of options and buttons to click, and it is easy to select the wrong thing. I made every mistake possible.
jim
Attachments
Hello hifijim,
I was reading the praise by your neighbour HeadShake ..
Regards
Marinus
I was reading the praise by your neighbour HeadShake ..
.. and was wondering which program material you chose to present him your system. Would you mind to share this information?When a cymbal crashed it was huge and seemed to be bigger than the room. It was a really odd feeling hearing something that my ears said was taller than the room. If the music was recorded in a stadium, I felt like I was in a big stadium.
Regards
Marinus
He brought some of his own music, but I played
"Handful of Keys" Jazz at Lincoln Center Orchestra & Wynton Marsalis, 24bit/96k FLAC
"Mirages" Sabine Devieilhe, 24b/96k FLAC
"Eclipse" Joey Alexander, 24b/29k FLAC
"Bringin' It" Christian McBride Big Band, 24b/96k FLAC
"Traveller" Chris Stapleton, CD (16b/44.1k)
"Stadium Arcadium" Red Hot Chili Peppers, CD (16b/44.1k)
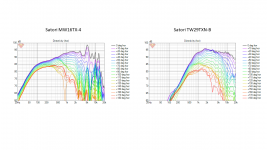
The next stage of this adventure was making the full set of off axis measurements of the drivers.
I made a turntable from a heavy duty lazy-susan bearing. With ARTA, taking the impulse response every 10 degrees was pretty fast.
My woofer cabinet operates up to 200 Hz. I felt there was no point in getting measured polar responses from this.
The next step was to load these responses into my VituixCad2 simulation and see what the predicted power response, predicted in-room response, and directivity index wold be. I will talk about this in a future post.
Attachments


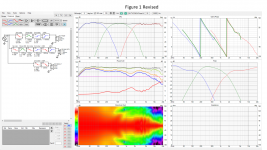
About 3 weeks ago I loaded the full set of horizontal polar responses into VituixCad2. The result is shown in Figure 1. The filter elements shown in the crossover frame are exactly as they are loaded into the Hypex filter design software, same frequency, same Q, same magnitude. As I have mentioned before, the gain and time delay of the drivers must be adjusted slightly to get a perfect match to the simulation, typically less than 1 dB difference in gain and less than 30 us difference in delay. At this point I would like to pause and raise a glass to Kimmo and say "Kippis… Well done Sir!” . VituixCad2 is truly impressive.
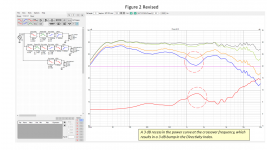
Figure 2 shows the Power and DI frame. My system was optimized for on-axis performance and low diffraction. I did not design for power response or DI, so it is no surprise that the power curve is not the ideal shape. There is a -3 dB recess in the power curve and the PIR (predicted in room) curve, and this results in a 3 dB bump in the DI curve. Floyd Toole has said that small bumps such as this are almost unavoidable with cone-dome systems, and are generally harmless. However, in a later post I will describe what I have tried to do about it.
j.
Attachments
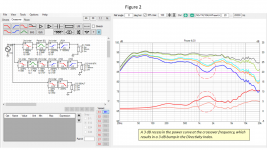
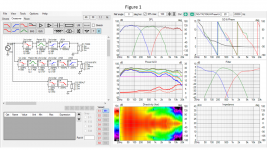
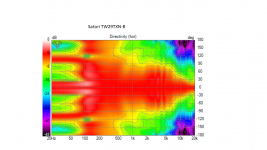
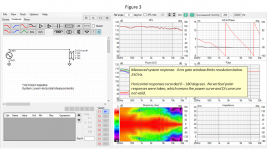
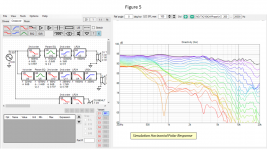
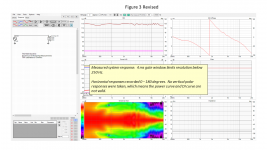
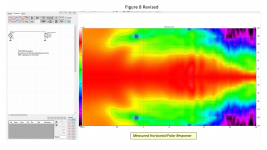
Figure 3 is the measured system response, taken at the same time as the driver responses. The gate window was 4 ms, so I am only showing the curves above 200 Hz. I am quite happy with the agreement between simulation and measured. I made horizontal polar measurements, but not vertical polar measurements. This means that the Power & DI curves are not valid. VituixCad would assume that the vertical responses would match the horizontal, and the result would be (falsely) a very nice power and DI curve… So I am obscuring the result.
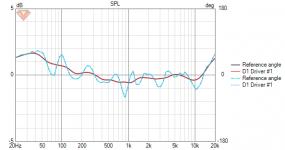
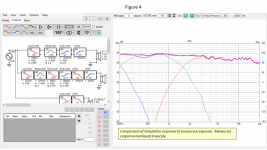
Figure 4 is a comparison of the on-axis response of the simulation to the actual measured response. Purple is the measured.
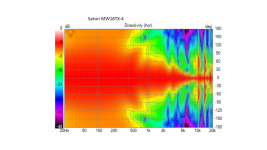
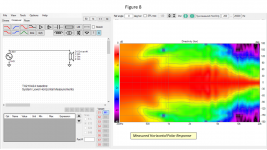
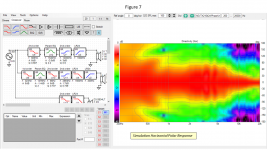
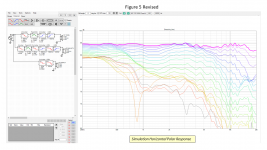
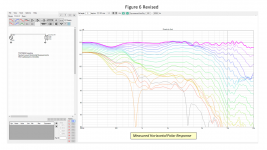
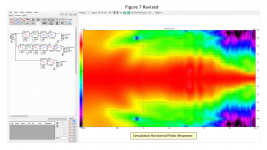
Figures 5 & 6 are the horizontal polar responses of the simulation and the actual measured. Figures 7 & 8 are the horizontal polar map of the simulation and the actual measured.
Again, I am very pleased with the accuracy of the simulation.
Figure 4 is a comparison of the on-axis response of the simulation to the actual measured response. Purple is the measured.
Figures 5 & 6 are the horizontal polar responses of the simulation and the actual measured. Figures 7 & 8 are the horizontal polar map of the simulation and the actual measured.
Again, I am very pleased with the accuracy of the simulation.
Attachments

These are awesome results in terms of the match between simulations and measurements. 🙂
This gives beginners like me more confidence about the whole design process and faith that once the instructions along with VituixCAD are adhered to, it will lead to very predictable results.
Thanks
This gives beginners like me more confidence about the whole design process and faith that once the instructions along with VituixCAD are adhered to, it will lead to very predictable results.
Thanks
hifijim, looking at your measurements in #146, it appers like tweeter in WG. Same for MW16TX, the response goes downhill for high frequencies (compared to my measurements). Are these raw drivers measurements, no crossover, no EQ?
I would expect tweeter on axis response to be generally flat from 2-10k, but your measurements shown downhill trend.
I would expect tweeter on axis response to be generally flat from 2-10k, but your measurements shown downhill trend.
These are awesome results in terms of the match between simulations and measurements.
Thanks. I did not get a good match at first. Mic position must be carefully controlled, and this is why I made a turntable. The conversion of impulse response to frequency response must be carefully handled. I did it wrong several times before getting it right.
looking at your measurements in #146, it appears like tweeter in WG. Same for MW16TX, the response goes downhill for high frequencies (compared to my measurements). Are these raw drivers measurements, no crossover, no EQ?
That is a good observation, Pida. This is the actual raw driver response in my cabinet. When I first got the drivers, I measured them in a 24" x 24" foam board baffle, which for the tweeter is nearly infinite baffle. See this post 546 https://www.diyaudio.com/forums/multi-way/343831-sb-acoustics-textreme-55.html#post6395452
This was made with the OmniMic, so the response is elevated by 2 dB in the upper treble compared to the more recent TM1 mic measurements. But clearly the IB response is admirably flat.
I think we are seeing the effect of baffle step and diffraction. The VituixCad diffraction tool predicts a broad hump between 700Hz - 2000 Hz. But the simulation hump is about 2 dB, and my measured responses seem more like 4 dB. I am not sure why. One possibility is the additional diffraction of the tweeter response as it flows over the woofer cone. Normal diffraction simulations do not account for that. I wrote about that here
Interesting Diffraction Effect
So it is somewhat of a mystery to me as well...
Attachments
Hmm as actual raw driver response in the cabinet it looks very suspicious. Mw16 as well, compared to my measurements.
It could be mic, or something in your measurement setup or sw. Do you measure over asio? In some cases sound card drivers or utilities can talk into measurement, so check that all this is switched off.
It could be mic, or something in your measurement setup or sw. Do you measure over asio? In some cases sound card drivers or utilities can talk into measurement, so check that all this is switched off.
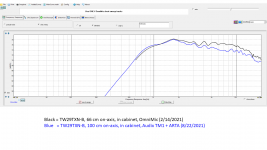
Well it could very well be suspicious. As I said in post 138, there is a 2 dB difference between the Audix microphone and the OmniMic microphone, and I do not know which is closer to truth.
See attached graphic. The Omnimic measurement shows a 2 dB hump near 2k that is consistant with the VituixCad diffraction simulation. If we assume the OmniMic is correct, then the Audix mic has the same 2 dB hump at 2k, but also an additional 2 dB shelving down in response above ~ 5k.
So maybe OmniMic is more correct? Thanks for your thoughts... "progress is a team sport"
j.
Attachments
Omnimic looks more correct.
Do you have possibility to borrow some reliable mic? Or to send omnimic to csl for caibration?
Do you have possibility to borrow some reliable mic? Or to send omnimic to csl for caibration?
I thank you for your thoughts. When I look back with a fresh perspective at all the evidence, I now believe that the OmniMic is closer to truth.
My test infinite baffle response taken with Omnimic back in October 2020 matches HiFiCompass results very closely, to within about +/- 0.5 dB. If I believe OmniMic, then my system is flat on axis, and this is how I prefer it. If I believe OmniMic, the raw tweeter response has a +2 dB hump from 1k to 3k which matches up nicely with the diffraction simulation.
If I believe Audix TM1, then my IB response from October 2020 no longer matches HiFiCompass, even though my two tweeters match each other almost exactly. If I believe TM1, my tweeter has an unexplained wave-guide-like 4 dB hump which spans from 1k to 8k. If I believe Audix, my system is not flat on axis, but has a gentle 2 dB rolloff from 1k to 10k, and If I eq it to be flat, it sounds too bright to my ears.
Taking consideration of both arguments, it seems much more likely that the OmniMic is closer to the truth.
Thanks, Pida, for helping focus my mind on this a bit.
I adjusted the calibration of my Audix TM1 mic so that it matches the OmniMic (+/- .25 dB more or less).
Here are revised graphics for posts 146, 147, and 148.
Here are revised graphics for posts 146, 147, and 148.
Attachments
and more...
Once again, thank you Pida for helping me think through this. I had a mental block because I had just bought the Audix mic, and after spending $400 for the TM1-Plus, I was reluctant to believe it might be a bit off. In fairness, it is rated at +/- 2 dB, and it does match the OmniMic to within 2 dB...
In a future post I will talk about my adventures in trying to get a more flattened DI curve while maintaining a good on-axis response... more to come.
Jim
Attachments

Hifijim, I glad you figured it out, new results look alright.
Regarding DI improvement, I wanted to suggest symetric LR2, but I realized MW16TX might make it difficult. I tried to model passive LR2 but did not come to any reasonable result, but with DSP it might be feasible.
Regarding DI improvement, I wanted to suggest symetric LR2, but I realized MW16TX might make it difficult. I tried to model passive LR2 but did not come to any reasonable result, but with DSP it might be feasible.
hifijim, to me it looks like you have DI calculated from 0-180deg (or even 4pi?), that's why it looks so "bad".
Considering only 0-90deg hor curves and looking at spectrogram itself, directivity is pretty good and smooth!
Considering only 0-90deg hor curves and looking at spectrogram itself, directivity is pretty good and smooth!
hifijim, to me it looks like you have DI calculated from 0-180deg (or even 4pi?), that's why it looks so "bad"
I am using the defaults in VituixCad2. Until you mentioned it, I was not aware the software supported alternate definitions of DI. But I found it in the Help pages.... in the "options" window... interesting.
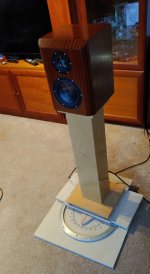
On the left side, the woofer cabinet is in the corner, and the satellite unit is about 100 cm out from the corner. On the right side the woofer cabinet and satellite are near an open pathway to another room, so it is very close to a 4pi space. The two woofer cabinets energize very different room modes. The left side (corner) woofer has 6+ dB room gain over the left side, but it has some nulls. The right side has almost no room gain, but the room response is very smooth from this woofer... it almost resembles a near field measurement. So between the two sides, I get a nice bass response... as long as the low frequency content is more or less equal in both channels, which is almost always true..
So I don't know what is the appropriate DI definition to use. Based on what I read from F. Toole, I think the 4pi definition is most appropriate, but I am open to suggestions.
Thanks for your thoughts !
- Home
- Loudspeakers
- Multi-Way
- New active Satori Textreme