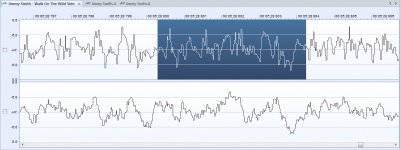
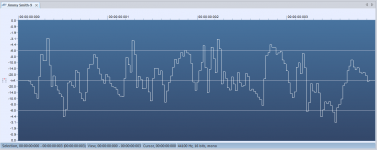
Hans, Here is a sample of the digital recording from the CD.
I took from it a small area in mono, highlighted in dark.
The third figure shows the same fragment of the recording from the DAC output of the onboard computer. In a computer, the signal in this form goes to the line-out and to the amplifier for phones. Question:
can i feed this signal directly to the amp model for testing?
Attachments

Since there are no good enough reasons to kick out this petr_2009 character and stop his stinkin’ pollution across multiple threads, don’t you think guys it’s time to stop feeding the troll? Can’t we just ignore him, hoping he’ll drown in his own pile of steaming bull chips?
I know I can, except for this message 😀.
I hate to admit defeat, I believe in discussion. But with someone who thinks that voltages in any physical system can change levels in zero time, it's probably a lost cause.
Must be nice to have your own private reality.
Bob Cordell was much smarter than me here. I'm with you.
Jan
Last edited:
Since there are no good enough reasons to kick out this petr_2009 character and stop his stinkin’ pollution across multiple threads, don’t you think guys it’s time to stop feeding the troll? Can’t we just ignore him, hoping he’ll drown in his own pile of steaming bull chips?
I know I can, except for this message 😀.
Let me follow your advise.
Enough is enough after zero progress has been made.
Hans
Taking into account the negative attitude towards my experiments, I am saying goodbye to the last SWDT test of two amplifier models on two signals recorded in CD format.
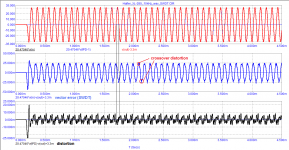
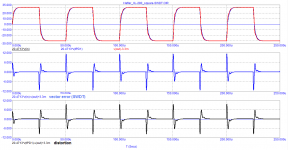
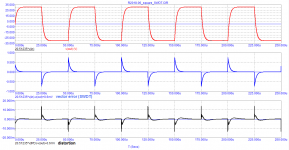
Figure 01 shows a 10 kHz signal digitally taken from an audio editor.
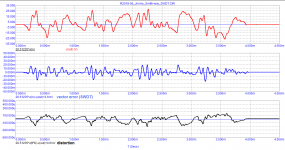
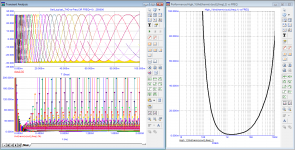
Figures 02 and 03 show the test results of the two amplifiers.
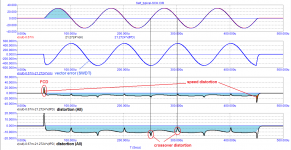
According to Hafler, the vector error at the highest frequencies of the audio range should be no more than -60 dB (less than 1 / 1000Vout). With an output voltage of 30V (peak), it should be less than 30mV. As you can see, Hafler's requirement is being fulfilled.
The second amplifier has about 1.5 times the signal propagation delay, so the vector error is higher.
The lower graphs of the tests show the distortions. I hope it is clear how they are measured from the designations on the graphs.
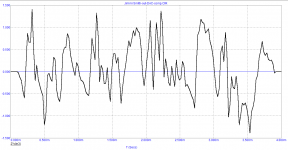
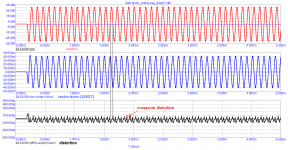
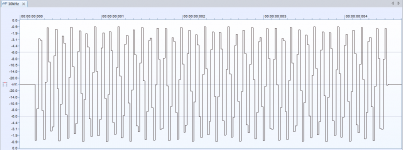
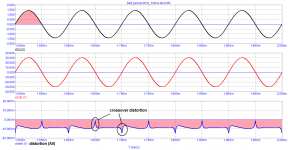
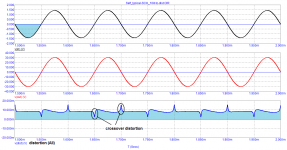
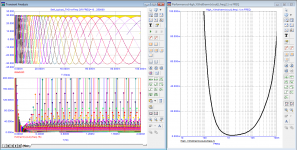
In the next test, we used a fragment of the digitized audio signal in Fig. 04.
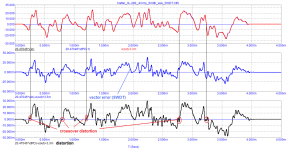
In the settings of the models, I did not change anything, only replaced the 10 kHz signal with an audio signal - Figures 05 and 06.
Signal replacement practically did not affect the amplitude of vector errors.
But the distortion in the XL-280 amplifier increased by at least 4 times (12 dB), while in the second amplifier the distortion amplitude practically did not change.
Why such a result I hope is clear from the arguments and explanations given earlier.
Figure 01 shows a 10 kHz signal digitally taken from an audio editor.
Figures 02 and 03 show the test results of the two amplifiers.
According to Hafler, the vector error at the highest frequencies of the audio range should be no more than -60 dB (less than 1 / 1000Vout). With an output voltage of 30V (peak), it should be less than 30mV. As you can see, Hafler's requirement is being fulfilled.
The second amplifier has about 1.5 times the signal propagation delay, so the vector error is higher.
The lower graphs of the tests show the distortions. I hope it is clear how they are measured from the designations on the graphs.
In the next test, we used a fragment of the digitized audio signal in Fig. 04.
In the settings of the models, I did not change anything, only replaced the 10 kHz signal with an audio signal - Figures 05 and 06.
Signal replacement practically did not affect the amplitude of vector errors.
But the distortion in the XL-280 amplifier increased by at least 4 times (12 dB), while in the second amplifier the distortion amplitude practically did not change.
Why such a result I hope is clear from the arguments and explanations given earlier.
Attachments
-
 06_R2018-06_Jimmy_Smith-wav_SWDT.png36.6 KB · Views: 131
 -
 05_Hafler_XL-280_Jimmy_Smith-wav_SWDT.png41.3 KB · Views: 123
 -
 04_Jimmy Smith-9c.png19.7 KB · Views: 137
 -
 03_R2018-06_10kHz-wav_SWDT.png42.5 KB · Views: 131
 -
 02_Hafler_XL-280_10kHz-wav_SWDT.png40.9 KB · Views: 241
 -
 01_10kHz_wav.png14.5 KB · Views: 240
Let me follow your advise.
Enough is enough after zero progress has been made.
Hans
The ignore list is your friend!
Jan
The third figure shows the same fragment of the recording from the DAC output of the onboard computer. In a computer, the signal in this form goes to the line-out and to the amplifier for phones. Question:
can i feed this signal directly to the amp model for testing?
There is a problem with the third figure. It appears undersampled and or improperly interpolated (looks like straight line interpolation which is not accurate for filling in between sample points). Was it taken with a scope? If so, what were the scope settings? Where was the probe attached?
If we had a good scope shot of the analog output of the PC, then most likely it will look proper to run into a power amp.
In one of the answers to questions about the article (D.A. Hafler, Listening Test for Amplifier Distortion, Hi-Fi News and Review, November 1986, pp. 25-29) Hafler writes:
“This is not a new idea. However, in the past, amplifiers have performed very poorly in this test, which revealed all the flaws. The XL-280 may be the first amplifier to offer a good zero signal from SWDT. " Obviously, if the input and output are identical, there will be no signal in the monitor speaker (headphones). Any sound heard after carefully adjusting the level will be distortion. For the "null test" Hafler suggested a level of -70 dB for mid-range frequencies (signal attenuation by 3000 times or up to 0.03%) and -60 dB (signal attenuation by 1000 times or up to 0.1%) for higher frequencies of the audio range.
In fact, the test does not measure distortion, but only vector errors that depend on both the signal frequency and the transmission delay (Group Delay):
a = 2πA tPD / T
where
T is the signal period, μs;
A - signal amplitude at the outputs of the amplifiers, V
tPD - signal transit delay time, μs
Suppose we want to run a SWDT test at 20 kHz in an amplifier with an output voltage of 30 V peak. Then, to fulfill the Hafler condition, the vector error "a" must be no more than 30 mV (30,000/1000 = 30 mV).
Let's calculate what the Group Delay should be for the amplifier to meet the reference requirements:
tPD = AT / 2πA = 30mV 50 μs / 6.28 30000mV = 0.008 μs = 8 ns
But to fulfill this condition, the amplifier must be very broadband, more than 20 MHz, which is not easy to implement.
And although the Hafler XL-280 amplifier allows you to adjust the signal propagation delay in the audio band to almost zero, and even to a negative value, it does not have such wide bandwidth.
In the passport for the amplifier, a small-signal bandwidth of 500 kHz is indicated, and the full power bandwidth is at least 100 kHz, which is clearly not enough for an amplifier that claims to be a reference.
Let's carry out an additional test on a square-wave signal passed through a 100 kHz low-pass filter. The test results are presented in Figures 07 and 08.
p.s.
Hans, you are making zero progress because you are not even trying to grasp the essence of the Haffler test.
Attachments
Last edited:
Square wave tests can be appropriate for use in stability evaluation. They are not appropriate test signals to simulate normal bandlimited audio signals.
I know Petr_2009 personally, from years ago I make lot of his amplifiers and they sound really good!
The last amplifier from him is "Audiophille amplifier without negative feedback", this is really great idea. Amplifier have 25 nanoseconds propagation time and very low distortion - and this is complete without global feedback (it have only local feedbacks).
So, please stop trolling Petr_2009, because he is great engineer with big knowledge, also his amplifiers sounds really good (you can MAKE THEM and do tests).
If you do not agree with his theory, please ARGUMENT yourself - with simulation, results from listening or measurements of prototype, etc.
But if you cannot do argumentation, just please stop FLOODING here.
Last edited:
I know Petr_2009 personally, from years ago I make lot of his amplifiers and they sound really good!
Hi Altium,
You are more than welcome to show here one of these builds.
Cheers,
Jacques
Square wave tests can be appropriate for use in stability evaluation. They are not appropriate test signals to simulate normal bandlimited audio signals.
why, the rectangular signal is used in the DIM-30 and DIM-100 tests
Those tests use a low pass filtered square wave, not an unfiltered one with excessively fast rise-time.
Those tests use a low pass filtered square wave, not an unfiltered one with excessively fast rise-time.
the numbers 30 and 100 represent the cutoff frequency in kHz of the first-order low-pass filter. I also use 100 kHz low-pass filter processing.
Amplifier distortion outside of standard tests
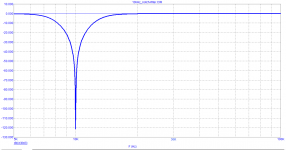
We use a simple 4th-order Bessel notch filter as a measuring device.
From the Bode diagram, it can be seen that it submits the fundamental frequency of 10 kHz to about 120 dB, the 2nd harmonic and higher pass without attenuation.
Let's apply two signals to the input of such a filter: 10 kHz with an amplitude of 10 V (peak) and 30 kHz with 1 mV (peak) - 80 dB.
At the output of the filter, we see only a 30 kHz signal with a level of 1 mV.
But the transient processes in the filter itself last about 10 periods of the main signal and the measurement result can be seen no earlier than after 1 ms.
Let's see what can be measured with such a simple virtual instrument that we cannot measure with standard instruments.
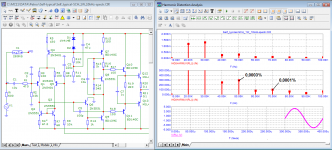
To do this, let's take a typical Douglas Self scheme.
First, let's run standard tests:
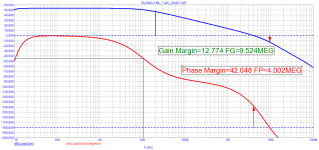
Bode diagram,
loop gain,
spectrum of a signal with a frequency of 10 kHz.
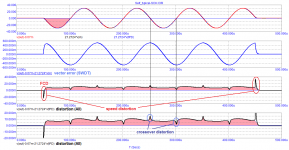
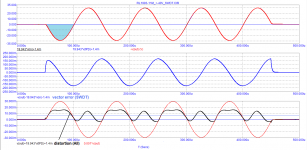
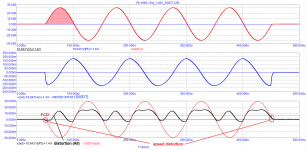
The output voltage contains a wide range of harmonics.
The weighted level of the 7th harmonic is 0.03%.
The amplitude of the switching distortion reaches 10 mV, which is 0.03%.
The same level and constant component in the output signal - depends on the polarity of the first period. When measuring distortions by the compensation method, we see the same distortions as at the output of the notch filter. Only in this case there is no need to skip 10 signal periods. On the burst, in addition to distortions in the steady-state mode, we see velocity distortions with an amplitude of up to 30 mV (0.3%) and more, and the same constant component depending on the polarity of the first period.
We use a simple 4th-order Bessel notch filter as a measuring device.
From the Bode diagram, it can be seen that it submits the fundamental frequency of 10 kHz to about 120 dB, the 2nd harmonic and higher pass without attenuation.
Let's apply two signals to the input of such a filter: 10 kHz with an amplitude of 10 V (peak) and 30 kHz with 1 mV (peak) - 80 dB.
At the output of the filter, we see only a 30 kHz signal with a level of 1 mV.
But the transient processes in the filter itself last about 10 periods of the main signal and the measurement result can be seen no earlier than after 1 ms.
Let's see what can be measured with such a simple virtual instrument that we cannot measure with standard instruments.
To do this, let's take a typical Douglas Self scheme.
First, let's run standard tests:
Bode diagram,
loop gain,
spectrum of a signal with a frequency of 10 kHz.
The output voltage contains a wide range of harmonics.
The weighted level of the 7th harmonic is 0.03%.
The amplitude of the switching distortion reaches 10 mV, which is 0.03%.
The same level and constant component in the output signal - depends on the polarity of the first period. When measuring distortions by the compensation method, we see the same distortions as at the output of the notch filter. Only in this case there is no need to skip 10 signal periods. On the burst, in addition to distortions in the steady-state mode, we see velocity distortions with an amplitude of up to 30 mV (0.3%) and more, and the same constant component depending on the polarity of the first period.
Attachments
-
 07_Self_10kHz-spectr.png32.7 KB · Views: 127
 -
 08_Self_10kHz-dist-positive.png29.7 KB · Views: 128
 -
 09_Self_10kHz-dist-negative.png29.7 KB · Views: 127
 -
 10_Self_SWDT-positive.png37.4 KB · Views: 111
 -
 06_Self_Loop-Gain.png55.4 KB · Views: 126
 -
 05_Self_Bode.png20.7 KB · Views: 181
 -
 04_Self_SCH.png32.8 KB · Views: 199
 -
 03_10kHz_notch-filter-working.png40.4 KB · Views: 173
 -
 02_10kHz_notch-filter-Bode.png15.5 KB · Views: 163
 -
 01_10kHz_notch-filter.png11 KB · Views: 152
Distortions undetectable by standard measurement methods
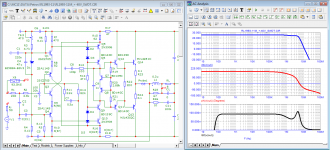
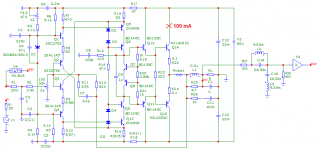
In Russia, amplifiers with an artificial midpoint in the power supply formed by a capacitive divider were once popular. The main popularizer was I. Akulinichev.
Over 30 years ago I also developed a similar amplifier, see diagram. The output stage is the same Darlington double as in the typical Douglas Self circuit, the quiescent current of the output transistors is also set to 100 mA.
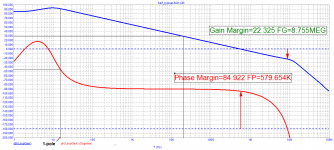
As can be seen from the Bode diagram, even with a choke at the output, the signal propagation delay time does not exceed 100 ns (tPD = 93.5 NS).
Group Delay is almost constant up to 500 kHz, At 5 MHz, there is a slight increase in Group Delay, which practically does not affect the parameters of the amplifier. Distortion of a 10 kHz signal is measured by three methods:
using the FFT analysis of the built-in program;
using a notch filter;
compensation method.
Distortion at the output has a small bias of about 7 mV, which does not depend on the polarity of the first period of the signal. Due to the increased frequency of the first pole and the relatively small signal propagation delay, the distortion of the output signal is free from crossover and velocity distortion.
It is generally accepted that special attention should be paid to the distortion of the first Watt.
At the end there are tests of two amplifiers at 1 W.
In Russia, amplifiers with an artificial midpoint in the power supply formed by a capacitive divider were once popular. The main popularizer was I. Akulinichev.
Over 30 years ago I also developed a similar amplifier, see diagram. The output stage is the same Darlington double as in the typical Douglas Self circuit, the quiescent current of the output transistors is also set to 100 mA.
As can be seen from the Bode diagram, even with a choke at the output, the signal propagation delay time does not exceed 100 ns (tPD = 93.5 NS).
Group Delay is almost constant up to 500 kHz, At 5 MHz, there is a slight increase in Group Delay, which practically does not affect the parameters of the amplifier. Distortion of a 10 kHz signal is measured by three methods:
using the FFT analysis of the built-in program;
using a notch filter;
compensation method.
Distortion at the output has a small bias of about 7 mV, which does not depend on the polarity of the first period of the signal. Due to the increased frequency of the first pole and the relatively small signal propagation delay, the distortion of the output signal is free from crossover and velocity distortion.
It is generally accepted that special attention should be paid to the distortion of the first Watt.
At the end there are tests of two amplifiers at 1 W.
Attachments
-
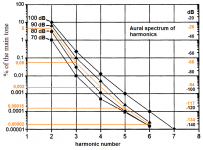 Cheever_Aural spectrum of harmonics.png43.3 KB · Views: 168
 -
 14_Self_1W_10kHz-spectr.png74.9 KB · Views: 135
 -
 08_RL1993-11M_1W_10kHz-spectr.png84.5 KB · Views: 144
 -
 07_RL1993-11M_10kHz-spectr.png89.8 KB · Views: 140
 -
 06_RL1993-11M_10kHz-SWDT-negative.png35.9 KB · Views: 135
 -
 05_RL1993-11M_10kHz-SWDT-positive.png38.1 KB · Views: 125
 -
 03_RL1993-11M_Loop-Gain.png33 KB · Views: 135
 -
 02_RL1993-11M_Bode.png84.7 KB · Views: 162
 -
 01_RL1993-11M_SCH.png40.9 KB · Views: 165
Distortions that are not detected by standard tests.


Let's make a SWDT of two amplifiers at 100 Hz.
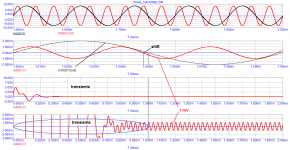
As the test shows, the output signal with a frequency of 100 Hz of a typical Douglas Self amplifier in the steady state has a signal advance of 48 μs.
The time to reach the steady state (linear mode, the mode where there are no additional spectral components) takes at least 250 ms (25 periods).
In this case, at the beginning of a burst of 100 Hz, an output signal shift of up to 900 mV occurs! The sign of the offset depends on the polarity of the first half cycle. These distortions give a sharp increase in distortion in the low-frequency region in the test of the dependence of THD on frequency (Fig. 12, 13).
My amp with an artificial midpoint at 100 Hz also has an offset of up to 280 mV. Therefore, we had to abandon the artificial midpoint, and maintain zero at the output using a servo control system.
After revision (see diagram), the signal shift does not occur. Distortion at low frequencies is the same as at 10 kHz.
The situation is even worse in a number of amplifiers at the lowest frequency of the audio range. The Douglas Self Amplifier on a 20 Hz burst has a signal offset of more than 4.5 V !, a zero return time of more than 250 ms.
The servo-controlled RL1993-11M amplifier introduces an offset of only 10 mV. The time to return to zero is less than 150 ms.
Note. "Gold ears" claim that the offset of the 50 mV signal is already well audible and has a negative effect on the sound.
Additionally, tests for the presence of crossover distortions have been carried out. I want to draw your attention to the fact that both amplifiers have the same output stages, with the same quiescent current. At the same time, in one amplifier we see clearly pronounced crossover distortions, and in the second there are practically none.
Crossover distortion test carried out with a modified filter
Let's make a SWDT of two amplifiers at 100 Hz.
As the test shows, the output signal with a frequency of 100 Hz of a typical Douglas Self amplifier in the steady state has a signal advance of 48 μs.
The time to reach the steady state (linear mode, the mode where there are no additional spectral components) takes at least 250 ms (25 periods).
In this case, at the beginning of a burst of 100 Hz, an output signal shift of up to 900 mV occurs! The sign of the offset depends on the polarity of the first half cycle. These distortions give a sharp increase in distortion in the low-frequency region in the test of the dependence of THD on frequency (Fig. 12, 13).
My amp with an artificial midpoint at 100 Hz also has an offset of up to 280 mV. Therefore, we had to abandon the artificial midpoint, and maintain zero at the output using a servo control system.
After revision (see diagram), the signal shift does not occur. Distortion at low frequencies is the same as at 10 kHz.
The situation is even worse in a number of amplifiers at the lowest frequency of the audio range. The Douglas Self Amplifier on a 20 Hz burst has a signal offset of more than 4.5 V !, a zero return time of more than 250 ms.
The servo-controlled RL1993-11M amplifier introduces an offset of only 10 mV. The time to return to zero is less than 150 ms.
Note. "Gold ears" claim that the offset of the 50 mV signal is already well audible and has a negative effect on the sound.
Additionally, tests for the presence of crossover distortions have been carried out. I want to draw your attention to the fact that both amplifiers have the same output stages, with the same quiescent current. At the same time, in one amplifier we see clearly pronounced crossover distortions, and in the second there are practically none.
Crossover distortion test carried out with a modified filter
Many developers attach great importance to the parameters of the first watt


For who understands I will summarize
For who understands I will summarize
fagos, you are right as alwaysThe comparison is clearly not in favor of your amplifier.
- Home
- Amplifiers
- Solid State
- Musings on amp design... a thread split