
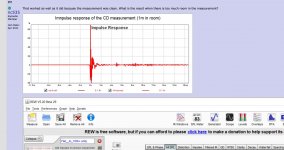
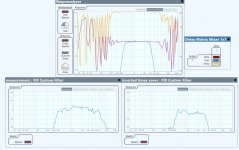
well simulation produces pretty graphs. Here is one built on readl measurement data - my synergy mids with the mic right at the center of the mouth of the horn.
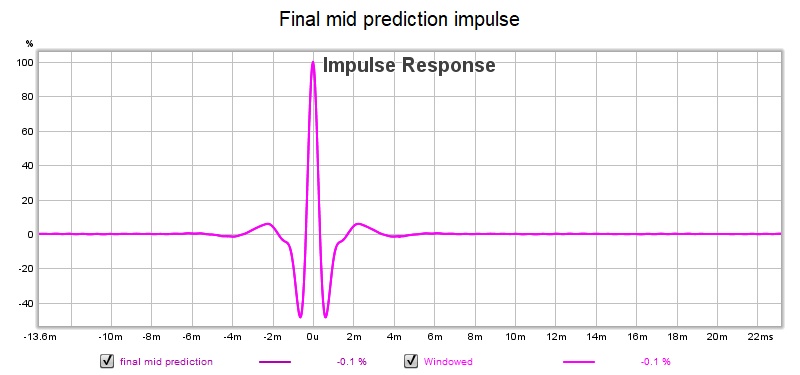
My old measurement was taken only 200 to 2000 hz so we see artifacts of that in the graph. By the way, the final prediction has a near perfect impulse despite being able to see remnants of the throat reflection null in the frequency response.
I don't imagine it would look quite so pretty if I actually implemented a new XO and took measurements but I'm not set up for that at the moment
This is really great stuff, thx...the impulse inversion strikes me as the ultimate driver pre-flattening i've been so overbearingly recommending...and is dang simple 🙂
Trying to fully understand what you did, and learn the REW operations too.
A few questions if I may....
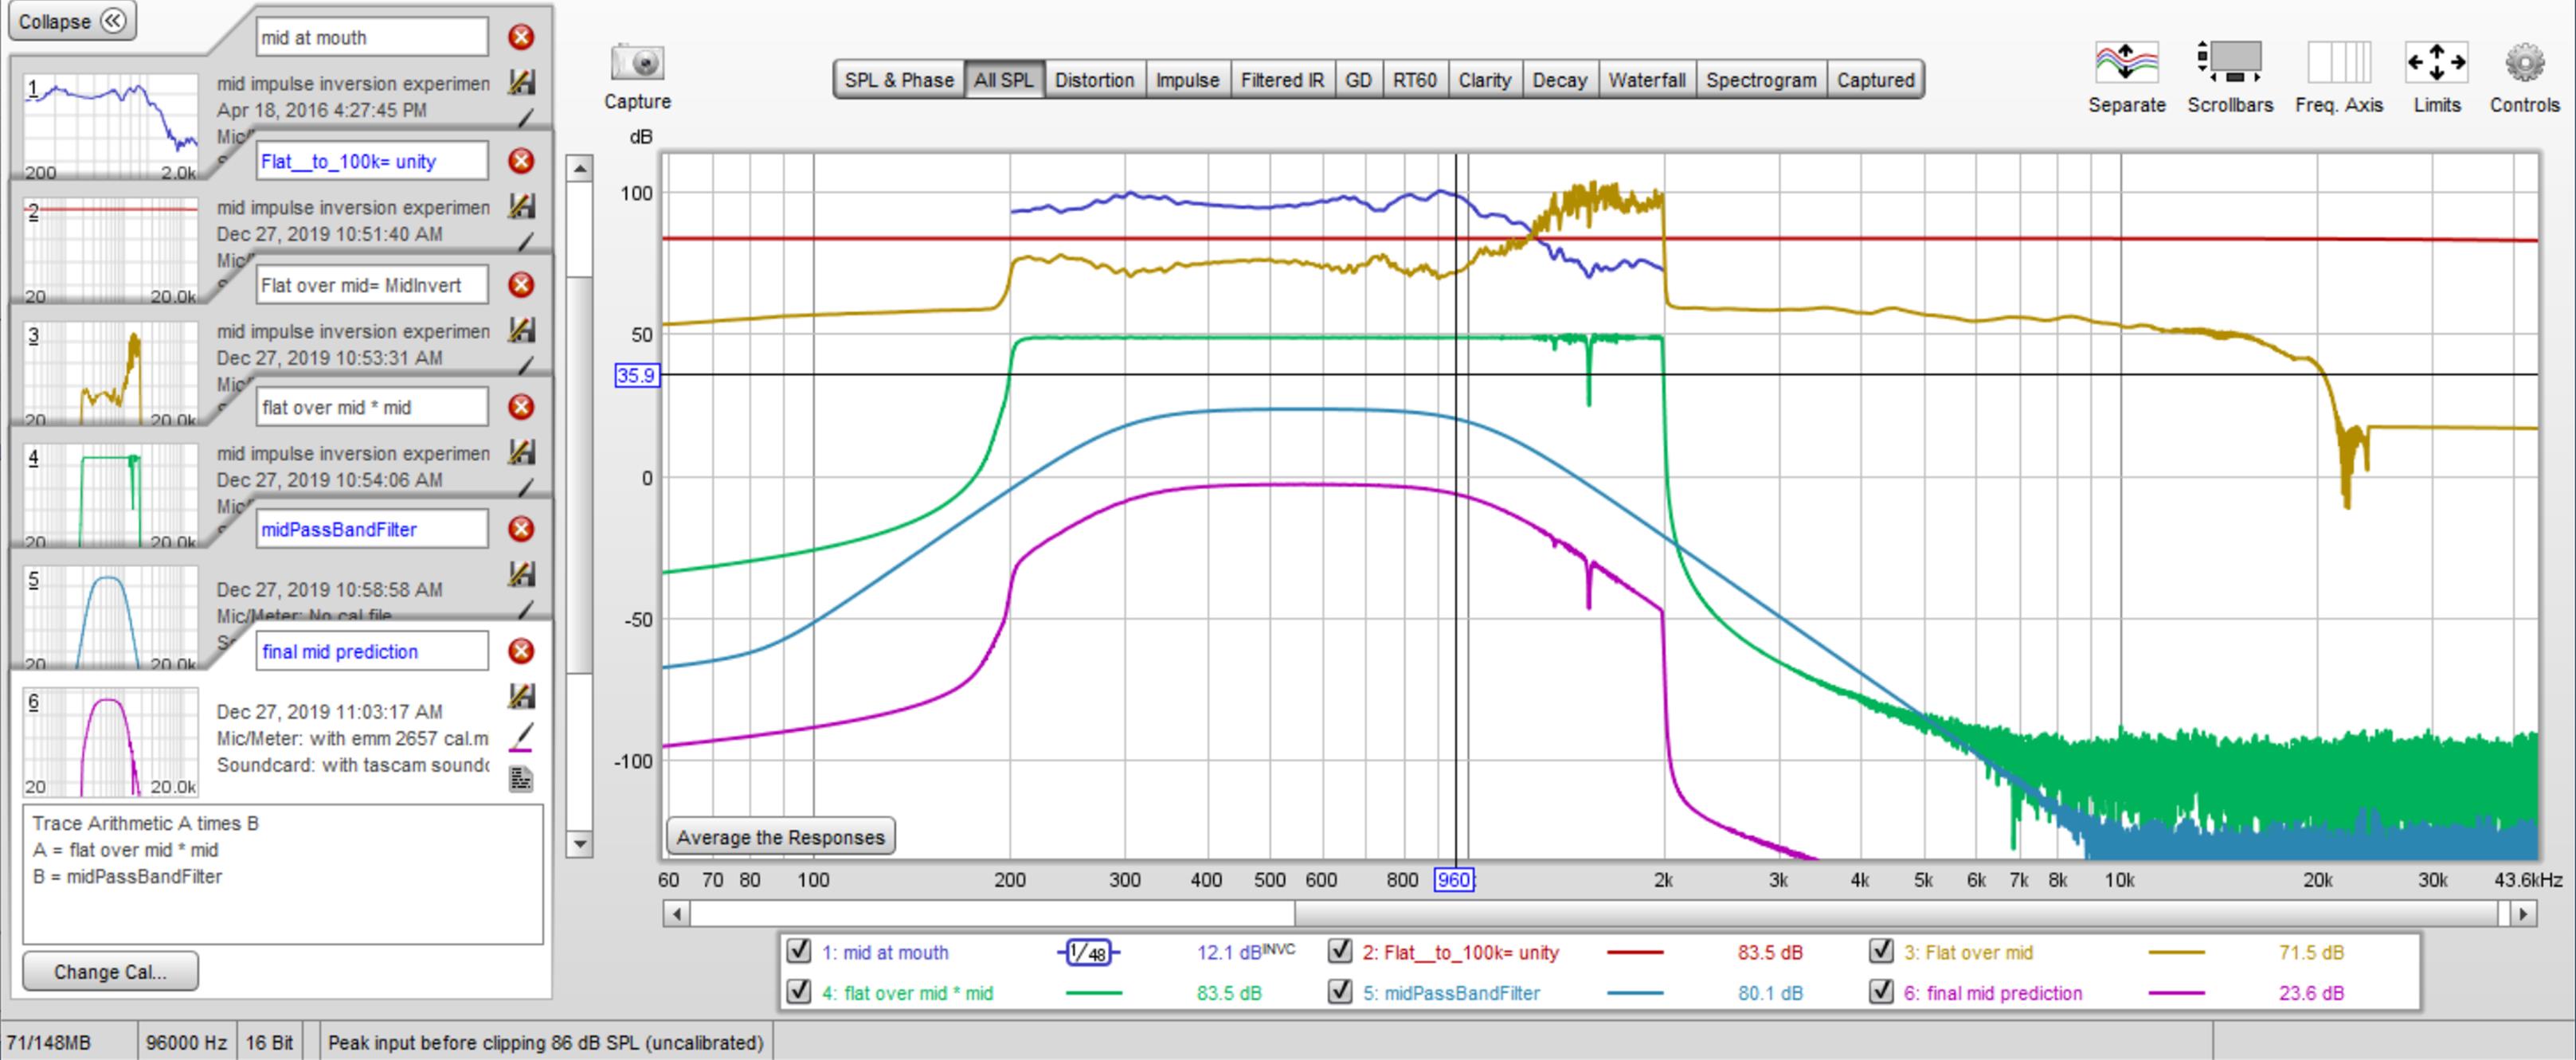
On your trace#3 that gives mid invert..... why does response go flat below 200Hz and above 2kHz...or maybe I should ask why trace#1 measurement is truncated to 200-2kHz ? Brick wall xover in place?
Why did you choose to make trace#4 flat over mid*mid invert?
I would have thought i simply want mid*mid-invert to then apply crossover to...
Did you import trace#5, the xover, from another program or can REW generate one itself?
Can I simply invert the impulse in the Impulse tab, and export the inverted impulse somehow?
Or is the only way to export an inverted impulse via the trace arithmetic? ( I don't understand the impulse export options yet)
Big thx, sorry for the questions barrage....
I'm gonna now make a separate post with a quick question about a round i tried... don't want to confuse my set w yours...
The reason the FR is truncated 200 to 2200 was because that was the range of the sweep in the measurement. That was taken very early on and I guess I was nervous about stressing the drivers or something. Were I to do it again, I would take the measurement full range. But if you look at my CD impulse inversion attempt, you see I picked up a lot "crap" out of band. Ultimately, I think we might want to do a smooth truncation of the measurement to the pass band of the driver (plus slopes) rather than the abrupt truncation you see here.
I apologize for not explaining the REW process better. I was pressed for time when I posted. So here goes.
So I want to invert the mid impulse. REW gives me only the AoverB calculation. For impulse inversion, I want A=1, in frequency response, that is. I went into RePhase and created a filter High pass at 1 Hz and low pass at 100,000 Hz and brought its IR into REW as the Flat to 100K curve, (actually a line). Then in the REW calculator, I created the impulse inversion filter which I named "Flat over mid = midInvert", which I hope makes sense now.
Next, I wanted to flatten the midresponse so I used REW to multiply the mid response by the inverted mid filter. That is the "flat over mid * mid" trace. Interesting that it has a negative spike where I believe the throat reflection null was. The truncations at 200 and 2000 are due to the original measurement limits.
The next two traces down are the mid pass band filter and the result of processing the flattened mid response with the pass band filter.
I don't think I showed it but if you multiple the "Flat over mid" by the mid pass band filter, you get a single filter that can be used in a crossover. I should take a look at that. I looked at the one for the CD and didn't like it and that makes it clear I should look at this one.
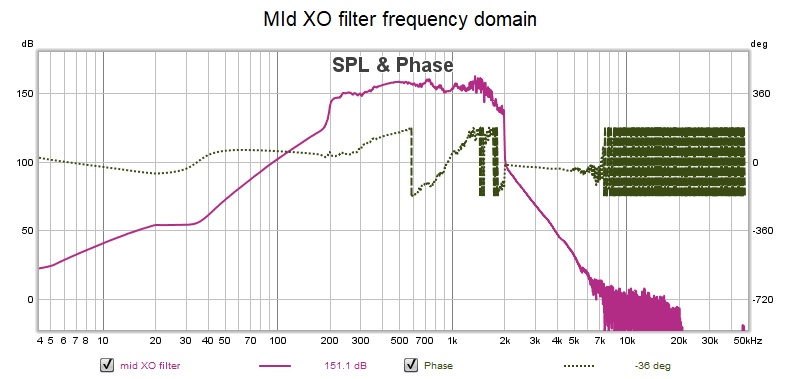
So the filter is relatively clean in band but gets detailed in the HF roll portion where the reflections we want to clean up occur. So maybe that is OK. At least its somewhat encouraging! Of course I can't actually use this filter because of the truncation in the measurement but the process is somewhat vailidated.
I apologize for not explaining the REW process better. I was pressed for time when I posted. So here goes.
So I want to invert the mid impulse. REW gives me only the AoverB calculation. For impulse inversion, I want A=1, in frequency response, that is. I went into RePhase and created a filter High pass at 1 Hz and low pass at 100,000 Hz and brought its IR into REW as the Flat to 100K curve, (actually a line). Then in the REW calculator, I created the impulse inversion filter which I named "Flat over mid = midInvert", which I hope makes sense now.
Next, I wanted to flatten the midresponse so I used REW to multiply the mid response by the inverted mid filter. That is the "flat over mid * mid" trace. Interesting that it has a negative spike where I believe the throat reflection null was. The truncations at 200 and 2000 are due to the original measurement limits.
The next two traces down are the mid pass band filter and the result of processing the flattened mid response with the pass band filter.
I don't think I showed it but if you multiple the "Flat over mid" by the mid pass band filter, you get a single filter that can be used in a crossover. I should take a look at that. I looked at the one for the CD and didn't like it and that makes it clear I should look at this one.
So the filter is relatively clean in band but gets detailed in the HF roll portion where the reflections we want to clean up occur. So maybe that is OK. At least its somewhat encouraging! Of course I can't actually use this filter because of the truncation in the measurement but the process is somewhat vailidated.
Attachments

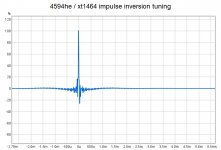
whoops, meant to post the IR
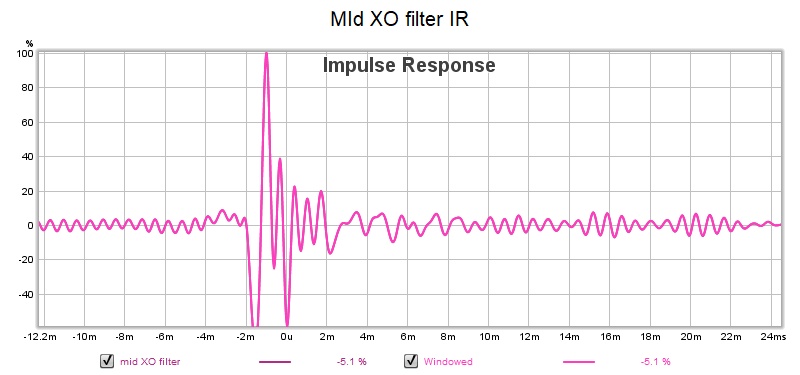
I'm suspicious of all the non-zero content in the filter IR past 8 ms.
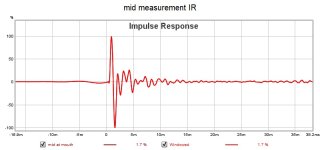
Let's look at the measurement IR:

Its quiets down more quickly but doesn't go completely silent. The horn is about 10" deep so even a round trip mouth reflection should long since be over by then. 1127'.sec or about 12" per ms.
This was an indoor measurement. I think I must have had room reflections coming back into the measurement. I'd love to see what we see in a set of clean outdoor measurements.
OTOH, frequency response ripples also could contribute to the IR being non-zero so perhaps we should IIR EQ the mid before doing these measurements so that (ideally) the only things we see in the IR beyond the initial dirac pulse are reflections
I'm suspicious of all the non-zero content in the filter IR past 8 ms.
Let's look at the measurement IR:
Its quiets down more quickly but doesn't go completely silent. The horn is about 10" deep so even a round trip mouth reflection should long since be over by then. 1127'.sec or about 12" per ms.
This was an indoor measurement. I think I must have had room reflections coming back into the measurement. I'd love to see what we see in a set of clean outdoor measurements.
OTOH, frequency response ripples also could contribute to the IR being non-zero so perhaps we should IIR EQ the mid before doing these measurements so that (ideally) the only things we see in the IR beyond the initial dirac pulse are reflections
Attachments

Ok, part two... decided to hold question untill I give time for answers in case it's repitive question once i understand...
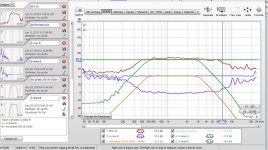
Below is set off mid driver following your lead...
Looking really good. Would like to see IRs of final filter and measurement in case something is hiding in there.
Any smoothing or windowing in the measurement?
and does it sound different or better !?!
Thx for the explanation...all makes sense.
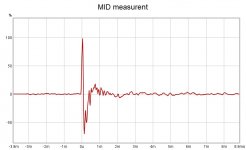
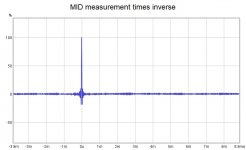
My flattish trace#4 is mid measurement times it's inverse.
Then 4 is multipied by imported xover 5, to get final filter 6 which I'll try when I get a chance to make a real acoustic measurement.
Oh, no widowing....1/12th smoothing
Impulses are:
1. measurement
2. measurement times inverse
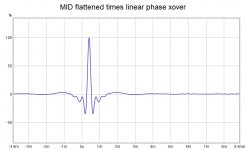
3. #2 times min phase crossover
4. #2 times linear phase crossover
Hey, I think we are on the edge of making a cheapo but excellent Fir generator!
My flattish trace#4 is mid measurement times it's inverse.
Then 4 is multipied by imported xover 5, to get final filter 6 which I'll try when I get a chance to make a real acoustic measurement.
Oh, no widowing....1/12th smoothing
Impulses are:
1. measurement
2. measurement times inverse
3. #2 times min phase crossover
4. #2 times linear phase crossover
Hey, I think we are on the edge of making a cheapo but excellent Fir generator!
Attachments

Last edited:
very nice. cleaner measurements make for cleaner inverse filters, just as expected.
Yep, just as we would expect.
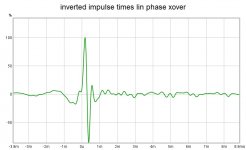
I was making a mistake earlier, about which impulse to try as filter for actual acoustic measurement correction. It was essentially a crossover-only impulse...
Here is the correct, inverted measurement-impulse times xover...
Now, my big question is: how do I actually turn this impulse into a FIR file?
Attachments
what a great question! I wish I had a more definitive answer.
In REW, you can export the IR.wav or IR.txt, which should work; has to be tried. The export dialog leaves sample rate and number of taps open. My test export had the same 96 khz sample rate used in my measurement and linear phase filter. I didn't count the number of taps I got by default without setting an IR window but I had imported another IR export into a spreadsheet and it had 65K taps.
If you set an IR window and check the box to apply it before export, you should be able to get a desired number of taps according to
WindowWidthInSecs = DesiredNumTaps / samplesPerSec
Set the window to -WW/2 to +ww/2 for a near centered window, might be off by window Ref time.
Hopefully, that will work for you.
Jack, awesome help ! Thank you !! It works !😀😀😀
Bottom left is the driver measurement's raw response converted to a Fir file.
Bottom right is the inverse impulse of that measurement times an LR8 xover both sides.
Center top, the Responsalyzer, is a dual channel FFT showing the total response of the two FIR filters passing audio in series.
Mag is obviously green, phase purple, and gold is coherence.
It looks excellent !
Note a time delay of 0.131ms.... I had to insert that into the series flow to get phase flat.
And it was the exact time difference between REW's Window Ref Times boxes.
(the IR window boxes you pointed me to to set Fir length.)
I used rectangular windows per REW Help, and 43ms left and right...about 4200 taps at 48kHz.
Attachments
Thanks to nc535's showing me how to use REW to make FIR files that include driver corrections and xovers,
I decided to see how it actually works tuning a speaker.
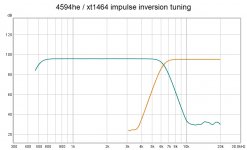
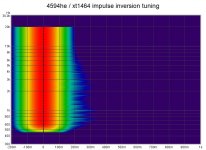
So I took my trusty, well known bms4594he / xt1464 modular box and stuck a mic a foot from the mouth, indoors.
Made raw measurements of both CD sections using full-spectrum sweeps, to be able to invert the entire spectrum. (gotta love prosound CD's that you can sweep at 94dB with no worry of over-excursion, huh?)
Then, for each section, I made a measurement-impulse inverse by dividing a perfect flat line response by the measurement.
Then took that impulse inverse and multiplied it by a crossover, generated via rePhase. (HF got a LR16 HP @ 500Hz & LR16LP @ 6300Hz. VHF got a complementary HP.)
That becomes the final impulse to export into a FIR file.
I've repeated all this from prior posts in simple steps, in case it helps make it clearer.
The big trick is to export the impulse in a fashion the FIR processor can use. Check out nc535's post #150 for how.
(I used wav files throughout as my processor accepts FIR those.)
Anyway, took acoustic measurements of each driver section alone, and then both combined ...and immediately saw how how well this method works.
It's correction to a spot, and obviously judgement still needs to be applied by checking polars etc...
but the measurements kinda speak for themselves i think, in terms on the efficacy of the technique.
It's really a very straightforward easy process imo/ime.
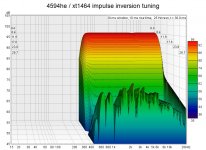
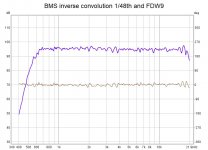
1/48th smoothing, no windowing or gating.
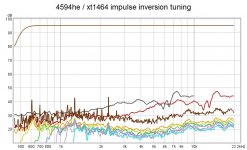
I threw in a harmonic distortion graph in case of interest in the bms/xt1464 combo.
I decided to see how it actually works tuning a speaker.
So I took my trusty, well known bms4594he / xt1464 modular box and stuck a mic a foot from the mouth, indoors.
Made raw measurements of both CD sections using full-spectrum sweeps, to be able to invert the entire spectrum. (gotta love prosound CD's that you can sweep at 94dB with no worry of over-excursion, huh?)
Then, for each section, I made a measurement-impulse inverse by dividing a perfect flat line response by the measurement.
Then took that impulse inverse and multiplied it by a crossover, generated via rePhase. (HF got a LR16 HP @ 500Hz & LR16LP @ 6300Hz. VHF got a complementary HP.)
That becomes the final impulse to export into a FIR file.
I've repeated all this from prior posts in simple steps, in case it helps make it clearer.
The big trick is to export the impulse in a fashion the FIR processor can use. Check out nc535's post #150 for how.
(I used wav files throughout as my processor accepts FIR those.)
Anyway, took acoustic measurements of each driver section alone, and then both combined ...and immediately saw how how well this method works.
It's correction to a spot, and obviously judgement still needs to be applied by checking polars etc...
but the measurements kinda speak for themselves i think, in terms on the efficacy of the technique.
It's really a very straightforward easy process imo/ime.
1/48th smoothing, no windowing or gating.
I threw in a harmonic distortion graph in case of interest in the bms/xt1464 combo.
Attachments
Those charts could hardly be better. Yes, they speak for themselves. perhaps they've rendered others speachless.
I'm not sure if the single point measurement is as big a concern as it would be further out in the room, especially not with a waveguide whose directivity is as constant as the XT1464. Polars will tell
Happy New Year!
I'm not sure if the single point measurement is as big a concern as it would be further out in the room, especially not with a waveguide whose directivity is as constant as the XT1464. Polars will tell
Happy New Year!
Happy New Year indeed !
I've never seen that degree of precise acoustic response in the maybe 1000 FIR files I've built over the last 4 years.
Part may be due to the close mic distance, which are measurements i almost never make, but i think much of the precision is probably due to the end-to-end pre-flattening a full spectrum inverse applies to the measurement.
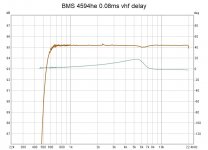
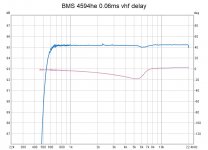
The two SPL/Phase graphs below are identical other than 1 sample, 0.02ms, timing difference between the HF and VHF sections of the coax CD (crossed at 6.3kHz).
Look how the phase blips up, then down due to just the 1 sample....like said, I've never encountered such precise response reaction at anything say below 19-20kHz....
A couple of other cool things about using REW for this i've found...
First, no timing reference was involved...heck, I hadn't used REW in a while and didn't realize I had neither acoustic or loopback in place.
I just clicked the Time Align button in the REW Trace Arithmetic Control box before hitting Generate.
How easy is that for time alignment !!
Second, I tried applying FDW in the IR Windows box at the same time doing the window sizes left and right for FIR export.
This worked great at mitigating the potential minute over-corrections.
For example, the last SPL/Phase graph is with FDW9 applied
About the only thing I'm still unsure of in the process is levels....how they act through trace arithmetic, and the import of rephase crossovers...
I'm definitely going to keep playing with this....
I've never seen that degree of precise acoustic response in the maybe 1000 FIR files I've built over the last 4 years.
Part may be due to the close mic distance, which are measurements i almost never make, but i think much of the precision is probably due to the end-to-end pre-flattening a full spectrum inverse applies to the measurement.
The two SPL/Phase graphs below are identical other than 1 sample, 0.02ms, timing difference between the HF and VHF sections of the coax CD (crossed at 6.3kHz).
Look how the phase blips up, then down due to just the 1 sample....like said, I've never encountered such precise response reaction at anything say below 19-20kHz....
A couple of other cool things about using REW for this i've found...
First, no timing reference was involved...heck, I hadn't used REW in a while and didn't realize I had neither acoustic or loopback in place.
I just clicked the Time Align button in the REW Trace Arithmetic Control box before hitting Generate.
How easy is that for time alignment !!
Second, I tried applying FDW in the IR Windows box at the same time doing the window sizes left and right for FIR export.
This worked great at mitigating the potential minute over-corrections.
For example, the last SPL/Phase graph is with FDW9 applied
About the only thing I'm still unsure of in the process is levels....how they act through trace arithmetic, and the import of rephase crossovers...
I'm definitely going to keep playing with this....
Attachments
Yeah, cool tangible progress!🙂 Please keep us posted how it sounds. Full polars before / after would be cool etc. Happy new year!
Thank you tmuikki, and Happy New Year back !
And yeah, nc535, too polar outside for polars Lol
Hey, tmuikki...i followed your lead today and did some clothes-closet measuring ...😀
wanted to do some apples to apples harmonic distortion tests..dcx vs bms
Will post on dcx464 thread tomorrow..
And yeah, nc535, too polar outside for polars Lol
Hey, tmuikki...i followed your lead today and did some clothes-closet measuring ...😀
wanted to do some apples to apples harmonic distortion tests..dcx vs bms
Will post on dcx464 thread tomorrow..
- Home
- Loudspeakers
- Multi-Way
- Measuring horn reflections back into the throat