The fact that there is a large swing in measured phase means nothing in relation to whether or not the driver is minimum-phase. If the SPL magnitude is making wild swings, so will the phase, that's to be expected. Explain why you believe that a large swing in phase is proof of the driver not being minimum-phase?
Dave
Dave
Hello Oliver
...
Worse in what way??
...
Rob🙂
In phase response being more scattered ...
Somewhat different context, but maybe this will help: Minimum Phase.could you add some verbose comment on how to interpret that plot ?
Here is the excess group delay plot for that wave file, the response is minimum phase in regions where the excess GD is flat.
View attachment 180072
I'd be careful with this as well.
Since group delay requires calculating the slope of the phase curve, you will run into high numerical errors where phase necessarily cycles from one side of the graph to the other. Also where the phase curve is "spikey". I don't think it defines minimum phase regions.
A little bit of phase curve smoothing before calculation is not a bad thing.
David
Anyone read Sean Olive's recent blog?
Audio Musings by Sean Olive: Why Live-versus-Recorded Listening Tests Don't Work
I always enjoy reading that audiophiles believe they can recreate the live recording in room. Nothing better then an incredible imagination at work 😀
Audio Musings by Sean Olive: Why Live-versus-Recorded Listening Tests Don't Work
I always enjoy reading that audiophiles believe they can recreate the live recording in room. Nothing better then an incredible imagination at work 😀
How did you extract the data from the measured phase and determine that is indeed the excess-phase? The only way to do it is to know or determine the true minimum-phase. That, of course, assumes that the SPL response is a minimum-phase response.Here is the excess group delay plot for that wave file, the response is minimum phase in regions where the excess GD is flat.
View attachment 180072
Minimum-phase can only be generated, not measured and certainly you only have a measured response that includes excess-phase. To generate the minimum-phase response, one must use the HBT that requires that, as pointed out, the device be minimum-phase. There's something of a conundrum here.
Edit: I would use this method, but speaker dave's point above is valid if one uses that method.
Dave
Last edited:
...
A little bit of phase curve smoothing before calculation is not a bad thing.
...
David
Hello David,
what kind of smoothing would you recommend for meaningful results ?
I mean as your personal "rule of thumb" ...
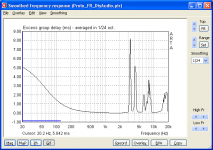
There's quite a bit of comb filtering in that measurement, so I've included a plot with smoothing as well as unsmoothed. Spans are as before, but I've offset the GD zero axis from the graph centre. The data below 40Hz is meaningless as the speaker has no output to speak of from there down.Maybe someone wants to analyse excess time with this one,
it is a 2-way with XO about 1Khz, 5" alu cone and ribbon tweeter.
Visaton AL 130 is one of the woofers having very good IR and
it is a fairly well damped enclosure.


I unwrap the phase first (which has its own challenges of course, but is quite robust when proper care is taken). I disagree regarding the spikiness comment, since anywhere the response has a high Q resonance there will corresponding rapid phase changes (roughly speaking from +90 before to -90 after), but they are nonetheless minimum phase. Sharp positive changes in phase, however, correspond to sharp dips or nulls which more often than not are not minimum phase regions.I'd be careful with this as well.
Since group delay requires calculating the slope of the phase curve, you will run into high numerical errors where phase necessarily cycles from one side of the graph to the other. Also where the phase curve is "spikey". I don't think it defines minimum phase regions.
Thank you very much John,
especially in the second graph i can relate the peaks to
frequencies, where "something is going on" in that speaker.
Quite nice !
especially in the second graph i can relate the peaks to
frequencies, where "something is going on" in that speaker.
Quite nice !
Last edited:
There is no need to make an assumption in determining the minimum phase response, any given amplitude response has a corresponding minimum phase response which can be calculated as has been previously discussed on this thread. The difference between the measured phase and the calculated minimum phase is the excess phase (which would include time delays).How did you extract the data from the measured phase and determine that is indeed the excess-phase? The only way to do it is to know or determine the true minimum-phase. That, of course, assumes that the SPL response is a minimum-phase response.
I went to the link provided at HomeTheaterShack. This detail, just before their curve that purports to show the excess group delay states:I'd be careful with this as well.
Since group delay requires calculating the slope of the phase curve, you will run into high numerical errors where phase necessarily cycles from one side of the graph to the other. Also where the phase curve is "spikey". I don't think it defines minimum phase regions.
A little bit of phase curve smoothing before calculation is not a bad thing.
David
That gets us a bit closer, we can be sure that the places where there are particularly wild swings in group delay are not minimum phase, but it still doesn't let us easily identify the minimum phase regions. To do that, we need to produce a minimum phase version of the measurement and look at the excess group delay. The minimum phase response is generated by using the measurement amplitude and calculating the corresponding minimum phase from it, using a mathematical relationship between the two that holds for minimum phase systems. By looking at the difference between the measured and minimum phase (the excess phase) and measuring the slope of that difference to find the excess group delay, we get this plot:
So the reference provided has the requirement that the device by minimum-phase. The response posted for excess-phase does not support the claims.
Dave
You are misunderstanding the passage Dave (for which I apologise, since I wrote it 🙂). To find the excess phase, first we need to know what a minimum phase response would look like. That does not mean we are assuming the response or the system is minimum phase, quite the opposite - if it were the excess phase would be zero everywhere. Rather we want to know what phase response a minimum phase system, which has the same amplitude response as our measured system, would have. Then we can compare that with the system we have measured and see whether (or where) it is minimum phase.
How do you handle the sample point issue? Is you software using precisely the same data points, that is, is there any interpolation occurring? How do you handle the stop-band area since the data will be limited? This, of course, assumes that the the original data is accurate at all points.You are misunderstanding the passage Dave (for which I apologise, since I wrote it 🙂). To find the excess phase, first we need to know what a minimum phase response would look like. That does not mean we are assuming the response or the system is minimum phase, quite the opposite - if it were the excess phase would be zero everywhere. Rather we want to know what phase response a minimum phase system, which has the same amplitude response as our measured system, would have. Then we can compare that with the system we have measured and see whether (or where) it is minimum phase.
Dave
I believe it is pretty clear there are, for any given driver, regions (pass bands) which are minimum phase and regions which are discontinuous. Discontinuities are not minimum phase because the input cannot be determined from the output. A few people just are not going to accept this reality. Those same people also will not do the two tone test to validate their own data.
As for software, I have tested and attempted validation of many softwares against positively known standards. I have only found two which work correctly and one test machine system that works correctly. That test machine can be fooled if the limits of the testing method are exceeded. ALMOST ALL software does not work correctly for measurement of time or phase as used with microphones and speakers. CLEO is certainly one that failed even simple test as so many other have.
As for software, I have tested and attempted validation of many softwares against positively known standards. I have only found two which work correctly and one test machine system that works correctly. That test machine can be fooled if the limits of the testing method are exceeded. ALMOST ALL software does not work correctly for measurement of time or phase as used with microphones and speakers. CLEO is certainly one that failed even simple test as so many other have.
Anyone read Sean Olive's recent blog?
Audio Musings by Sean Olive: Why Live-versus-Recorded Listening Tests Don't Work
I always enjoy reading that audiophiles believe they can recreate the live recording in room. Nothing better then an incredible imagination at work 😀
It's funny, but the premise for that particular blog - that:
"..In practice, these tests are usually ridden with so many uncontrolled listening test nuisance variables that the results are essentially meaningless."
-Is what I'd argue for 99.99% of various subjective testing I've seen.. including his. 😱
That's not to say that the tests haven't become far more controlled than what is being ridiculed in that blog, but rather not nearly controlled enough.. or at least not controlled enough for the broad conclusions being made.
I'll make a guess here and assume you are referring to the frequency resolution of the measurement. The basic answer is to zero-extend the analysed segment of time data so that it is long enough to give the required resolution, though "long enough" is rather ill-defined. In the case of measurements from which phase and group delay information are required it is necessary to ensure the phase change between samples is not more than 180 degrees, otherwise there is ambiguity when unwrapping - however, group delay can be calculated without phase unwrapping using FFT of time-ramped input sequences, so if unwrapped phase is not needed shorter sequences could be analysed without error at the sample points. I use phase unwrapping in my software.How do you handle the sample point issue?
I interpolate during graph plotting for better appearance, though there is also the option to show the sample points when zoomed in sufficiently to resolve them. There is no interpolation in the calculations.Is you software using precisely the same data points, that is, is there any interpolation occurring?
The quality of the derived data depends on the signal-to-noise of the measurement, in regions where the measurement is mostly (or entirely) noise, the results will not be meaningful.How do you handle the stop-band area since the data will be limited?
All measurements are subject to limitations in their accuracy, ask Heisenberg 😀This, of course, assumes that the the original data is accurate at all points.
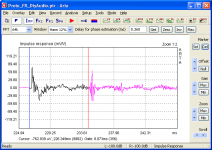
Wow Oliver, that first wav you posted is one wild impulse response. 🙂 Lots of reflections going on. Gating to 8 ms gets rid of the worst of the reflections but sacrifices resolution down low. It looks pretty minimum phase below 3K but I don't know what's going on above there. Ungated, I get something similar to John for the excess group delay.
Attachments

How respectable is HolmImpulse in your opinion ?
Not tested, sorry.
- Status
- Not open for further replies.
- Home
- Loudspeakers
- Multi-Way
- Measurements: When, What, How, Why