Have any measurements??
I have never seen that. Are you talking in break-up mode above the useable bandwidth?? Here's a 10" 2122 midrange driver. Looks fine to me. Where would the transition zone be in that driver?
Rob🙂
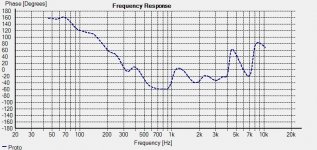
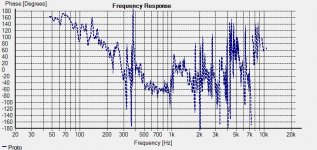
Attached a phase plot for a bending wave transducer with 1/N
octave smoothing. N is denoted in the picture name.
Every loudspeaker is a bending wave transducer, just most
drivers aren't quite aware of it.
Is your phase plot unsmoothed ?
Attachments
Have any measurements??
I have never seen that. Are you talking in break-up mode above the useable bandwidth?? Here's a 10" 2122 midrange driver. Looks fine to me. Where would the transition zone be in that driver?
Rob🙂
Have recently posted a link. Here it is again:
http://www.diyaudio.com/forums/multi-way/161627-horn-honk-wanted-68.html#post2160891
I can tell by looking at your graph the excess time value is incorrect. As I recall, Vance Dickinson already showed CLIO does not measure or compute time correctly at an ALMA meeting. I have never ever seen a driver with phase response even remotely similar to what your graph shows which suggest the conclusion of faulty method or data.
Because the test using two tone or multi-tone method are well established and very rudimentary and does not require much equipment therefore I suggest you measure your 10" using that method and plot the point by point results. This removes all questions of software or excess time errors. The result will be an accurate phase plot. Would further suggest using at least 24 points per octave. Know this will take a few minutes but that is all and then you will know for sure. I will not argue with the two tone results as there are no assumptions other than the microphone and electronics are minimum phase which is a reasonable assumption based on quality test microphones and electronics.
🙂=SUM
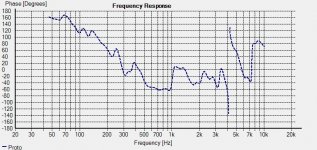
Look at that! LineArray post a graph with N=48 and look there, phase changes through 360 degrees about 370Hz. N=6 is the happy marketing graph!
I remember in the old days some companies would post a "marketing" graph based on 1 octave analysis- 10 data points and lots of smoothing. HAHAHA junk data.
Thank you line array!
I remember in the old days some companies would post a "marketing" graph based on 1 octave analysis- 10 data points and lots of smoothing. HAHAHA junk data.
Thank you line array!
Last edited:
If you try measuring starting from near field do far field, you will find that the response is different, and the diffraction effects are different as well. If one were trying to design XO, one would choose only one measurement as the main reference even though the system is not minimum phase, it is referenced as minimum phase for that design point. Now, if one were trying to find ways to minimize diffraction and improve other aspects of driver radiation pattern, one cannot use one single point measurement and consider it a reference. Sorry if you cannot understand this.🙄You think wrongly, I understand it rather well, thank you. Diffraction of baffles is a concern to anyone unless you are working with horns/waveguides. Why anyone would "accept that diffraction is of no concern to you" is, in any case, sidestepping the debate. It fails to address the point raised, that being that measurements of typical drivers on a baffle will by default include diffraction, if you're going to acquire a usable bandwidth and that this response is M-P. The diffraction time delays are simply too short to remove it and still have a usable bandwith, the result will not differ "slightly". What you are saying to do is nonsense.
Dave
Good effort at avoiding addressing the point made. Using straw man arguments, diversionary tactics and rolling eyes doesn't do it.If you try measuring starting from near field do far field, you will find that the response is different, and the diffraction effects are different as well. If one were trying to design XO, one would choose only one measurement as the main reference even though the system is not minimum phase, it is referenced as minimum phase for that design point. Now, if one were trying to find ways to minimize diffraction and improve other aspects of driver radiation pattern, one cannot use one single point measurement and consider it a reference. Sorry if you cannot understand this.🙄
Dave
I recall that some earlier version of CLIO had sampling rate problems, wonder whether it was caused by that....
I can tell by looking at your graph the excess time value is incorrect. As I recall, Vance Dickinson already showed CLIO does not measure or compute time correctly at an ALMA meeting. I have never ever seen a driver with phase response even remotely similar to what your graph shows which suggest the conclusion of faulty method or data.
...
🙂=SUM
If such personal attacks are the best you can do... what can I say.😕Good effort at avoiding addressing the point made. Using straw man arguments, diversionary tactics and rolling eyes doesn't do it.
Dave
They weren't personal attacks, they were accurate descriptions of your comments. You have not addressed the point, not once.If such personal attacks are the best you can do... what can I say.😕
As for personal attacks, maybe you should re-consider statements such as "If you still don't understand, I really don't know how to explain it in simpler terms." You haven't been saying anything I don't already know.
But back to the point. I'll re-post it to prevent confusion on the point:
Any time that you measure with SoundEasy and create a driver model to match the measured phase (if you've ever done that, try it if not), the result is the M-P of the response including all diffraction with some specified amount of excess-phase.
Accept or refute with supporting arguments, you seem very sure of your position on the nature of measurements with diffraction.
Dave
Last edited:
Oliver, could you post the magnitude response? The 1/48 phase curve certainly looks nasty but I suspect the magnitude response would be equally ugly. It could still be a (mostly) minimum phase system. Better yet, can you export the impulse as a 16-bit wav? I could take a look at the excess phase in ARTA.Attached a phase plot for a bending wave transducer with 1/N
octave smoothing. N is denoted in the picture name.
Every loudspeaker is a bending wave transducer, just most
drivers aren't quite aware of it.
Is your phase plot unsmoothed ?
Oliver, could you post the magnitude response? The 1/48 phase curve certainly looks nasty but I suspect the magnitude response would be equally ugly. It could still be a (mostly) minimum phase system. Better yet, can you export the impulse as a 16-bit wav? I could take a look at the excess phase in ARTA.
Here we are N=48 ... can i attach .wav files in here?
Attachments
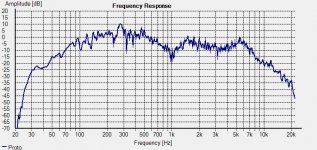
Dennis: I did NOT normalize magnitude. If you need that, i will
post a new version.
Have fun.
post a new version.
Have fun.
Attachments
Last edited:
Have recently posted a link. Here it is again:
http://www.diyaudio.com/forums/multi-way/161627-horn-honk-wanted-68.html#post2160891
🙂=SUM
It looks like you are ascribing some significance to whether the phase on a graph is in the positive side or the negative side.
Most drivers end up being a bandpass and as such the phase will lead at the LF end and lag at the HF end, assuming you have zeroed out the airpath delay just right.
Is the transition from + to - significant?
David
Hello Oliver
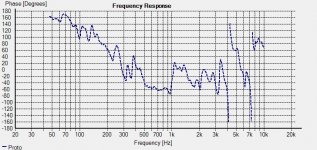
Here's the same measurement unsmoothed?? I see "flips" if I use wrapped phase option but typically out of the drivers passbands and of course there has to be enough phase change/rotation to wrap the trace. This graph is derived using the minimum phase option in CLIO. It was measured close in about 6-10 inches off the dome.
Rob🙂
Attachments
Last edited:
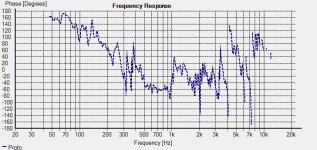
Here is the excess group delay plot for that wave file, the response is minimum phase in regions where the excess GD is flat.

Hello Oliver
Here's the same measurement unsmoothed.
Rob🙂
Thank you for posting rob,
please do not take it personally, but knowing this being a 10" driver
i have some doubts concerning the resolution/reality of that plot.
I can post measurements of very well acknowledged 5" drivers looking
much worse.
You may claim that this driver you have got is a "wonder driver", but
up to now i have seen only few wonders in my life. None of them
was in audio.
But i have seen lots of bad software.
Here is the excess group delay plot for that wave file, the response is minimum phase in regions where the excess GD is flat.
View attachment 180072
Thank you John,
could you add some verbose comment on how to interpret that plot ?
e.g. in comparison with other plots you may have seen so far ?
Last edited:
It looks like you are ascribing some significance to whether the phase on a graph is in the positive side or the negative side.
Most drivers end up being a bandpass and as such the phase will lead at the LF end and lag at the HF end, assuming you have zeroed out the airpath delay just right.
Is the transition from + to - significant?
David
Positive or negative phase in one pass band is not to important as that may be dealt with simply by reversal of the leads. When a driver transitions from + to - the transition area is useless acoustic information. Also now, imagine trying to design a crossover where the phase of the driver inverts anywhere near the crossover point. Steep FIR filters can do this but no IIR filter can. Drivers used here like on the graph on the right in the post are only used over one pass band which is of constant phase. This, through lots of casual testing, seems to give the most satisfying results to the most listeners. This is why "phase" is on the list of 5 very important things to consider when designing a loudspeaker earlier in this thread.
Here is the excess group delay plot for that wave file, the response is minimum phase in regions where the excess GD is flat.
View attachment 180072
Beautiful graph! So many regions the driver misbehaves and as anything but minimum phase over the entire energy band. Thank you JohnPM!
In the end this assumption of minimum phase is at best a first approximation to the reality of drivers. Any closer inspection shows excess time or non-continuous transfer functions of drivers is the result. Making drivers with a single wide pass band of a single phase seems to me to be the goal. This is why most drivers here are custom made. One decade of constant (minimum) phase so far has been about the limit. That means at least a three way!
Last edited:
I can post measurements of very well acknowledged 5" drivers looking
much worse.
Hello Oliver
Worse in what way?? I don't see how it's a wonder driver?? It's a 10" Pro midrange driver that looks typical to me as far as the FR is concerned. It's looks very similar to the measured response graph we have for it over on Lansing Heritage. It was used in the JBL 4344/4345 monitors from 300Hz to 1.2K where it's very flat.
But i have seen lots of bad software.
I doubt my software is bad. If it is it's darn consistent and works just fine with any Crossover Software I have used it with.
Rob🙂
- Status
- Not open for further replies.
- Home
- Loudspeakers
- Multi-Way
- Measurements: When, What, How, Why