i was commenting on the low end responce,but it was already answered.
i stil think there is a low pass in place or maybe the mic or something else ,it just doesn't seem right.
I am doing more tests today. See what I can figure out.
I also wondered about the mic. Old (80's) Peavey PVR1. Used with the Peavey Autograph RTA EQ. Looked at the docs and it specs 40hz to 20khz. 😱 Perhaps they aren't kidding. Graph just ends at 45hz, so maybe it drops sharp after that? IDK. I have 2 (barely used) and they are identical in response, although level is slightly less on one.........maybe time for EMM-6.
Ok, tried some more measurements..... looked everywhere for an HPF filter and just can't find one engaged!
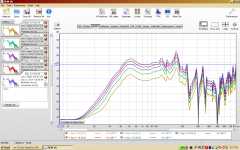
1 KS – 1 meter on axis – PVR1 laying flat on ground – M Audio MobilePre USB – Crown CE4000.
Round 1 -0Hz to 10khz - started with 2.8v, then 4.75v, 6.65v, 8.65v, 10.5v.....kept clicking the input up on the amp a few at a time.
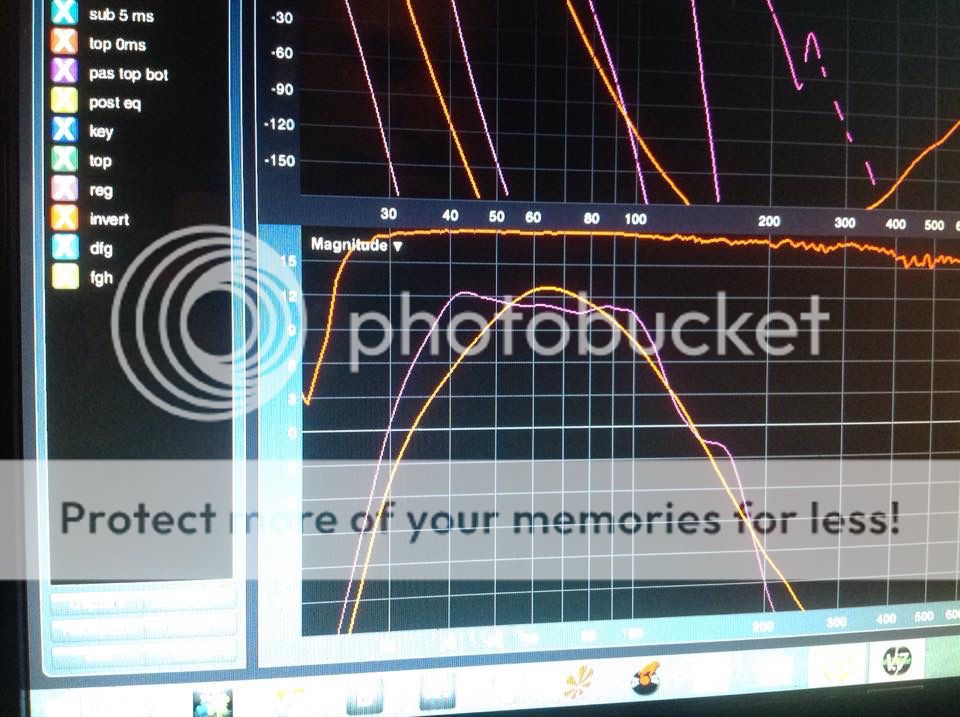
Round 2 - now I have 30hz HPF engaged and limited sweep to 25hz starting with gold at 13.8v, green at 17.75v, and purple at 23.5v.
Red sweep is at 31v limited 30hz to 250hz and the last sweep is blue at 34.5 volts.
I did not care to try any higher as it was sounding stressed.
1 KS – 1 meter on axis – PVR1 laying flat on ground – M Audio MobilePre USB – Crown CE4000.
Round 1 -0Hz to 10khz - started with 2.8v, then 4.75v, 6.65v, 8.65v, 10.5v.....kept clicking the input up on the amp a few at a time.
Round 2 - now I have 30hz HPF engaged and limited sweep to 25hz starting with gold at 13.8v, green at 17.75v, and purple at 23.5v.
Red sweep is at 31v limited 30hz to 250hz and the last sweep is blue at 34.5 volts.
I did not care to try any higher as it was sounding stressed.
Attachments

The test mic is probably responsible for some of the LF rolloff- the mic that came with my Teresonde Audio toolbox is -5 dB at 40 Hz, -8 dB at 30 Hz.Ok, tried some more measurements..... looked everywhere for an HPF filter and just can't find one engaged!
Round 2 - now I have 30hz HPF engaged and limited sweep to 25hz starting with gold at 13.8v, green at 17.75v, and purple at 23.5v.
Red sweep is at 31v limited 30hz to 250hz and the last sweep is blue at 34.5 volts.
I did not care to try any higher as it was sounding stressed.
Appears to be power compression going on even at 34.5V.
34.5v is (about 149 watts) is a little more than 3 dB above 23.5V(about 69 watts), but the chart shows quite a bit less than a 3 dB change.
You could get about 10 dB more clean output level from the B&C 18SW115-4, I did sine wave testing at 77.5 volts, about 1500 watts into the four ohm speaker.
Art
Ok, tried some more measurements..... looked everywhere for an HPF filter and just can't find one engaged!
1 KS – 1 meter on axis – PVR1 laying flat on ground – M Audio MobilePre USB – Crown CE4000.
Round 1 -0Hz to 10khz - started with 2.8v, then 4.75v, 6.65v, 8.65v, 10.5v.....kept clicking the input up on the amp a few at a time.
Round 2 - now I have 30hz HPF engaged and limited sweep to 25hz starting with gold at 13.8v, green at 17.75v, and purple at 23.5v.
Red sweep is at 31v limited 30hz to 250hz and the last sweep is blue at 34.5 volts.
I did not care to try any higher as it was sounding stressed.
Wish I could edit my old post..........all the voltages are a little off. To correct at least the second set it should read gold at 16v, green at 19v, purple at 25v, red at 32.5v, and blue at 36.5v.
Attachments
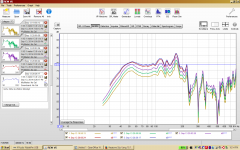
Same test with one BR 2x18 w/Low Riders. Same rig and distance. Measured voltage across amp output at 60hz signwave. Stimulus is a sign log sweep from 25 to 250. 30hz HPF engaged.
11 v, 14 v, 21.5 v, and 26 v.
So above 22v quickly diminishing returns. Compared to KS where it's good til about about 32v.
Next have to replace old dead RatShack db meter and see what kind of spl this is yeilding.
11 v, 14 v, 21.5 v, and 26 v.
So above 22v quickly diminishing returns. Compared to KS where it's good til about about 32v.
Next have to replace old dead RatShack db meter and see what kind of spl this is yeilding.
Attachments
Fairly large differences between BR and TH, thanks for the test results!So above 22v quickly diminishing returns. Compared to KS where it's good til about about 32v.
Next have to replace old dead RatShack db meter and see what kind of spl this is yeilding.
No, tried that, it reduced LF output and did not improve upper output.Would there be any benefit to adding a reflector near the exit?
Reflectors reduce volume. You would have to increase the size of the enclosure to get the same modeled response.
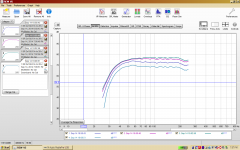
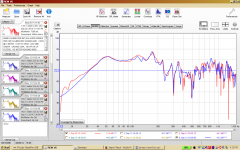
So..........wondering about the low end roll off I keep seeing in measurements of my Keystone TH w/ LowRider18. This is the comparison after recalibrating the sound card and using a different mic.
Testing one KS tapped horn with LowRider 18 driver.
2.83V @ 1 Meter. 0 HZ TO 5KHZ. Log Sine Sweep.
No HP Or LP filters.
R.E.W. (Room EQ Wizzard) software.
M-Audio Mobile Pre USB calibrated soundcard.
Crown CE4K power amp.
Measured 90db spl with RS Digital 2055 meter, 60hz sine wave and shaped pink noise.
Dayton EMM6 calibrated mic. Red trace.
Peavey PVR-1 non calibrated. Blue trace.
Thoughts ?
Attachments
I think if your meter is reading 90 dB with 2.83 v input at 60 Hz, it is reading low. The Low Rider 18 is about 96 dB 1w 1 meter in a BR cabinet, and should be a bit more sensitive than that in the Keystone.
The RS meter does not read straight SPL, it reads "A" & "C" scale. If you happened to have it set on "A", (which rolls off response below 1000 Hz) it would read low.
The RS meter does not read straight SPL, it reads "A" & "C" scale. If you happened to have it set on "A", (which rolls off response below 1000 Hz) it would read low.
.........I think if your meter is reading 90 dB with 2.83 v input at 60 Hz, it is reading low. ......... If you happened to have it set on "A", (which rolls off response below 1000 Hz) it would read low.
It was set on "C". Hmmmmm. Are their any DIY tricks to create a known SPL with reasonable certainty? I am a little suspicious of any LowRider #s at this point.
How about the graph? Does the low roll off look more like what you expected or still not really?
apparently the measurement isn,t far off in post 350
its look like the low rider prefoms verry poor in the keystone,as is
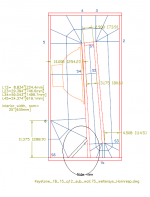
you van try a smaller/lower mouth,wich can be done easely wit the keystone.
its look like the low rider prefoms verry poor in the keystone,as is
you van try a smaller/lower mouth,wich can be done easely wit the keystone.
1) You can measure a commercial cabinet that has a published frequency response and compare it to yours.1)Are their any DIY tricks to create a known SPL with reasonable certainty?
How about the graph?
2)Does the low roll off look more like what you expected or still not really?
2) The roll off looks identical to your last tests, other than you changed the vertical scale. The VLF difference might just be wind noise, the two mics look pretty close in response other than that, and some upper deviation that could be due to minor location differences, or using a different cabinet.
As EPA suggests, you can try progressively covering the upper portion of the Keystone exit and see if that works to extend LF response without taking too much of a hit in the rest of the range.
looks to me like the LowRider18 doesn't offer much below 40hz no matter which cab I have it in...........
1) You can measure a commercial cabinet that has a published frequency response and compare it to yours.....
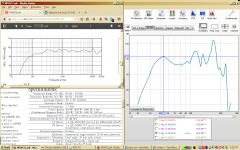
Trying to get an idea of actual SPL from my KS TH with Peavey LR18 driver. What a can of worms. Since I have only cheap db meter - I tested it against another speaker with published data. JBL MRX512m. Saw a LOT of variation in readings – in fact trying to measure the overall sensitivity of the JBL (which is published at 97db) with shaped pink noise I read a huge discrepancy - meter showed 105db! Some freqs were close – but most were way way off.???
Anyway...at least the meter seemed to agree with JBL data very close from 80 to 100hz, sine wave, 2.85v, 1 meter....so measuring KS at those freqs and offsetting response graph gives me a max sensitivity in the useful range of almost 96db at 54hz. -3db at 43hz. -10db at34hz.
note: the latest published sensitivity on Peavey website for LR18 is 93.7db.
Attachments
Peavey :: 18" Low Rider Subwoofer
Efficiency vs SPL? Both are 1w/1m.
Thanks for posting. Learning lots!
Efficiency vs SPL? Both are 1w/1m.
Thanks for posting. Learning lots!
As we have already found out, there are many different iterations of the LowRider, the published sensitivity used to be around 97 dB, appears yours may be closer to the current sensitivity.Since I have only cheap db meter - I tested it against another speaker with published data. JBL MRX512m. Saw a LOT of variation in readings – in fact trying to measure the overall sensitivity of the JBL (which is published at 97db) with shaped pink noise I read a huge discrepancy - meter showed 105db! Some freqs were close – but most were way way off.???
note: the latest published sensitivity on Peavey website for LR18 is 93.7db.
The MRX512m, being a full range product, may be tested full space and half space, then the graphs "joined".
You could get a better idea of your dB meter's accuracy testing one of the JBL subs ground plane, with pink noise. See if the curves look similar, if they do, use sine waves at various frequencies using 2.83 volts (or 2 volts if you are comparing a four ohm cabinet) and see if your dB meter corresponds to the JBL chart at the particular frequency tested. If the meter reads consistently lower, you can just make a note of the discrepancy and add it to your test figures, or calibrate to it.
Got a chance to play around with the keystone. This old sub vs keystone no eq on either just crossover.
Got a chance to play around with the keystone. This old sub vs keystone no eq on either just crossover.
What driver is that?
- Home
- Loudspeakers
- Subwoofers
- Keystone Sub Using 18, 15, & 12 Inch Speakers