You know, I've missed mixes enough by nitpicking over details and missing out on the essential to be even more suspicious about myself than many others.I don't trust them enough to make a habit of giving my subjective opinions of what I hear, I know how fickle it is from my personal experience. Unfortunately, it also means I'm very dubious when other people give their subjective opinions
But listening on a system to different music, in different states of attention, for weeks, does not deceive.
So, I try to read the others with the appropriate filters. Do they listen to the same kind of music as themselves, focus their attention on the same details, are they similarly equipped, can they be influenced by audiophile modes, etc. ?
By example, I noticed in one of the studies which have been cited in connection with transients that the musical extract chosen for the blind tests was classical music. I stopped reading ;-)
Justice at west of the Pecos ?The jury is still out on that.
You are proof that no level of expertise here matters.
Attachments

Last edited:
How can reconstruction algorithms, even 8 or 16 deep IIR's or FIR's reconstruct the flat sine?
You would need a much longer filter than 16 deep. Some of the filters in HQ Player are 20-million taps 'deep' or perhaps more. (They are used after sample rate conversion, usually upsampling).
The jury is still out on that.
jn
It's the possible ambiguity of the comment that is funny. That example of 22kHz sampled at 44.1kHz upscales to 192kHz and looks like a nice sine wave. If you time limit the 22kHz wave you create sidebands and eventually violate Nyquist.
By NRZ I am assuming you mean filling in samples and then filtering. Could you please explain what you mean by hardware if not the computing engine that runs the math on the samples.
If it is at least agreed the the differential delay between the left and right channels run through exactly the same algorithm is not limited to 22.7us quantization there is no point in this discussion.
Dear Sir the Great Inquisitor, real ignorance is the absence of curiosity and the certainty of having knowledge.
The forum citation tool summed up the depth of your thinking.
It's also good that your pyres aren't producing a lot of light and calories.
Jacob2,
My read:
Lavry took the NRZ stream, halved the width of the NRZ time, and inserted a zero. So by design, he doubled the sample reconstruction frequency, it's just that half the samples are zero.. Then he shows a spectra where the images fold about 88Khz.
It is consistent with what I would think. If you take a square wave of 50% north, 50% south, and pull back on the on time but keep the rep rate, you are moving towards a stream of pulses and the frequency content changes radically.. So I see that technique as consistent with his graphs around 88Khz as well as stuffing 7 zero values in between the actual data for 8x output. Ya just lose energy in the signal.
jn
And yah, NRZ with zero's is indeed geek humor..
Most likely Lavry just did not mention the digitalfilter operation (needed for removing some of the images) as he was only using (talking about) the output of the D/A conversion.
If we use an ideal dirac pulse stream as output from the sampling/D/A conversion process, we get this:

sampling of one analog signal first and then image of the resulting spectrum in case of all the baseband (audioband) information is present up to nearly Fs/2 .
If the output of the D/A conversion is not an ideal dirac pulse stream, but a NRZ (ZOH) function with Th = 1/Fs then it looks like:

and the resulting spectrum (for the same case as above mentioned):

shows the overlayed amplitude reduction introduced by the NRZ (ZOH) output.
Stuffing zeros in the NRZ (ZOH) stream means that the D/A conversion is a better approximation of the ideal dirac pulse stream, but as can be seen by comparison with the spectrum of the first graph, it will not filter out some of the images.
But it will reduce the overlaying amplitude reduction that can be seen in the third graph.
The NRZ (ZOH) output with Th = 1/Fs will introduce an amplitude error near the Fs/2 of 3.6 - 3.92 dB (20 kHz - 22.05 kHz), but if we reduce the hold time for example so, that Th = 1/(4 x Fs) then the amplitude reduction at Fs/2 will be only 0.22 dB.
But the images will be still present.
Of course, as you've mentioned, there is a penalty as the energy will be reduced when we shorten the hold time.
Last edited:
Please be careful, there is a volunteer cyber bodyguard of his here and that bodyguard gets very aggressive.You think you educate us but in reality, you rather embarrass yourself.

😕 Do you mean he is still in audio business?TNT not really,
RNM was a technical manager of the highest order. He is able to motivate folks to do cutting edge work. In case you haven't figured it out he is still doing that.
That sounds like a Christmas carol...He knows what he hears and acts on it by doing much himself and accords respect to others who do similar things.
 😀
😀Will everyone posting sound quality claim please state the method they used for comparing?Will everyone state the DAC and all other reproduction equipment they use for listening?
Otherwise, still a lot of unknown variables 🙂
Otherwise, still a lot of unknown variables 🙂
Ah, another strawman argument (not enough was spent on listening research so we shouldn't dismiss those who claim to have heard differences) in an attempt to prop up audio business. 🙄Don't really know how much listening research has been done using SOA reproduction equipment, even at the time the research was done. It could be prohibitively expensive to do so. Experimenters may judge this or that piece of equipment should do well enough based on measurements alone, and without expert listener judgement as to equipment reproduction accuracy. Qualifying a panel of expert listeners would add cost and complexity, unfortunately. Don't know how much of research conducted on possibly lacking equipment can be trusted in relation to some of the things people tend to argue about here.
I pointed out very clearly which paper, page, and exactly what he said. He showed the D/A output, and also the filter stuff as well.Most likely Lavry just did not mention the digitalfilter operation (needed for removing some of the images) as he was only mentioning the output of the D/A conversion.
I have been assuming all along that you had looked at the material I was very clearly quoting. Your words "most likely" tell me you have not. That explains our disconnect.
jn
but as can be seen by comparison with the spectrum of the first graph, it will not filter out some of the images.
But it will reduce the overlaying amplitude reduction that can be seen in the third graph.
The NRZ (ZOH) output with Th = 1/Fs will introduce an amplitude error near the Fs/2 of 3.6 - 3.92 dB (20 kHz - 22.05 kHz), but if we reduce the hold time for example so, that Th = 1/(4 x Fs) then the amplitude reduction at Fs/2 will be only 0.22 dB.
But the images will be still present.
.[/QUOTE]
So, with over sampling et al, in practice we have this HF right above 22Khz. If it goes to a line level preamp... 20dB gain and a 200W Power Amp... 30dB gain....
?? Seems like a lot of engineering and still in practice not good enough as HF causes problems ... IM, EMI, RFI.
[ATTACH]806235._xfImport[/ATTACH]
[ATTACH]806236._xfImport[/ATTACH]
Chasing one problem after another.
The AES 24/96 standard seems like a better minimum.. is OK. But not 16/44...
But it doesnt improve much the HF issues.
THx-RNMarsh
Last edited:
I pointed out very clearly which paper, page, and exactly what he said. He showed the D/A output, and also the filter stuff as well.
I have been assuming all along that you had looked at the material I was very clearly quoting. Your words "most likely" tell me you have not. That explains our disconnect.
jn
I'm sorry, but my words "don't tell you" what I have or haven't, it is just (most likely 🙂 ) what you think.
I used "most likely" because I don't know what Lavry was thinking when writing the mentioned paragraph.
But anyway, if it is now agreed by all parties that the "zero stuffing" does not filter out any image spectra, then everything is fine. 😉
I know, and I agree with you.It's the possible ambiguity of the comment that is funny.
And if I go to a million, it looks even better. However, that was not the discussion.That example of 22kHz sampled at 44.1kHz upscales to 192kHz and looks like a nice sine wave.
Finally, someone specifically points out what my question was meant to suggest.If you time limit the 22kHz wave you create sidebands and eventually violate Nyquist.
Yes. Had you looked at the content I specifically referred to, which I took the time to properly reference, you would not need to ask that question.By NRZ I am assuming you mean filling in samples and then filtering.
If by that you think I somehow believe the outputs can be that far off, you are indeed mistaken.If it is at least agreed the the differential delay between the left and right channels run through exactly the same algorithm is not limited to 22.7us quantization there is no point in this discussion.
15 years ago I had a fight with my balance control for listening on headphones to my music off my computer soundcard. No matter what I did, I was unable to get the sound to fully center, more obvious with a mono signal. It turned out my soundcard was using a single DAC feeding two sample and holds, and the output pair was by design, out of sync by one half the sampling rate.
That has not been part of the discussion and questions I have been asking.
jn
@RNMarsh,
as said before, the devil is in the details.
It is one of the advantages of paperwork, that everything always works as intended, it's easy to get rid of image spectra, it is easy to draw clean/pure output signals and so on.
But, as we've discussed it before, it is usually a good (engineering) idea to imply some bandwidth reduction filters at the input of preamplifiers/amplifiers while considering/finding a good compromise between unwanted accumulation of lowpass filters and sufficient reduction of HF-garbage.
I'm sorry, but my words "don't tell you" what I have or haven't, it is just (most likely 🙂 ) what you think.
I used "most likely" because I don't know what Lavry was thinking when writing the mentioned paragraph.
I can only guess based on your verbage. I wish Lavry had provided figure numbers to his writings, it would so much easier to communicate properly.
But anyway, if it is now agreed by all parties that the "zero stuffing" does not filter out any image spectra, then everything is fine. 😉
It has never been my contention that any image spectra was removed. by zero stuffing in his example, the images moved from being centered about 44Khz to centered about 88Khz. As a result, he stated that a 4 pole filter could be used, and the phase response would be much better..
George had posted the links, I'll try to find the links again.
Found it. Page 4 attached.
jn
Attachments
Last edited:
A form of averaging? 😉 I suppose if something still sounds wrong after a decent length of time, it probably is?But listening on a system to different music, in different states of attention, for weeks, does not deceive.
And you can work all that out from what they say on forums etc?So, I try to read the others with the appropriate filters. Do they listen to the same kind of music as themselves, focus their attention on the same details, are they similarly equipped, can they be influenced by audiophile modes, etc. ?
Why?By example, I noticed in one of the studies which have been cited in connection with transients that the musical extract chosen for the blind tests was classical music. I stopped reading ;-)
Can it be as elegantly explained how a single, non-repetitive unipolarity pulse of short duration is sampled in such a system built upon continuous waveforms to predict outcome accurately?
Oh, say 50usec wide pulse?
Let's see how this goes....
Thx-RNMarsh
Oh, say 50usec wide pulse?
Let's see how this goes....
Thx-RNMarsh
@RNMarsh,
But, as we've discussed it before, it is usually a good (engineering) idea to imply some bandwidth reduction filters at the input of preamplifiers/amplifiers while considering/finding a good compromise between unwanted accumulation of lowpass filters and sufficient reduction of HF-garbage.
Yes, and I am one who said to do that. On R.Cordell's book subject forum. Now that you know. That is obvious after you see the screen. I said, either you filter it out at PA input or you need a very linear wideband amp such as a CFB or CMA. Something really linear at HF.
But these are real commercial CD products sold every day and IMHO it should be taken care of at the offending source. The explanations here of how the filtering is done side steps this other point of making it look good for the DAC lit. but shifts the problem else where and creates new ones.... namely, emi, rfi and IM on many audio VFA which are not linear thru HF. .
THx-RNMarsh
Last edited:
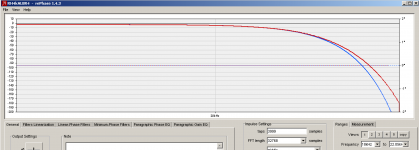
I made my own filters for my DAM dac. It runs on 4k taps (only). Used rePhase to generate the filter. Its optimised for mirror suppression and a smooth drop - not BW. Sounds superb. Even cymbals :-D
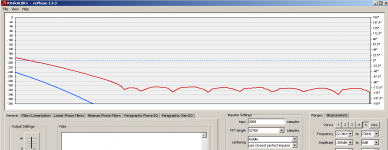
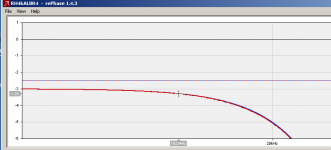
One can deduct the scales by checking the settings to the right lower corner e.g. the second pic that focus on the stop band, the leftmost reading is at 22,04kHz.
Yes - horror - its down 0,28 dB at 19,22KHz. Yes, there is 3 dB damping in the filter to mitigate inter-overs 😉
The blue traces are the theoretical and the red is what you get out with an ideal 4k taps filter implementation.
//
Attachments
Last edited:
Running out of ideas? 😉Can it be as elegantly explained how a single, non-repetitive unipolarity pulse of short duration is sampled in such a system built upon continuous waveforms to predict outcome accurately?
Oh, say 50usec wide pulse?
Let's see how this goes....
I made my own filters for my DAM dac. It runs on 4k taps (only). Used rePhase to generate the filter. Its optimised for mirror suppression and a smooth drop - not BW. Sounds superb. Even cymbals :-D
One can deduct the scales by checking the settings to the right lower corner e.g. the second pic that focus on the stop band, the leftmost reading is at 22,04kHz.
Yes - horror - its down 0,28 dB at 19,22KHz. Yes, there is 3 dB damping in the filter to mitigate inter-overs 😉
The blue traces are the theoretical and the red is what you get out with an ideal 4k taps filter implementation.
//
What happens above 20KHz as i have measured and shown above?
-RNM
- Status
- Not open for further replies.
- Home
- Member Areas
- The Lounge
- John Curl's Blowtorch preamplifier part III