You could 3D print them... 🙂
Not a bad idea. I suspect the tooth profile is too fine though, and I've only seen abs.
I do need to create the capability for the clock museum however, so it would be a useful addition to the repertoire.
Jn
A 1 second snip at 40 hz should be sufficient. But, at least ten cycles into steady state.In Audacity, open the wav file. From the "Tools" menu use "Sample data export...".
Maximum number of samples is 1000000 (22 seconds for 44100 sample rate recording). Sampled value scale linear or dB.
You save the data in a .txt file
In Excel from “Data” menu use “Get External Data”, select that .txt file
George
Jn
A 1 second snip at 40 hz should be sufficient. But, at least ten cycles into steady state.
Jn
I want the .wav file so I can open it in DiAna (needs single tone) and/or LTspice. I usually want at least 20 seconds, but the more the better, especially at low frequencies. Sometimes I just leave it recording until I feel like it.
Hysteresis/saturation test:
1: lock the voicecoil
2: drive the first coil with current drive
3: record the drive current and second coil voltage, hysteresis can be extracted in software.
BL(iv) eddy braking test:
1: Drive the speaker with another speaker and record the second coil voltage.
2: Repeat, but with a LF current drive say 4Hz of the first coil, recording the second coil voltage. Use as low a current as possible to get a measurable result. Eddy current braking modulated with the LF current should be observable with the cone velocity being reflected as 4Hz sidebands of 40Hz in the EMF.
eddy current / skin effect test:
Measure the TS parameters beforehand if possible.
1: Measure impedance vs frequency with the voicecoil locked, in addition to LCR meter reasing at as low a frequency as you can get a reliable inductance reading at.
2: Measure impedance vs frequency with the voicecoil outside the magnet, also in addition to LCR meter reading at the same frequency as the previous LCR reading.
This should tell us about skin effect in the voicecoil and eddy current impedance in the magnet.
Ideally I would like to be able to extract inductance vs frequency from these measurements, which is easier if you can provide CSV files (or if you can do it with your software, make real vs imaginary impedance vs frequency charts).
These tests would help answer questions we've been guessing on without data.
Last edited:
If I understand correctly, the task at hand would be to decompose the signal into the harmonic components, in order to be able to have a look at them in the time domain.
If so, I might be able to help.
The idea would be to pass the signal through a number of sharp band-pass filters (or a single multi-band filter), each centered at the harmonic of interest, obtaining thus both the amplitude and phase information.
The phase can be preserved by acausal filtering, i.e. by filtering the signal first from left to right, and then the other way around. So any nonlinear phase shift incurred by filtering in the one direction will be exactly cancelled in the reverse run.
The signal length is not limited for this method; as a matter of fact it is better to have a longer signal in order to avoid the end-of-signal effects.
I have access to Matlab with their Signal Processing Toolbox, so it would not cost me much time to do this job.
If there is interest, we could discuss further details.
Regards,
Braca
BL(iv) eddy braking test:
1: Drive the speaker with another speaker and record the second coil voltage.
2: Repeat, but with a LF current drive say 4Hz of the first coil, recording the second coil voltage. Use as low a current as possible to get a measurable result. Eddy current braking modulated with the LF current should be observable with the cone velocity being reflected as 4Hz sidebands of 40Hz in the EMF.
It would probably be better to do this test above Fs as eddies are better at higher frequencies, and so that the suspension nonlinearities aren't as much of a factor. So maybe 100Hz and 300Hz, but I don't know what frequencies you get useful coupling between two drivers. A 10x difference in frequencies would be ideal.
If I understand correctly, the task at hand would be to decompose the signal into the harmonic components, in order to be able to have a look at them in the time domain.
If so, I might be able to help.
The idea would be to pass the signal through a number of sharp band-pass filters (or a single multi-band filter), each centered at the harmonic of interest, obtaining thus both the amplitude and phase information.
The phase can be preserved by acausal filtering, i.e. by filtering the signal first from left to right, and then the other way around. So any nonlinear phase shift incurred by filtering in the one direction will be exactly cancelled in the reverse run.
The signal length is not limited for this method; as a matter of fact it is better to have a longer signal in order to avoid the end-of-signal effects.
I have access to Matlab with their Signal Processing Toolbox, so it would not cost me much time to do this job.
If there is interest, we could discuss further details.
Regards,
Braca
Further interest??? Shirley you Jest.. heck yes.
As long as the technique preserves all the entities we look for. I wish to see eddy drag modulation acting on gap flux intensity such that amplitude modulation of the higher frequency is visible. I suspect that current drive may not be the best for doing that, voltage drive might be more appropriate for that specific test.
Given it's only been what, 4 weeks with this, I suspect a lot of optimization of concepts and tests will be in the future. And, all are welcome to participate in whatever expertise they command..
thanks for the offer.
jn
It would probably be better to do this test above Fs as eddies are better at higher frequencies, and so that the suspension nonlinearities aren't as much of a factor. So maybe 100Hz and 300Hz, but I don't know what frequencies you get useful coupling between two drivers. A 10x difference in frequencies would be ideal.
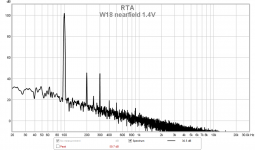
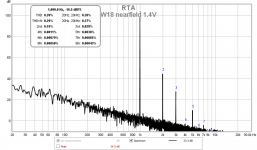
As an example, this is a 200+250Hz IM test applied to Seas W18NX001 driver. I can make more measurements, on demand.
Attachments
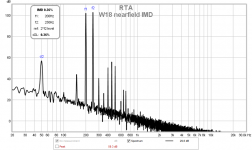
As an example, this is a 200+250Hz IM test applied to Seas W18NX001 driver. I can make more measurements, on demand.
I opened my nonlinear speaker model and without changing anything, did the same test. 2 2.83V input sources at 200 and 250Hz. The scale is adjusted to match your graph as I don't yet have the constants to convert output to SPL.
Attachments
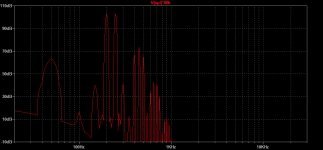
I opened my nonlinear speaker model and without changing anything, did the same test. 2 2.83V input sources at 200 and 250Hz. The scale is adjusted to match your graph as I don't yet have the constants to convert output to SPL.
That doesn't look anything like PMA's test results. Red lines on a black background, he has black lines on a white background.😉
Back to the drawing board, eh??
That is a seriously close result. Interesting.
Are both voltage drive?
jn
Mine is voltage drive. I was actually just about to ask PMA to do the same test with current drive so I can compare results again.
PMA is measured?
keantoken is simm'd?
JN
I'm following this closer than anything else in a long time, it's just all way over my head so best to watch and KMS.*
*Keep Mouth Shut
keantoken is simm'd?
JN
I'm following this closer than anything else in a long time, it's just all way over my head so best to watch and KMS.*
*Keep Mouth Shut
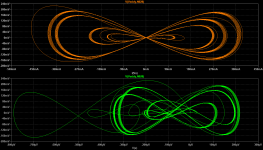
Sometimes I'm surprised when my simulations get a little artistic.
Top trace is the I*v eddy voltage vs cone velocity. Bottom is the I*v eddy voltage vs displacement. Responding to the 200Hz+250Hz waveform.
Top trace is the I*v eddy voltage vs cone velocity. Bottom is the I*v eddy voltage vs displacement. Responding to the 200Hz+250Hz waveform.
Attachments
Last edited:
I believe that is correct.PMA is measured?
keantoken is simm'd?
jn
I flipped different distortions on and off and the only distortion that mattered in my simulation was the reluctance force, BL(i) for making the distortions seen in PMA's measurement. That one distortion explains pretty much all of it, anything else is hidden within that.
PMA, what drive level was that taken at? The specsheet is explicit enough I could make another model specifically for this speaker.
http://www.seas.no/images/stories/excel/pdfdataheet/e0042_w18nx001_datasheet.pdf
I think the reluctance force distortion could actually be predicted on a napkin based on T/S parameters.
Does your model have any suspension parameters, or is this all E/M?I flipped different distortions on and off and the only distortion that mattered in my simulation was the reluctance force, BL(i) for making the distortions seen in PMA's measurement. That one distortion explains pretty much all of it, anything else is hidden within that.
PMA, what drive level was that taken at? The specsheet is explicit enough I could make another model specifically for this speaker.
http://www.seas.no/images/stories/excel/pdfdataheet/e0042_w18nx001_datasheet.pdf
I think the reluctance force distortion could actually be predicted on a napkin based on T/S parameters.
jn
This is all reluctance force. At 200/250Hz the cone mass controls excursion so the suspension doesn't play much of a role unless you have an additional frequency near Fs to stress it. I have nonlinear suspension modeling but it mainly affects the 50Hz difference tone IIRC.
I'm curious if asymmetry in the sidebands or similar esoterica could be used to determine asymmetric reluctance from the magnetized steel?
I'm curious if asymmetry in the sidebands or similar esoterica could be used to determine asymmetric reluctance from the magnetized steel?
I opened my nonlinear speaker model and without changing anything, did the same test. 2 2.83V input sources at 200 and 250Hz. The scale is adjusted to match your graph as I don't yet have the constants to convert output to SPL.
I flipped different distortions on and off and the only distortion that mattered in my simulation was the reluctance force, BL(i) for making the distortions seen in PMA's measurement. That one distortion explains pretty much all of it, anything else is hidden within that.
PMA, what drive level was that taken at? The specsheet is explicit enough I could make another model specifically for this speaker.
http://www.seas.no/images/stories/excel/pdfdataheet/e0042_w18nx001_datasheet.pdf
I think the reluctance force distortion could actually be predicted on a napkin based on T/S parameters.
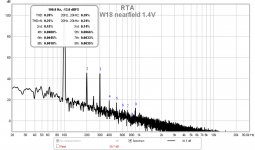
Keantoken, according to my records it was measured at 1.4Vrms. It was a voltage drive. I think your sim is quite close to the measurement.
I also have a single tone measurement at 100Hz, 1.4V, voltage drive, and 1kHz. I think they correspond to the 200+250 test, almost only 2nd and 3rd (for 100Hz).
Attachments
Last edited:
🙂She will follow her heart. I heard no mistakes.
Excellence is as excellence does.
(I have absolutely no idea what that meant, but it really sounded deep, no??)
Just a little gift for you:
YouTube
This is what both a genius guitarist and a great blues man can give in matter of fast and "feel".
Clapton used to say: When I arrived in the Nashville studio, I was invited to play with some old black guitarists in there. I was highly impressed. Blues is a man's music and I was just a child."
Keep up your good work after this intermission.
- Status
- Not open for further replies.
- Home
- Member Areas
- The Lounge
- John Curl's Blowtorch preamplifier part III