What about letting this discussion rest for a while and find a new topic?
At the moment we are all done and need a break. It’s a very interesting topic so I’m sure (and hope) it will be back on the arena within a couple weeks.
I hope that’s ok by you as well John.
Cheers
At the moment we are all done and need a break. It’s a very interesting topic so I’m sure (and hope) it will be back on the arena within a couple weeks.
I hope that’s ok by you as well John.
Cheers
The keyword is asymmetry of sidebands. John said that finally.
It reminds me an old story about one professor: "They are dumb! I've explained them, but they did not understand! I explained them once more, but they did not understand! I explained the third time; I even myself understood, but they still did not!!! How dumb they are?!"
It reminds me an old story about one professor: "They are dumb! I've explained them, but they did not understand! I explained them once more, but they did not understand! I explained the third time; I even myself understood, but they still did not!!! How dumb they are?!"
Stinius, everyone wants to 'bail' but not yet. We have to look at which it is: Matti's or Mitch's explanation that is ACTUALLY being measured?
i.e. is it IM or FM(or AM) that is showing up on the graph? It's easy, just do the math yourself and try to fit it to the graph. Rough fits are NOT OK.
i.e. is it IM or FM(or AM) that is showing up on the graph? It's easy, just do the math yourself and try to fit it to the graph. Rough fits are NOT OK.
Last edited:
The keyword is asymmetry of sidebands. John said that finally.
It reminds me an old story about one professor: "They are dumb! I've explained them, but they did not understand! I explained them once more, but they did not understand! I explained the third time; I even myself understood, but they still did not!!! How dumb they are?!"
I heard that Buddha said most people need _many_ explanations how to
achieve nirvana; very wise men would need only abt. 50000.
Is this an acceptable input voltage for the amplifier test?
Attachments
i.e. is it IM or FM(or AM) that is showing up on the graph? It's easy, just do the math yourself and try to fit it to the graph. Rough fits are NOT OK.
Rough fit's all you're going to get.
The graph doesn't even fit its own numbers.
I created a simple graph using the numbers given but it doesn't scale so as to fit the published graph.
An externally hosted image should be here but it was not working when we last tested it.
se
Gerhard:
Is that the input or the output of the opamps? Or is there an input sensitivity issue preventing looking directly at the input?
Is that the input or the output of the opamps? Or is there an input sensitivity issue preventing looking directly at the input?
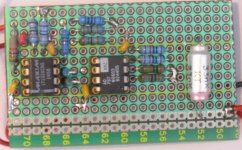
That's the output of the Lt1028.
I could loook at the first op amp with a Tektronix FET probe,
but that has probably to much IMD.
BTW R7 was intended to be 1K only but I won't change this again.
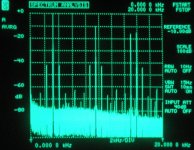
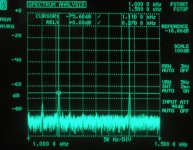
The peaks are at
1.370 KHz
2.270 KHz
3.180 KHz (center)
4.080 KHz
4.990 KHz
(by moving the crosshair cursor)
I could loook at the first op amp with a Tektronix FET probe,
but that has probably to much IMD.
BTW R7 was intended to be 1K only but I won't change this again.
The peaks are at
1.370 KHz
2.270 KHz
3.180 KHz (center)
4.080 KHz
4.990 KHz
(by moving the crosshair cursor)
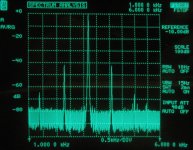
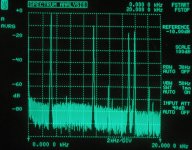
Now I have increased the frequency of the square wave by 30 Hz to 3210 Hz.
The old spectrum is in the memory and overlaid with the new.
These are the peaks now:
1.120 KHz (was 1.370, delta = -250 Hz) ==> 8.33 * df, probably 8*
2.150 KHz (was 2.270, delta = -120 Hz) ==> 4 * df
3.210 KHz (was 3.180, delta = + 30 Hz) ==> 1 * df
4.260 KHz (was 4.080, delta = +180 Hz) ==> 6 * df
5.320 KHz (was 4.990, delta = +330 Hz) ==> 11 * df
I'll zoom in even more to get more precise frequencies, but not tonight.
It's 2:15 am local time.
Gerhard
Attachments
Last edited:
It reminds me of an old story about one professor: "They are dumb! I've explained them, but they did not understand! I explained them once more, but they did not understand! I explained the third time; I even myself understood, but they still did not!!! How dumb they are?!"
Actually this could interpreted quite differently, in my experience.
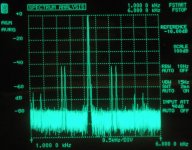
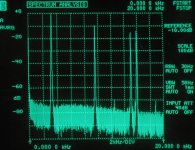
The questionable frequency pair in high resolution:
Squarewave = 3180 Hz ==> 1380 Hz
Squarewave = 3210 Hz ==> 1110 Hz
IMD product wanders 270 Hz down for input step of 30 Hz
=====> This is IMD with 9 * square wave frequency.
Methinks this argument is settled.
The not so funny thing is that everybody with a tone generator and a soundcard
could have done this in one evening, but nobody did it.
Attachments
Last edited:

- Status
- Not open for further replies.
- Home
- Member Areas
- The Lounge
- John Curl's Blowtorch preamplifier part II