any chance that the resistances installed on the cathode for current monitoring have a funky connection?
would a suppressor/screen grid resistor be funky?
most likely grid leak developed from red plating,as in bad tube
quick check with output tubes removed what do you get at pin 5 any dc?
would a suppressor/screen grid resistor be funky?
most likely grid leak developed from red plating,as in bad tube
quick check with output tubes removed what do you get at pin 5 any dc?
Made some improvements: replaced both 1 Ohm resistors for Bias measurment, separated Bias regulation for the two tubes (Rob Robinette describes a simple mod), replaced the last filter cap not replaced before, replaced suppressor/screen grid resistors.any chance that the resistances installed on the cathode for current monitoring have a funky connection?
would a suppressor/screen grid resistor be funky?
But no results - redplating is still present 🙁
With tubes removed the pin 5 on both sockets is around -36Vdc.quick check with output tubes removed what do you get at pin 5 any dc?
I take measures of all the pins of V4/V5 at idle and with triangular wave applied at High Gain Input (1kHz, 100mVpp) and all the volume (Pre, Master) at 10 (max):
V4 Pin Idle Max
1 29.8mV 255mV
2 3.12Vac 3.05vac
3 443Vdc 367Vdc
4 436Vdc 340vdc
5 -35Vdc -46Vdc (but with a peak of -52Vdc in between)
6 438Vdc 366Vdc
7 3.13Vac 3.05Vac
8 like Pin 1
V5 Pin Idle Max
1 29.9mV 137mV (but with a peak of 165mV in between)
2 3.14Vac 3.06vac
3 440Vdc 371Vdc
4 435Vdc 352vdc
5 -35Vdc -61Vdc
6 441Vdc 369Vdc
7 3.13Vac 3.06Vac
8 like Pin 1
I made also some test varying a lot the Bias set at idle (from 23mV to 36mV, with many steps) also playing guitar to listen for difference in sound. The strange thing is that seems that redplating is not (or not so much) related to biasing. It was present in all cases, and seems (much) more related to the volume of input.
Last edited:
ok
i'm lost on everything from how your reporting voltages too how your varying conditions while testing and without being there to observe what your doing it's hard to figure out what is happening
sorry i'm not that much of a guru.
i'm lost on everything from how your reporting voltages too how your varying conditions while testing and without being there to observe what your doing it's hard to figure out what is happening
sorry i'm not that much of a guru.
c21 and r29 and t3 choke all ok?
C21 and R29 were replaced.
T3 I don't know how to check.
Sorry if I giving to much data and inputs, but it's really frustrating this activity and I'm trying to do my best.
As already mentioned earlier by other poster A DMM probably can not measure bias voltage correctly under signal condition (AC). So why not use scope (DC)?? Priority is to disconnect NFB to check output and pin3 (plate) waveform again.
p/s Record also the bias voltages at which clipping occurred, before and after bias resistors *tot 4 readings.
p/s Record also the bias voltages at which clipping occurred, before and after bias resistors *tot 4 readings.
Last edited:
Yes, I know. I've an issue with the probe. I hope I can solve soon.As already mentioned earlier by other poster A DMM probably can not measure bias voltage correctly under signal condition (AC). So why not use scope (DC)??
As already mentioned earlier by other poster A DMM probably can not measure bias voltage correctly under signal condition (AC). So why not use scope (DC)?? Priority is to disconnect NFB to check output and pin3 (plate) waveform again.
p/s Record also the bias voltages at which clipping occurred, before and after bias resistors *tot 4 readings.
The scope is ready again 🙂 and I've a lot of picture for you😀 before starting I've to thank you again for your patience and for your suggestions. You are really kind to dedicate your time to novice like me. So, go ahead.
All what you see in the following is related to an input signal with this characteristics: triangular wave, 100mVpp, 1KHz. The controls are: preamp volume on 5 (twelve o'clock), bass=10, middle-treble-presence=0 --> this settings allow to mantain the wave more triangular than possibile.
All the pictures have 2 traces: V4 is the upper one and V5 is the lower. At idle the two traces (flat) are respectively 2 divisions over the horizontal center line and 2 divisions under it.
I take two series of picture for each case. One with NFB connected and the other without it.
In this first series of pics you can see the output of PI after the coupling caps. I take the pictures with the master Volume in the following positions:
=3 start clipping
=5 (twelve o'clock)
= 10 (max)
so you can have an idea of the evolution.
This is the series with NFB connected:


and this is the series with NFB disconnected:


I post the other pictures in different answers due to limitations of the website.
As already mentioned earlier by other poster A DMM probably can not measure bias voltage correctly under signal condition (AC). So why not use scope (DC)?? Priority is to disconnect NFB to check output and pin3 (plate) waveform again.
p/s Record also the bias voltages at which clipping occurred, before and after bias resistors *tot 4 readings.
This second series of pics is from pin 3 (plate) of power tube. V4 is the upper one and V5 is the lower. Each series with master Volume in 3 positions:
=3 start clipping
=5 (twelve o'clock)
= 10 (max)
This is the series with NFB connected:


and this is the series with NFB disconnected:


As already mentioned earlier by other poster A DMM probably can not measure bias voltage correctly under signal condition (AC). So why not use scope (DC)?? Priority is to disconnect NFB to check output and pin3 (plate) waveform again.
p/s Record also the bias voltages at which clipping occurred, before and after bias resistors *tot 4 readings.
This thirs series is related to Bias. You can see the waveform at taken at the two end of 1 Ohm resistors. V4 is the upper one and V5 is the lower. Each series with master Volume in 3 positions:
=3 start clipping
=5 (twelve o'clock)
= 10 (max)
This is the series with NFB connected:


and this is the series with NFB disconnected:


For Bias, as suggested by Koonw, I take also the measures before and after (pin 5) the gris resistors in the same conditions. Here a table that summarize the results:

Before I forget, I like to give short reply: Clipping for both tubes should be opposite to each other (as attached). In #108, the 2nd last photos show they are not so. So the driver output must have clipped before the output.
Again in same post last photo show double clipping as the driver output and power stage output both are clipping that form near square wave. So it's necessary to examine the driver output.
Again in same post last photo show double clipping as the driver output and power stage output both are clipping that form near square wave. So it's necessary to examine the driver output.
Attachments
Last edited:
As already mentioned earlier by other poster A DMM probably can not measure bias voltage correctly under signal condition (AC). So why not use scope (DC)?? Priority is to disconnect NFB to check output and pin3 (plate) waveform again.
p/s Record also the bias voltages at which clipping occurred, before and after bias resistors *tot 4 readings.
The last series of picture are related to the NFB signal at 16 Ohm pin at the ohm selector and the signal at output jack. Both these series are taken with NFB not connected. For each series 3 pictures with master on 3,5,10
NFB signal series:


Output jack series:


three conditions only two sets of pictures....arrrgh
red plated tubes and in my opinion, still not biased correctly...
red plated tubes and in my opinion, still not biased correctly...
in going back over the thread i don't recall the coupling caps from the phase inverter being tested for leakage... or did i miss it...
For Bias, as suggested by Koonw, I take also the measures before and after (pin 5) the gris resistors in the same conditions. Here a table that summarize the results:
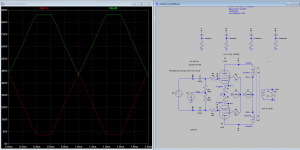
The attached simulation can tell us why the bias voltage measured at grid 1 pin 5 changed during clipping. But the top tube does not quite agreed, it should go more positive, while the bottom go more negative (agreed).
Attachments
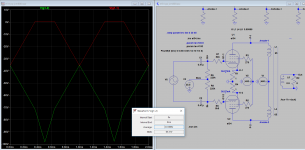
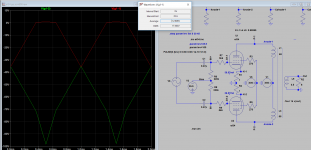
Koonw does the vertical scale indicate grid bias?
not familiar with the software.
Yes.
so it shows why more negative bias needs to be applied correct?
I think the top tube driver has clipped earlier so it can not go more positive (unable to drive to full power) hence the bias voltage measure less positive, not due the bias range, IMO.
three conditions only two sets of pictures....arrrgh
red plated tubes and in my opinion, still not biased correctly...
Please give a look also to the previous posts.
There are three different post for each measure:
- PI output
- Pin 3 of power tubes
- Bias
Each of them contains:
- 3 pictures for the test with NFB
- 3 pictures for the test without NFB
Each set of 3 picture is related to a different level of the Master Volume:
- 3 (when start clipping)
- 5 (twelve o''clock)
- 10 (max)
The last post has two sets of 3 pictures (each of them for the same postion of the Master Volume):
- the trace of NFB (taken at 16 Ohm pin of the Ohm selector)
- the trace at output jack (connected to a 16 Ohm pure resistive dummy load)
About biasing you can see the specific post. I biased both the tubes at 30mA of current, corresponing to -34.2Vdc for both tube at pin 5 in idle conditions.
- the first set
- Home
- Live Sound
- Instruments and Amps
- JCM800 2204 Phase Inverter issue and other