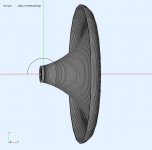
Must be something like this, a simple circular arc (here with a rollback).
BTW, a typical 2" driver is possible to use down to 500 Hz in just about any horn (it's actually more like 550 Hz, based on the vertical polars).
BTW, a typical 2" driver is possible to use down to 500 Hz in just about any horn (it's actually more like 550 Hz, based on the vertical polars).
Attachments
Last edited:
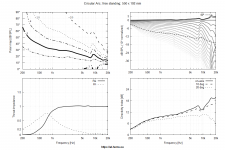
Comparison with an "OS" of similar size.
Call it 'best of all worlds' if you like, I don't see it being much different, if not worse.
Call it 'best of all worlds' if you like, I don't see it being much different, if not worse.
Attachments

Last edited:
Must be something like this, a simple circular arc (here with a rollback).
BTW, a typical 2" driver is possible to use down to 500 Hz in just about any horn (it's actually more like 550 Hz, based on the vertical polars).
How would you define Fc for a circular arc?
I know of no other application of a single BMS coax + horn that's specified for 140 dB (peak) with a crossover @ 450Hz (and not 550 Hz).
Last edited:
No finite horn has a cutoff. You can define it wherever you like, it won't have any useful meaning anyway.
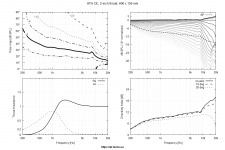
- Did you see the throat impedance of that horn?
And it's not 450 Hz, that's obvious from the data.
- Did you see the throat impedance of that horn?
And it's not 450 Hz, that's obvious from the data.
Last edited:
crossover @ 450Hz (and not 550 Hz).
Electrical: Passive MF/HF (450Hz - 23kHz).
Though it depends on the horn and actual setting, XO is set a bit higher for the configuration shown in the plots.
Last edited:
No finite horn has a cutoff. You can define it wherever you like, it won't have any useful meaning anyway.
It's a distinct, variable parameter of the equation, so I guess it does have meaning in this case.
Is it a secret what the waveguide is because this is all very cryptic. The names of the images aren't helping much this time.Some believe it's an OSWG, but it isn't.
The equation in question isn't perfect. There are 2 features I'd probably add, but it's the elegance of the bare equation that is appealing.
Unfortunately it's also protected, so in order not to wake up sleeping dogs it seems wise not to mention it in the public domain for the time being.
Unfortunately it's also protected, so in order not to wake up sleeping dogs it seems wise not to mention it in the public domain for the time being.
Last edited:
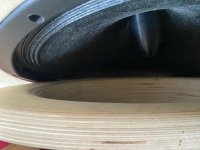
Is it a secret what the waveguide is because this is all very cryptic.
That waveguide is deeper than it appears at first glance 😉.
Last edited:
Comparison with an "OS" of similar size.
Call it 'best of all worlds' if you like, I don't see it being much different, if not worse.
It would be a lot easier to compare your sim if its response wasn't normalized...any chance we can get a redraw?

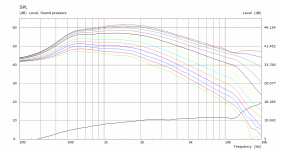
As the presented measured response is more or less flat on-axis, normalizing to ~10 deg is the best simple way of comparing it, and it actually matches pretty well - all the distinct features are clearly visible.It would be a lot easier to compare your sim if its response wasn't normalized...any chance we can get a redraw?
If the data wasn't normalized we could see how it performs on low end...Normalization is a skew of the data more or less. If you don't want to show it...I understand.
Last edited:
Some believe it's an OSWG, but it isn't.
The horn is from the Tannoy VQ60 (edit: or VQ100 / Impedanz). Not a OS horn. More a thing of a radius. The horn is disappointing. The radiation outside the axis is bad. I have some of axis measurements from this Horn, if it is interesting, let me know
Last edited:
It's not so much the majority of manufactured horns that interest me, even though the one shown isn't bad at all (confirmed by several people), but the underlying math.
It could be considerably improved by adding 2 features.
It could be considerably improved by adding 2 features.
You can't really see what you want to compare from this sort of simulation to a real measurement. The driver itself is a very large factor in the low end response.If the data wasn't normalized we could see how it performs on low end...Normalization is a skew of the data more or less. If you don't want to show it...I understand.
The model needs to include lumped elements to more accurately represent the drivers response. Those parameters change with each driver so it becomes difficult to make any kind of generic response that is useful.
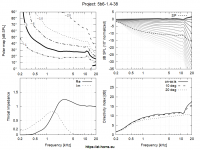
Here is an example of a non normalized plot compared to the same Ath report format.
You can see that the waveguide directivity gives out smoothly. When you compare the throat impedance to the magnitude you can see how they correspond. What will happen below the peak of the impedance depends a lot on the driver being used.
Attachments
I like looking at the spl chart normalized and un-normalized. Un normalized shows me how much support or lack of support I can expect from the vent, regardless of the driver.
Vent 😕 All the Ath and ABEC sims are made with a constant acceleration or velocity source so they are useful for looking at what the waveguide does alone with an ideal source. The Throat impedance and DI show how much support the waveguide will have at low frequencies. The information is already there to see.Un normalized shows me how much support or lack of support I can expect from the vent, regardless of the driver.
Exactly, and as long as the beamwidths and throat impedances are roughly the same at the low end (which they are, IMO), roughly the same will be also the low end response with the same driver.
- Home
- Loudspeakers
- Multi-Way
- Is it possible to cover the whole spectrum, high SPL, low distortion with a 2-way?