If your circuit is unstable or you do something silly with the transient parameters, LT Spice will grind away for minutes. When this happens to me, I assume that I've screwed up somewhere. Usually the results are almost instant with my Intel(R) Core(TM) i5-1035G1 CPU @ 1.00GHz 1.20 GHz, laptop 8GB ram. I set the transient parameters something like .tran 0 {10/f} {1/f} {1e-4/f} where f is the input SINE(0 {A} {f}), .par f=12k A=.5 .options plotwinsize=0
The circuit I am workinhg on now is quite stable, no problems whatsoever.
It is a bit complex in that it has very high and very low voltages, opamps-within-opamp loops, that sort of thing.
Sometimes I can speed it up with replacing an opamp with a simpler-model opamp or generic vcvs's.
Jan
It is a bit complex in that it has very high and very low voltages, opamps-within-opamp loops, that sort of thing.
Sometimes I can speed it up with replacing an opamp with a simpler-model opamp or generic vcvs's.
Jan
Maybe this has been covered - if you define a measurement, can you place the result at the schematic screen (or graph screen) without having to open the error log and scrolling around to find it?
Jan
Jan
if you define a .MEASUREment, can you place the result at the schematic screen (or graph screen) without having to open the error log and scrolling around to find it?
Remember that one .MEASURE statement can calculate 30 different output results , if your job also includes a .STEP statement which runs the simulator 30 times with 30 different values of a parameter.
Example: ".MEAS TRAN my_overshoot FIND(... blah blah blah" followed by ".STEP PARAM Ccomp LIN 5p 34p 1p" , will calculate 30 different result values for my_overshoot. One when Ccomp=5p, another when Ccomp=6p, a third when Ccomp=7p, etc.
It's kind of a demonstration that what you seek in #3,523 is extremely unlikely, since "place the result at the schematic screen" sometimes will require "place all 30 results at the schematic screen"
You can right click "place .op Data label" on the schematic, but it is limited to single expressions and node designator numbers are dynamic, so you should label the nodes in the expression to give them a fixed name.
I actually was thinking about displaying simple .meas results like peak voltage, peak-peak currents, RMS voltages and such directly on the screen.
So far I haven't found a possibility.
Jan
So far I haven't found a possibility.
Jan
I have install the new one, I have to say it is more bad then the present old sparky.
when simulating the scrolling is jumping, and when push go button it go on pause
and need push again. Then crashes sometimes or hang and not possible to get out
except with hardstop in windows.
The output waveform is not nice anymore, it do golf around when do a sinusoidal in
a class d amp.
The outfit, the buttons, it does not look nice, more a children playstation.
You can alter the Toolbar back to 'Legacy' in the settings options.The outfit, the buttons, it does not look nice, more a children playstation.
Maybe this has been covered. When I close a simulation, but later want to look at the resulkts again, how can I re-open a .raw file and call up the graph panel again without having to run the sim again?
Jan
Jan
Last edited:
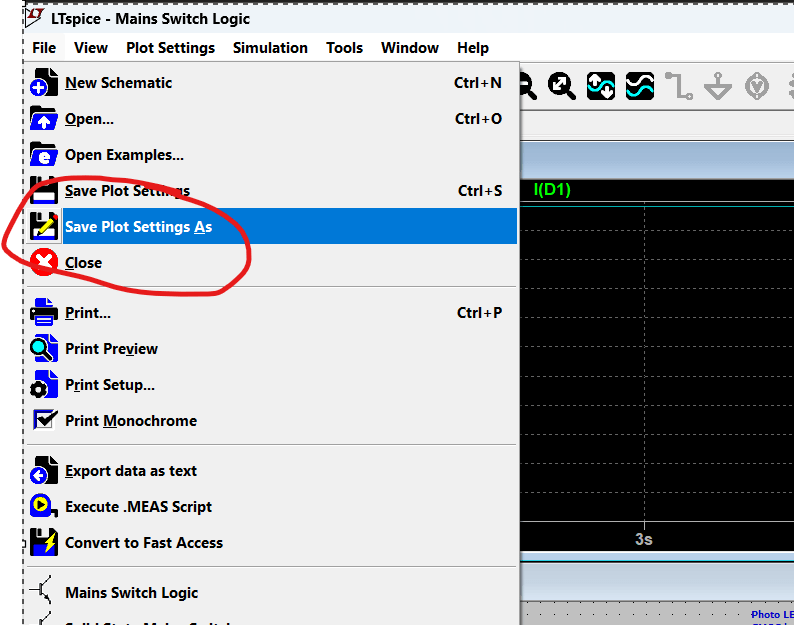
Do you mean saving the 'plot settings'?
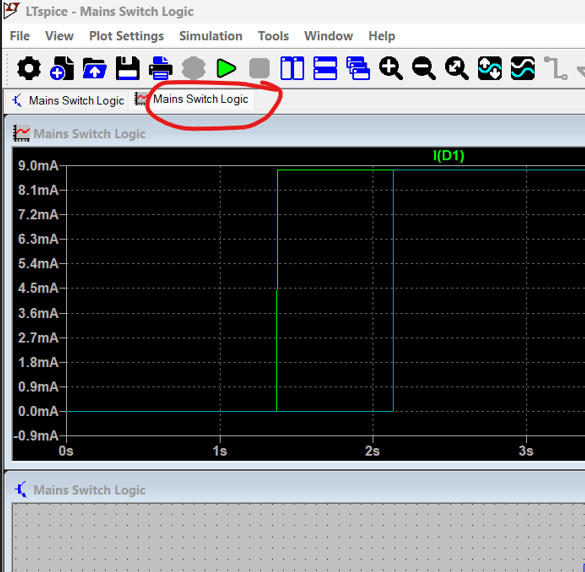
Click the graph tab to bring it into focus and a new set of options appear when you go to save the file.


Click the graph tab to bring it into focus and a new set of options appear when you go to save the file.
No I don't think that is it.
When I close a simulation, and later reload the .asc, you can't call the graph window up as you haven't run a sim yet.
But there still is the .raw with all the results from the previous run. How do I call that up?
Jan
When I close a simulation, and later reload the .asc, you can't call the graph window up as you haven't run a sim yet.
But there still is the .raw with all the results from the previous run. How do I call that up?
Jan
Last edited:
I can open a saved plot file directly by clicking the .raw file and opening with LTspice. That loads the graph window instantly.
It doesn't work here, but maybe because I save the .raw files separate from the project folder.
I'll play a bit with it.
Thanks for the hint.
Jan
I'll play a bit with it.
Thanks for the hint.
Jan
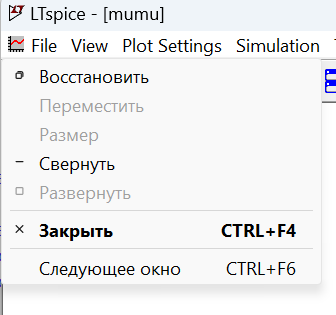
I sometimes compare different Spice programs by running them in batch mode and get a RAW file. I click on them with my mouse. LTspice opens, but there is no picture. An additional command appears on the top left. Do a restore and after the PLOT window appears add the desired signal.

It doesn't work here, but maybe because I save the .raw files separate from the project folder.
I'll play a bit with it.
Thanks for the hint.
Jan
Try saving the Plot Settings first, save them under the same name as the .asc and then save the sim and all must be in the same folder. You should end up with the .asc, the .raw, the .plt and the .net file all together in the same place.
- Home
- Design & Build
- Software Tools
- Installing and using LTspice IV (now including LTXVII), From beginner to advanced