cambiamos 😀
O.de B, do you found useful the output impedance measuring procedure, or You already know that?
O.de B, do you found useful the output impedance measuring procedure, or You already know that?
Last edited:
If the second (bracketed) figure is higher than the first then you haven't used/included enough harmonics in your simulation.
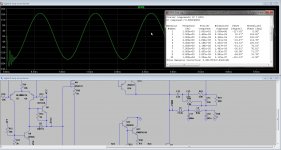
That oscillation at the start will totally screw your result, your simulation isn't covering and including the harmonics contained in that.
That oscillation at the start will totally screw your result, your simulation isn't covering and including the harmonics contained in that.
If the second (bracketed) figure is higher than the first then you haven't used/included enough harmonics in your simulation.
That oscillation at the start will totally screw your result, your simulation isn't covering and including the harmonics contained in that.
So it has to look like this? I need to remove startup or set start plot after 6 ms.
the other one was the D amp, that simulationtime needs to set longer? but it do go slow, this one is a liniair amp (circlotron I make pcb for).
thanks for respons.
Attachments
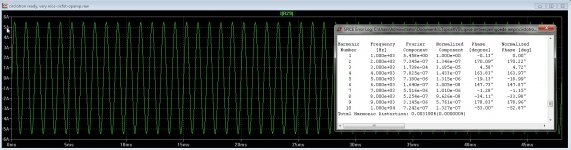
Yes, that looks OK.
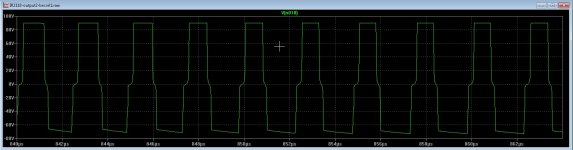
I need to sim long enough so the value between brackets are zero, or same as left side? that costs time with a d amp, simulates very long, I need also to look at the IR2011 model, the lower side mosfets do not switch to the rails, the upper side is fine. @spiceanalog did made that model, and maybe he knows why and how to correct.
thanks all for help.
Attachments
I don't think there are any hard and fast rules tbh. Mike Engelhardt said it was a requested feature and that was why it made an appearance. Definite details on interpreting it down to the nth degree are sketchy as you have probably found.
Mike is pretty approachable I have found, particularly if you have any issues with models or something doesn't seem right.
Mike is pretty approachable I have found, particularly if you have any issues with models or something doesn't seem right.
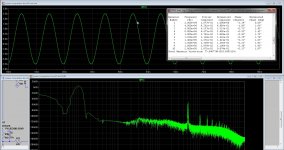
I see sometimes things go messed up also, FFt -90 dB and tekst says 75 % distortion.
But I get the picture, thanks.
Never mind, I did make a mistake in setup frequenty.

Just installed the LTspice. Tried to run a simple simulation but instead of running into a problem. The simulator kept on showing the error message"Port(pin) count mismatch between the definition of subcircuit "12ax7" and instance: "xu1"
The instance has fewer connection terminals than the definition." It seems that the simulator found the model file but somehow it can't get it right. Have any of you had this kind of problems? Could you please share the solutions? Thanks.
The instance has fewer connection terminals than the definition." It seems that the simulator found the model file but somehow it can't get it right. Have any of you had this kind of problems? Could you please share the solutions? Thanks.
Check the symbol, it should have 3 pins only for 12AX7, unless you are using one of those silly models with the heater pins.
I see sometimes things go messed up also, FFt -90 dB and tekst says 75 % distortion.
Hi Kees,
You don't have enough precision in your FFT calculations.
Add the following ltspice directives and it will be much better:
.options numdgt=7
.option plotwinsize=0
numdgt=7 gives double precision
plotwinsize=0 disables the lossy compression
Why doesnt the new LTSpice include subdirectories of symbol and library files?
Upgraded to XVII from IV, IV included all the subdirectories, new one does not.
Upgraded to XVII from IV, IV included all the subdirectories, new one does not.
Why doesnt the new LTSpice include subdirectories of symbol and library files?
Upgraded to XVII from IV, IV included all the subdirectories, new one does not.
Look in Documents\LTSpiceXVII.
What bert says is correct. LTXVII now places these folders in the user documents area under LTXVII
Do you have that folder (LTXVII) in your documents ?
Do you have that folder (LTXVII) in your documents ?
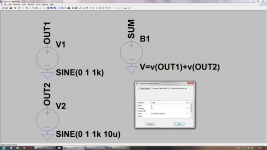
Is there any way to sum two outputs in LTspice IV?
I'm working on a line level 2 way crossover and would like to view the combined output with phase. I've searched for a couple of days and can't find the answer. That is probably as much of a testament to my search skills as anything but if someone can point me in the right direction I'd be grateful.
Thanks,
Marty
If you click on the name of the curve ( don’t remember whether left or right) you should see a window opening where you can enter an expression. Just add the other value and you have it.
Sorry for not being more precise, I’m not at the screen and did just that the first time yesterday
Sorry for not being more precise, I’m not at the screen and did just that the first time yesterday
- Home
- Design & Build
- Software Tools
- Installing and using LTspice IV (now including LTXVII), From beginner to advanced