Does Hornresp assume uniform attenuation over the frequency of the filling material?
Does it assume frequency dependend attenuation of the material?
The attenuation of the absorbent filling material increases with frequency. The image below compares the default record number 1 power response (green trace) with the power response after an amount of filling material is added (red trace).
What filling material does Hornresp simulate and what are its properties?
Hornresp does not care what sort of filling material is being used.
All it needs to know is the airflow resistivity of the material, specified in mks rayls per metre.
Hornresp shows "total filling [litres]" and "total polyfil [kg]". IF simulating a transmission line, is it the total volume ofthe TL in litres. And "total polyfil" is the weight of ?what? evenly (?) distrybuted in the total volume of the TL?
It's all in the Help file (use the Find tool to search for filling).

And "total polyfil" is the weight of ?what?
Just to clarify - "Polyfill" (with two l's not one) is a specific product (Google Polyfill stuffing).
IIRC, the Hornresp filling model is based on this paper: Simple, relaxational models for the acoustical properties of porous media.I have a question about "filling". Does Hornresp assume uniform attenuation over the frequency of the filling material?
What filling material does Hornresp simulate and what are its properties? Does it assume frequency dependend attenuation of the material?
In "Laudspeaker wizard" window, when selecting "schematic" and filling, Hornresp shows "total filling [litres]" and "total polyfil [kg]". IF simulating a transmission line, is it the total volume ofthe TL in litres. And "total polyfil" is the weight of ?what? evenly (?) distrybuted in the total volume of the TL?
I read this part of the help file before posting my question.It's all in the Help file (use the Find tool to search for filling).
@Kolbrek @David McBean Thank you for clarification. I still however do not understand what what does the attenuation charactristic of the filling material look like as a function of frequency?
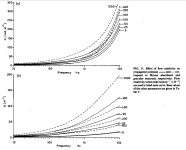
I have to say that I am not an expert in this field. But I read the paper you mention (frankly, I do not understand much of it) Simple, relaxational models for the acoustical properties of porous media and it references a paper by Attenborough, K. (1983) Acoustic Characteristics of Rigid Fibrous Absorbents and Granular Materials. Journal of the Acoustical Society of America, 73, 785-799. The graph below is taken from [Attenborough]. If I am reading it correctly, specifying the airflow resistivity of the material in mks rayls per metre does not define the frequency dependend attenuation of the material used. For example, if we look at the graph below we will see that a material of 100 mks rayls per metre can have different chararacteristic depending on whether it is a fibrous absorbent or granular material (dashed or continuous line).All it needs to know is the airflow resistivity of the material, specified in mks rayls per metre.
In you screenshot below, is the "Total polyfill 0.648 kg" calculated from Fr1 and Tal1 and valid only for the specific type of "polyfill" embedded in Hornresp?
I mean the nr 0.648 kg. In other words, if I buy "polyfill" form Amazon it will be different than "polyfill" from Digikey? I may need 0.7kg of one polyfill while 0.648kg of the other one?
What if I want to use wool or cotton as my dumping material? Is the model embeded in Hornresp still valid? How to recalculate it?
Attachments
I still however do not understand what what does the attenuation charactristic of the filling material look like as a function of frequency?
For the example I gave it's simply the difference between the green and red trace values at each frequency. If required for some reason, the data for the two traces can be exported and the attenuation (green value minus red value) plotted as shown below.
if we look at the graph below we will see that a material of 100 mks rayls per metre can have different chararacteristic depending on whether it is a fibrous absorbent or granular material
That's because different models are used for the two material types. The Hornresp model assumes that the absorbent material is fibrous. (Concrete, gravel and sand are examples of granular sound absorbers).
is the "Total polyfill 0.648 kg" calculated from Fr1 and Tal1 and valid only for the specific type of "polyfill" embedded in Hornresp?
Yes.
if I buy "polyfill" form Amazon it will be different than "polyfill" from Digikey? I may need 0.7kg of one polyfill while 0.648kg of the other one?
Yes.
Hornresp uses an empirical model to determine equivalent Polyfill weight. It is only intended to give the user an idea of the amount of filling material likely to be required. The Polyfill model was requested by a user and was developed based on data provided by them. It is completely separate from the main absorbent filling material model used to calculate power response.
What if I want to use wool or cotton as my dumping material? Is the model embeded in Hornresp still valid?
If the airflow resistivity of the material (at the packing density being used) is known, then the model is totally valid.
How to recalculate it?
There is nothing to recalculate - simply enter the correct Fr1 and Tal1 values.
Feature request:
Hello, David. The dB scale provides the physical loudness achieved but it doesn't convey how loud the sound would perceived by human ears. After all, we are designing loudspeakers, for listening purposes. It would be nice to have the ability to see the frequency response in phons and sones too.
Regards
It would be nice to have the ability to see the frequency response in phons and sones too.
Not sure how much use it would be in practice, as the parameter values in ISO 226 that would be required to calculate the loudness levels, are only valid from a lower limit of 20 phon to:
An upper limit of 90 phon from 20 Hz to 4000 Hz
An upper limit of 80 phon from 5000 Hz to 12500 Hz
Nevertheless, I will have a look at how much work would be involved.
If implemented the feature would only apply to the main power response chart and be restricted to a frequency range of 25 Hz to 1000 Hz. It would not apply to the Loudspeaker Wizard.
Are you aware of any existing program that produces a chart of loudness versus frequency, as distinct from normal equal-loudness-level contours?
Tell me which box can be built for them
It is probably more appropriate for this request to be posted on another thread as it is general in nature and not specifically related to Hornresp.
can a moderator ( Allen ) make a thread for this OP asking for suggested enclosures for his drivers,
it is clogging the HornResp Thread.

it is clogging the HornResp Thread.
 Posts regarding the JBL 2042HPL moved here - https://www.diyaudio.com/community/threads/which-box-for-jbl-2042hpl.423317/post-7915315
If implemented the feature would only apply to the main power response chart and be restricted to a frequency range of 25 Hz to 1000 Hz.
The feature will be added in the next update and have an extended frequency range of 20 to 10000 Hz. It will be possible to show the loudness level in either phon or sone units, but I am not sure how valid the results will be as the standard loudness model requires that the sound signal at any given frequency is a pure continuous tone.
(Awaiting a response from Tachi778 before taking any action on implementing the feature).
Despite not having heard back from Tachi778, because the feature received 3 'Likes' from others when it was proposed, it will be included in the next update.
IIRC, the Hornresp filling model is based on this paper:
You recall correctly 🙂.
Hello David,Not sure how much use it would be in practice, as the parameter values in ISO 226 that would be required to calculate the loudness levels, are only valid from a lower limit of 20 phon to:
An upper limit of 90 phon from 20 Hz to 4000 Hz
An upper limit of 80 phon from 5000 Hz to 12500 Hz
Nevertheless, I will have a look at how much work would be involved.
If implemented the feature would only apply to the main power response chart and be restricted to a frequency range of 25 Hz to 1000 Hz. It would not apply to the Loudspeaker Wizard.
Are you aware of any existing program that produces a chart of loudness versus frequency, as distinct from normal equal-loudness-level contours?
PyDSM has ISO 226 already implemented. I am not aware of any program that plots that plots equal loudness but I understand that there are several audio DSP products (including miniDSP) that has equal loudness feature implemented. On my own android phone, I have Wavelet software that provides option for equal loudness volume controls. I believe that plotting in phons gives better sense of the loudspeaker system's capability, because it's meant to cater to human listener's pleasure primarily. A manufacturer's design/manufacture convenience is but secondary.
Another opensource implementation of ISO 226 is librosa.
Here's some hobbyist ISO 226 tables.
Below is a basic python function of the same (from ChatGPT. I know, I know 😆)
Edit: Grammatical error
import numpy as np
from scipy.interpolate import interp1d
def db_to_phon_sone(dB, frequency):
"""
Convert dB SPL to phon and sone based on ISO 226:2003 equal-loudness contours.
Parameters:
- dB (float or np.ndarray): Sound pressure level in dB SPL.
- frequency (float or np.ndarray): Frequency in Hz.
Returns:
- phon (float or np.ndarray): Perceived loudness in phons.
- sone (float or np.ndarray): Perceived loudness in sones.
"""
# Standard ISO 226:2003 frequencies (Hz)
iso_freq = np.array([
20, 25, 31.5, 40, 50, 63, 80, 100, 125, 160, 200, 250, 315, 400, 500, 630, 800, 1000,
1250, 1600, 2000, 2500, 3150, 4000, 5000, 6300, 8000, 10000, 12500, 16000, 20000
])
# Equal-loudness contours (dB SPL for each phon level at standard frequencies)
iso_curves = {
0: [76.55, 65.62, 55.12, 45.53, 37.63, 30.86, 25.02, 20.51, 16.64, 13.12, 10.09, 7.54, 5.11, 3.06, 1.48, 0.30, -0.30, -0.01, 1.03, -1.19, -4.11, -7.05, -9.03, -8.49, -4.48, 3.28, 9.83, 10.48, 8.38, 14.10, 79.65],
20: [89.58, 82.65, 75.98, 69.62, 64.02, 58.55, 53.19, 48.38, 43.94, 39.37, 35.51, 31.99, 28.69, 25.67, 23.43, 21.48, 20.10, 20.01, 21.46, 21.40, 18.15, 15.38, 14.26, 15.14, 18.63, 25.02, 31.52, 34.43, 33.04, 34.67, 84.18],
40: [99.85, 93.94, 88.17, 82.63, 77.78, 73.08, 68.48, 64.37, 60.59, 56.70, 53.41, 50.40, 47.58, 44.98, 43.05, 41.34, 40.06, 40.01, 41.82, 42.51, 39.23, 36.51, 35.61, 36.65, 40.01, 45.83, 51.80, 54.28, 51.49, 51.96, 92.77],
60: [109.51,104.23, 99.08, 94.18, 89.96, 85.94, 82.05, 78.65, 75.56, 72.47, 69.86, 67.53, 65.39, 63.45, 62.05, 60.82, 59.89, 60.01, 62.15, 63.19, 59.96, 57.26, 56.42, 57.57, 60.89, 66.36, 71.66, 73.16, 68.63, 68.43, 104.92],
80: [118.99,114.23,109.65,105.34,101.72, 98.36, 95.17, 92.48, 90.09, 87.82, 85.92, 84.31, 82.89, 81.68, 80.86, 80.17, 79.67, 80.01, 82.48, 83.74, 80.59, 77.88, 77.07, 78.31, 81.62, 86.81, 91.41, 91.74, 85.41, 84.67, 118.95],
100:[128.41,124.15,120.11,116.38,113.35,110.65,108.16,106.17,104.48,103.03,101.85,100.97,100.30, 99.83, 99.62, 99.50, 99.44,100.01,102.81,104.25,101.18, 98.48, 97.67, 99.00,102.30,107.23,111.11,110.23,102.07,100.83,133.73]
}
# Convert to numpy arrays for efficient computation
phon_levels = np.array(sorted(iso_curves.keys()))
phon_curves = np.array([iso_curves[phon] for phon in phon_levels])
# Interpolators for phon estimation
phon_interpolator = interp1d(iso_freq, phon_curves, axis=1, fill_value="extrapolate")
db_to_phon_interpolator = interp1d(phon_curves, phon_levels, axis=0, fill_value="extrapolate")
# Ensure inputs are within realistic ranges
dB = np.asarray(dB)
frequency = np.asarray(frequency)
if np.any(dB < -10) or np.any(dB > 140):
raise ValueError("dB SPL values should be in the range -10 to 140 dB.")
if np.any(frequency < 20) or np.any(frequency > 20000):
raise ValueError("Frequencies should be in the range 20 Hz to 20 kHz.")
# Get interpolated phon values for given frequency
phon_values = phon_interpolator(frequency)
# Convert dB to phon
phon = db_to_phon_interpolator(dB, phon_values)
# Clamp phon values within known limits (0 to 100 phons)
phon = np.clip(phon, 0, 100)
# Convert phon to sone
sone = np.where(phon < 40, (phon / 40) ** 2.86, 2 ** ((phon - 40) / 10))
return phon, sone
PyDSM has ISO 226 already implemented.
Thanks for the references, but as can be seen from Post #15,472 I have already come up with a method that I intend using. It is based directly on information contained in the latest 2023 version of ISO 226.
Out of interest I have had a look at the references you have provided but they don't really deliver what is required. They are also based on the earlier 2003 version of ISO 226 which contains data that has now been updated, and they arbitrarily add in data points for frequencies between 12500 Hz and 20000 Hz which have not been validated experimentally. I much prefer my method... 🙂.
I am not aware of any program that plots that plots equal loudness
Hornresp might be the first to do it, then... 🙂.
I wonder how knowing the phone leves helps designing loudspeakers.
-Optimizing for a specific phone range for which the speaker is intended to use? To have a reference, Is there a typical/standard phone level where professional produced music is mixed at?
-Optimizing for a specific phone range for which the speaker is intended to use? To have a reference, Is there a typical/standard phone level where professional produced music is mixed at?
@David McBean I recently took measurements of various damping materials in a transmission line.
My first question is, is there a chance that in the future it will be possible to simulate damping with either polyurethane foam or BASF Basotect melamine foam?
My second question is the possibility of Hornresp to simulate an additional tunnel branch that can serve as a quarter-wave attenuator? This is the concept I presented in the PDF I added to the post below.
Attachments
Assuming you mean audio level, the mixing is done at an electronic signal level that keeps the signal in the optimal range. Too low, and the signal to noise ratio suffers, as the noise floor is closer to the signal level.I wonder how knowing the phone leves helps designing loudspeakers.
-Optimizing for a specific phone range for which the speaker is intended to use? To have a reference, Is there a typical/standard phone level where professional produced music is mixed at?
Too high, and the signal peaks get clipped, as the preamp and amplifier circuitry cannot handle them.
Loudspeakers, however, are designed for acoustic volume levels. There the choice comes down to intended use and room size and conditions, and user preferences - i.e. how loud do you want it to be. If you have a small loudspeaker in a big hall, the sound won't be loud enough, and turning up the volume too much will overdrive the loudspeaker into non-linear regions, creating distortion. If you have a big louspeaker in a small room, you'll have to keep the volume turned down very low, and the tiny imperfections in the suspension and construction will become noticeable. A good rule of thumb is to pick a louspeaker such that your loudest listening level is about 80% of the loudest sound that the loudspeaker is capable of producing.
A separate category is guitar amplifiers which are designed to be overdriven to produce carefully controlled distortion in order to enhance the guitar sound.
- Home
- Loudspeakers
- Subwoofers
- Hornresp