Hmmmm...with HF phase should asymptotically approaching -90deg, the HF slope of the amplitude response should be -6dB/oct, not the -12dB/oct in the text file you posted....Just for the record, the phase and group delay results calculated by Hornresp for the posted example, are attached.
My guess is that the text file you posted contained the power response. But the phase response and group delay you are showing is for the on-axis pressure response. I recall discussing this with you many years ago, that acoustic power response does not really have an associated phase response since it is a summation of intensity magnitude on a sphere surrounding the loudspeaker. But rather than not giving a phase response at all, the next best thing was to show the phase of the pressure response. I still think that is a reasonable thing to do, but might be good to make it clear in the title that the phase is for the pressure response not the power response.
Poking about with Hornresp tonight, I noticed that when using the directivity tool, the phase response does not show the flipping polarity for the off-axis lobes. For example, if you use the Hornresp default driver with 350 cm^2 area in a closed box, the phase response for pressure response looks the same for power response, on-axis, and 30deg off-axis.


The phase for 30deg off axis should look something like the lower plot below.

NOTE
The above phase response is an example of non-minimum phase behavior, so could not be calculated from the magnitude response.

I guess the examples I have seen probably also didn't meet this criteria.The above phase response is an example of non-minimum phase behavior, so could not be calculated from the magnitude response
But yeah, one has to question if the system still follows the minimum phase behavior.
Aka, the system works as a perfectly predictable piston. (mass-spring-damper system)
Otherwise the whole obviously thing doesn't work.
Sometimes it can be very tricky to find out of a system still behaves like that as you just mentioned.
Anything that is acoustic related (resonances, standing waves, interference etc) can ruin this entirely.
My guess is that the text file you posted contained the power response.
As always, you guess correctly 🙂.
But rather than not giving a phase response at all, the next best thing was to show the phase of the pressure response. I still think that is a reasonable thing to do, but might be good to make it clear in the title that the phase is for the pressure response not the power response.
After the discussion you refer to, I decided to explain it in the Help File rather than add to what was already sometimes a reasonably long chart heading. For the sake of consistency I also wanted the heading in the Loudspeaker Wizard to be similar to the one on the main chart (the available space in the wizard being somewhat less if the chart width was not to be exceeded).
The Help File phase response description currently reads: "Phase-angle difference in degrees between the input signal voltage and the output sound pressure of a loudspeaker system, versus frequency in hertz."
I noticed that when using the directivity tool, the phase response does not show the flipping polarity for the off-axis lobes.
The phase response is currently calculated at the same time as the power response. To now modify Hornresp to calculate phase for off-axis angles when the Directivity tool is selected would require a lot of work, which unfortunately I am not in a position to undertake. I could however perhaps amend the Help File description to read: "Phase-angle difference in degrees between the input signal voltage and the on-axis output sound pressure of a loudspeaker system, versus frequency in hertz."
I realise that the above approach is far from ideal...
If you have subwoofer drivers that have low THD and IMD you can crossover at about 160 hertz if your filter is 8th order. The idea of localization is based more on the low frequency woofer having a high harmonic content and you hearing the harmonics. I have done what I mentioned in many many systems on products that I design. You take the bulk of the bass and kick drum away from your main speakers and the greater clarity is readily discernible.David or Gumbo, you mentioned above that your multi-cell horn would have a lower cutoff of about 100 or so. I have a couple of questions for you:
First, because directionality is lost below about 80Hz, or put another way, because we sense directionality or source of sound beginning at about 80Hz, many I speak to have a rule to limit their subs to below 80Hz, and their MidBass or Mids to begin at 80Hz. Might it be possible to take your horn down to 80Hz so we don't have to plug the gap with a single driver just to carry the 80-160 octave? or the 80-250 band?
And secondly, there are lots of us that like the clarity or transparency of AMT Planars, and there are a 3-4 popular models that go down to 150Hz, but they tend to be of lower sensitivity, about 91dB, while bass horns are regularly in the 97+ range. So, just in case, might it be possible to keep in mind AMT-Planars by including a throat option that would enable a 4.5" wide by 9" high (the size several of the AMTs are) so they could be attached to the horn?
Admittedly, these are two different issues, but it would sure be nice to address the problem. Thanks for considering.
Yes and no. Every driver has inductance and it does skew the whole design process. So are you basically saying design blind and then see what happens? I guess it is hard to incorporate the inductance into the calculation?I guess that's the Le we're looking at.
I personally always design without Le first. Reason being that it sometimes can give a bit of a skewed impression about what's possible from a system design perspective.
It also makes it sometimes very difficult to compare different speakers.
In this case it gave a bit of a false impression of what was really going on because of that 6dB/oct (kinda) initial slope.
After I am satisfied with a certain design, I will add the Le to see if it messes anything up.
Huh?Yes and no. Every driver has inductance and it does skew the whole design process. So are you basically saying design blind and then see what happens? I guess it is hard to incorporate the inductance into the calculation?
exaclty!the low frequency woofer having a high harmonic content and you hearing the harmonics
cross over a (lousy) subwoofer at 80 Hz and you will still be able to localize it because of it's loud harmonic distorsion output.
That works for me 🙂...The Help File phase response description currently reads: "Phase-angle difference in degrees between the input signal voltage and the output sound pressure of a loudspeaker system, versus frequency in hertz."
I'm not sure how important it is for most users, it was just something I noticed that I wasn't sure if it was a bug or not.The phase response is currently calculated at the same time as the power response. To now modify Hornresp to calculate phase for off-axis angles when the Directivity tool is selected would require a lot of work, which unfortunately I am not in a position to undertake. I could however perhaps amend the Help File description to read: "Phase-angle difference in degrees between the input signal voltage and the on-axis output sound pressure of a loudspeaker system, versus frequency in hertz."
I realise that the above approach is far from ideal...

I'm assuming you use the standard directivity function shown in the {...} in the formula above to calculate your off-axis response. If so, you may find it simple enough to incorporate the phase calcs for off-axis response. All you have to do is take the sign of this directivity function and invert the phase(ie add 180deg) of the on-axis phase-angle response any frequencies where the sign negative. That's all there is to it. Feel free to contact me off list if you want to pursue and have any questions.
Last edited:
The REW measurement system has a method using minimum phase to calculate excess group delay to determine which peak/dips in your response are caused by room modes.Sometimes it can be very tricky to find out of a system still behaves like that as you just mentioned.
Anything that is acoustic related (resonances, standing waves, interference etc) can ruin this entirely.
https://www.roomeqwizard.com/help/help_en-GB/html/minimumphase.html#top
I'm assuming you use the standard directivity function shown in the {...} in the formula above to calculate your off-axis response.
For direct radiators, yes.
All you have to do is take the sign of this directivity function and invert the phase(ie add 180deg) of the on-axis phase-angle response any frequencies where the sign negative.
Thanks. I think it is probably safer for me to just further refine the phase description entry in the Help file by including the qualifier "on-axis", as foreshadowed in my previous message, and leave it at that. If off-axis phase was to be added for direct radiators, then for the sake of completeness and consistency I would want to include it for horns as well, which would complicate things greatly in all sorts of ways!
exaclty!
cross over a (lousy) subwoofer at 80 Hz and you will still be able to localize it because of it's loud harmonic distorsion outpu
In my experience high values of Qms help a lot in this regard (crossing the woofer/sub higher). Unfortunately, woofers of such nature are increasingly hard to find, at least among current pro/P.A. production.If you have subwoofer drivers that have low THD and IMD you can crossover at about 160 hertz if your filter is 8th order. The idea of localization is based more on the low frequency woofer having a high harmonic content and you hearing the harmonics. I have done what I mentioned in many many systems on products that I design. You take the bulk of the bass and kick drum away from your main speakers and the greater clarity is readily discernible.
These days, with a very few exceptions, they all design for "big motors", which IMHO have more negatives than positives in a quality oriented setup.
I guess that's one of the drawbacks of living in the digital age, when power amps are a few cents per watt.
If off-axis phase was to be added for direct radiators, then for the sake of completeness and consistency I would want to include it for horns as well, which would complicate things greatly in all sorts of ways!
You like challenging and pushing Hornresp to its limits making everyone happy, why not one more 🙂
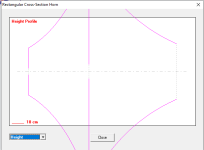
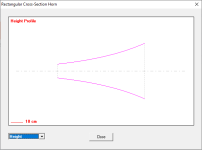
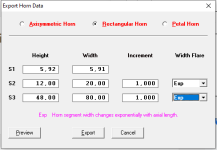
The preview "bug" appears only on the two segments horn. See attachments 1 and 2 where the horn preview is correct.
Second question which I asked previously with regards to correct represetation of the profile in the preview window:
- the 10mm scale is indeed approx 10mm on my screen (measured with a digital caliper). However the horn is 70mm long instead of the expected 75. The approximation is acceptable as long as it is only on the preview.
But here are two problems which worry me more.
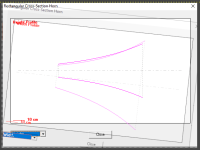
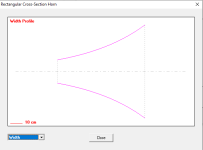
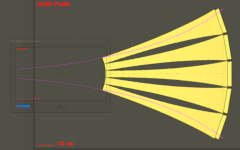
1, the "flare" (the actual curvature) of the width profile differs from that of the height. Attached picture (3.png) where the two profiles (height and width) are overlapped to show the different "flare".
2, Since a Multicell horn consists of an array of identical small square exp horns, the width "flare" (profile) is the same as the height flare/profile. They can't be different. As a result the actual array, has a totally different "flare" (profile) than what is previewed in Hornresp.
See attachment 4.png where I overlapped a screenshot of the 3d model of the array and the width preview of the "array" as calculated by hornresp.
Also consider that the 3D model actually has the same S1, S2 and lenght, but with an Hyperexp profile, since the exp profile resulted in much too narrow dispersion. If the 3D model would be modeled on the exp data the difference with the profile previewed in hornresp would be even bigger.
Now I would like to make sure that this is just a "graphical" flaw, (or impossibility for the software to display an exact representation of horns of such type), This would not be a problem as long as the rest of the output is correct (power response etc.). However, due to the nature of the problem I doubt the dispersion pattern calculated by hornresp will actually match that of the "phisical" array.
Also I am not sure wether it makes sense to try to match F12 and F23 when the actual phisical horn profiles differs from the one calculated by hornresp. See attachment 5.png
PS.
Attachment 5.png was composed by overlapping screenshots of S1-2 and S2-3, due to the preview bug which prevents display of the whole two segments horn,
Second question which I asked previously with regards to correct represetation of the profile in the preview window:
- the 10mm scale is indeed approx 10mm on my screen (measured with a digital caliper). However the horn is 70mm long instead of the expected 75. The approximation is acceptable as long as it is only on the preview.
But here are two problems which worry me more.
1, the "flare" (the actual curvature) of the width profile differs from that of the height. Attached picture (3.png) where the two profiles (height and width) are overlapped to show the different "flare".
2, Since a Multicell horn consists of an array of identical small square exp horns, the width "flare" (profile) is the same as the height flare/profile. They can't be different. As a result the actual array, has a totally different "flare" (profile) than what is previewed in Hornresp.
See attachment 4.png where I overlapped a screenshot of the 3d model of the array and the width preview of the "array" as calculated by hornresp.
Also consider that the 3D model actually has the same S1, S2 and lenght, but with an Hyperexp profile, since the exp profile resulted in much too narrow dispersion. If the 3D model would be modeled on the exp data the difference with the profile previewed in hornresp would be even bigger.
Now I would like to make sure that this is just a "graphical" flaw, (or impossibility for the software to display an exact representation of horns of such type), This would not be a problem as long as the rest of the output is correct (power response etc.). However, due to the nature of the problem I doubt the dispersion pattern calculated by hornresp will actually match that of the "phisical" array.
Also I am not sure wether it makes sense to try to match F12 and F23 when the actual phisical horn profiles differs from the one calculated by hornresp. See attachment 5.png
PS.
Attachment 5.png was composed by overlapping screenshots of S1-2 and S2-3, due to the preview bug which prevents display of the whole two segments horn,
Attachments

The reason why I am asking if the calculations are reliable, is due to the fact that as you can see the angle of the single cells is too narrow when compared to the 15 to 18 degrees which is considered ideal for multicells. In order to improve on these figures the single cells (and the array as a result) must be made either shorter or with a smaller throat (so the single cells rest on a bigger angle one another). Both of these solutions result in a higher F23. However, according to hornresp power response figures, this can be compensated by lowering F12 (for example F12=70Hz and F23=150Hz).
For this reason it is extremely important to understand if the calculations are reliable, other than the "graphical" flaws/inconsistencies which I dont think should affect much the simulation, other than (probably) the dispersion figures.
One of these horns consists of 60+4 triangles, so I'd rather avoid the "try and see what happens" option, if possible 😉
@ David I am looking into matching the two segments as per your suggestion, however I just run again into the bug with the height profile preview. Picture attached. This time I am using updated version (54.70).
Could you please export the record causing the problem and post the .txt file as an attachment so that I can investigate further. Thanks.
why not one more 🙂
... For the following reasons:
1. The Hornresp horn directivity models are relatively simple with the off-axis responses being indicative only.
2. The off-axis phase response results produced by the feature would therefore in most cases be not particularly accurate.
3. While off-axis phase might be of theoretical interest I suspect that the feature would get very little use in practice.
4. Implementing the feature would require a lot of work for questionable benefit.
In other words, "it's not going to happen"... 🙂
Second question which I asked previously with regards to correct represetation of the profile in the preview window:
- the 10mm scale is indeed approx 10mm on my screen (measured with a digital caliper). However the horn is 70mm long instead of the expected 75.
Rest assured, the schematic diagram is drawn to scale both horizontally and vertically, so that the profiles are accurately represented. The scale used is shown by the red line. The actual physical length of the scale line will vary depending upon the size of the system being displayed.
For example, if you physically accurately measure the length of the 10 cm red scale line on your monitor screen and find it to be say 1.55 cm long, and the horn displayed on the monitor has an actual physical axial length of 120 cm and the monitor itself is linear and has no scale distortion, then you if you measure the length of the horn on the screen you would find that it is 1.55 * 120 / 10 = 18.6 cm long.
Another way to look at it, as explained in Post #13,853, is that the horn shown on the screen will be 18.6 / 1.55 = 120 / 10 = 12 times longer than the red 10cm line.
I repeat, you don't need to worry about the schematic diagram scaling - it is correct.
1, the "flare" (the actual curvature) of the width profile differs from that of the height.
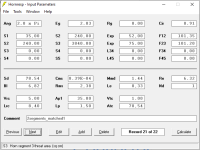
Can you please post a screenprint showing the settings you are using. A copy of the settings form is attached.
Also I am not sure wether it makes sense to try to match F12 and F23 when the actual phisical horn profiles differs from the one calculated by hornresp. See attachment 5.png
The area expansion rates assume plane wavefronts. Your attachment shows that the mouth of segment 1 in your proposed design is actually slightly convex. The effect on measured performance will be negligible.
Attachments

"it's not going to happen"
We need to make this phrase immortal.
Lets find another challenging so.
- Home
- Loudspeakers
- Subwoofers
- Hornresp