I tested 10 situations between 20 and 100Hz with completely random frequencies... But always keeping 10 tests... kkkkkkk 20 to 100Hz step 10Hz and one completely random frequencyI thought that I had checked your method against all the situations listed in Post #13,776, but apparently not. Out of interest, what were the 10 frequencies used between 20 Hz and 100 Hz?
Last edited:

Attached there is the inputdata
Attaching the correct input data file 😀
Attachments
I've updated my spreadsheet to generate 100 different combinations of Vb, Ap, and predicted Lp to achieve a target Fb, to check them against equivalent Hornresp sims. Most of the predictions seem to end up pretty close. The spreadsheet allows you to try different values for the constants as well.
Attachments
Vb Fb Vp/Vt original modified sim (orig.) sim (mod.) 30 40 0.12 43.3 41.6 38.9 Hz 39.5 Hz 100 40 0.01 7.8 7.8 39.5 Hz 39.5 Hz
The results don't look too bad. Pretty decent in fact.
My apologies, I made an error in my Hornesp sims when originally checking the above two examples. I thought that the results were way off but you have shown they were as good as any of the others. Your c = 344, k = 274.496, ec = 1.462 and cf = 0.3 values would appear to be the ones to use!
Last edited:
I've updated my spreadsheet to generate 100 different combinations of Vb, Ap, and predicted Lp to achieve a target Fb, to check them against equivalent Hornresp sims.
Brian, would it be possible for you to post your spreadsheet as an .xls file so that I can open it in my ancient Excel 2003? Many thanks!
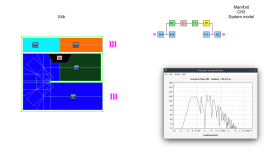
Would it be possible for you to check the X5b simulation and give me some tip/foot print regarding the high group delay value around tuning frequency?
The high group delay seems to be an inherent characteristic of the CH3 topology. Changing dimension values appears to have very little effect.
I think it may not be trivial to understand what is happening.
I have to agree with you there 🙂.
Group delay is directly proportional to the slope/shape of the systems freq resp and its phase.The high group delay seems to be an inherent characteristic of the CH3 topology. Changing dimension values appears to have very little effect.
Glad to see that the changes I made to the formula for port length worked for you and you are using it in your spreadsheets. I made the changes onluy because you pointed out the right way where Vb and Vp should be used in the formula. I have some other suggestions for formulas to use in other specific situations, and also some questions about what formula you use for some situations. I want to know if you find it interesting to exchange this type of info with me.I've updated my spreadsheet to generate 100 different combinations of Vb, Ap, and predicted Lp to achieve a target Fb, to check them against equivalent Hornresp sims. Most of the predictions seem to end up pretty close. The spreadsheet allows you to try different values for the constants as well.
I've attached an XLS version.Brian, would it be possible for you to post your spreadsheet as an .xls file so that I can open it in my ancient Excel 2003? Many thanks!
I did find a spanner in the works though, albeit a small one. Above a certain point, the value for Lrc also influences Fb, at least in the Hornresp sim. As it starts to get large, Fb shifts downwards.
e.g. Given:
| Vrc | 37.6 | litres |
| Ap | 128.0 | cm^2 |
| Lpt | 106.8 | cm |
This shows how Fb shifts with changing Lrc (according to Hornresp):
| Lrc | Fb | Arc | Ap/Arc | Lp/Lrc |
| 15 | 27.6 | 2506.7 | 5.1% | 712% |
| 65 | 27.2 | 578.5 | 22.1% | 164% |
| 90 | 26.8 | 417.8 | 30.6% | 119% |
| 110 | 26.4 | 341.8 | 37.4% | 97% |
| 125 | 26.1 | 300.8 | 42.6% | 85% |
| 140 | 25.7 | 268.6 | 47.7% | 76% |
| 155 | 25.3 | 242.6 | 52.8% | 69% |
| 170 | 25.0 | 221.2 | 57.9% | 63% |
| 180 | 24.6 | 208.9 | 61.3% | 59% |
| 190 | 24.3 | 197.9 | 64.7% | 56% |
| 205 | 23.9 | 183.4 | 69.8% | 52% |
| 215 | 23.6 | 174.9 | 73.2% | 50% |
| 225 | 23.3 | 167.1 | 76.6% | 47% |
Attachments
I've attached an XLS version.
Excellent, thanks.
Above a certain point, the value for Lrc also influences Fb, at least in the Hornresp sim. As it starts to get large, Fb shifts downwards.
That's because the chamber is no longer acting as a simple acoustic compliance. As Lrc increases the chamber starts to display transmission line characteristics. The Fb values can be kept constant by selecting the 'chamber resonances masked' option, but this then means that although the predicted Fb will be close to the design Fb, the actual measured Fb will be somewhat different because the method being used to calculate Lpt assumes that Vb (Vrc) is a pure compliance.
Group delay is directly proportional to the slope/shape of the systems freq resp and its phase.
Just to clarify, group delay is the negative derivative of phase, and is calculated from phase only.
(Impulse response is calculated from freq resp and phase).
I've updated my spreadsheet to generate 100 different combinations of Vb, Ap, and predicted Lp to achieve a target Fb, to check them against equivalent Hornresp sims. Most of the predictions seem to end up pretty close.
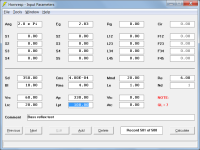
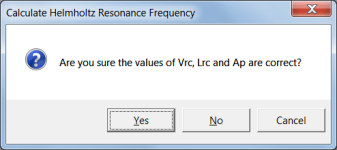
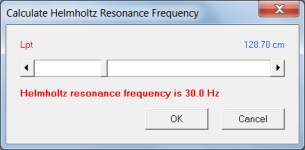
I had completely forgotten that a tool already exists in Hornresp to find the value of Lpt necessary to achieve a given Fb, and that it is 100% accurate, not just pretty close! The tool can be activated by highlighting the Lpt input box in Edit mode and selecting the Tools > Calculate Parameter menu commands. It can also be activated by double-clicking on the Lpt input box.
Simply adjust the Lpt slider until the desired resonance frequency is obtained.
Attachments
Yes, although technically you can determine it from the response as well.Just to clarify, group delay is the negative derivative of phase, and is calculated from phase only.
(Impulse response is calculated from freq resp and phase).
I have done this in the past very often.
Granted, this only works for response that is without weird artifacts and bumps.
Once you know the steepness/slope, as wel as the Q factor, there is only one option available basically.
Point is, they are directly connected.
So it doesn't surprise me that the group delay of that specific system can't be changed much.
Yes, although technically you can determine it from the response as well
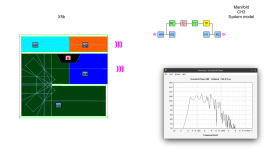
Take a look and the Phase comparison between the models X4b and X5b, they ate basically the same in the 40hz~60Hz range but the group delay is much higher for X5b.
Those models are basically the same things the main difference is at back horn, while at X4b the driver is positioned more close to the throat, for X5b the drive is positioned more close to the mouth.
Attachments
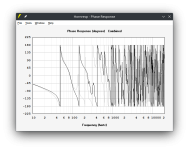
What are we comparing in terms of group delay, the grey line and the black line?Take a look and the Phase comparison between the models X4b and X5b, they ate basically the same in the 40hz~60Hz range but the group delay is much higher for X5b.
We are talking about two different things here.
As I already said before I was talking about the total system group delay, not local peaks and dips.
Those are two separate things.
The overal group delay of a higher order system (let's just take a 2nd order for simplicity) is overal the same, except for around the Fs point.
Which is determined by the Q-factor of the system.
So small changes in the group delay can still happen (similar like a EQ filter), but the overal group delay stays the same.
I thought we were talking about the overall group delay, not local peaks.
In such systems the group delay can be quite erratic sometimes, as is shown in your graphs.
(which again follows the phase as well as the freq resp)
What are we comparing in terms of group delay, the grey line and the black line?
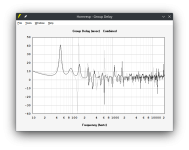
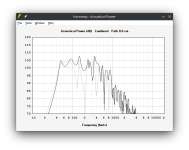
Yes, and in the previous post there was another box model comparison, a tapped horn, and the Claus Futtrup curve as comparison too. Take a look and the attached image with Claus Futtrup added in the chart (green and red curve). as you can see the black curve from X5b exceed both Claus Futtrup curves, while X4b is in between.
So I asked David and interested colleagues what could explain the peak amplitude for group delay ~49Hz for the X5b model that we do not see from TH-SS1 nor from X4b, I mean, the peak are there at tuned frequency but the amplitude are very different, almost double for X5b.
Compare the freq response, they are drastically different and very erratic as well.So I asked David and interested colleagues what could explain the peak amplitude for group delay ~49Hz
Therefor, the phase = group delay MUST be different as well.
The exact details in sense of the system design, I don't know.
Yup, but it's an iterative tool (you need to adjust a slider to achieve a target Fb), rather than a tool that will just give you the required Lpt for a given Fb in one step (e,g. an equation). I'm not knocking iteration - it's a great method for resolving cases that involve complex calculations (I used it in the Optimization routines in my BOXPLAN workbooks, for example, and it was the method I suggested for finding optimum Fb for a 4th order BP alignment with driver's Le considered).I had completely forgotten that a tool already exists in Hornresp to find the value of Lpt necessary to achieve a given Fb, and that it is 100% accurate, not just pretty close! The tool can be activated by highlighting the Lpt input box in Edit mode and selecting the Tools > Calculate Parameter menu commands. It can also be activated by double-clicking on the Lpt input box.
Simply adjust the Lpt slider until the desired resonance frequency is obtained.
I am designing a two segment exponential horn. Input parameters picture attachment 1.png
I have to make this horn rectangular, preview the profile and export the data to csv/txt, so I calculate > Schematic Diagram > File > Export > Horn Data.
In the export Horn Data windows I select Rectangular Horn. Picture attachment 2.png
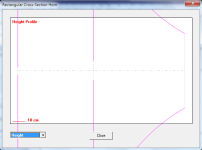
When I go to preview the Width profile is ok attachment 3.png
but the height profile is all messed up. Attachment 4png.
What am I doing wrong ?
I have to make this horn rectangular, preview the profile and export the data to csv/txt, so I calculate > Schematic Diagram > File > Export > Horn Data.
In the export Horn Data windows I select Rectangular Horn. Picture attachment 2.png
When I go to preview the Width profile is ok attachment 3.png
but the height profile is all messed up. Attachment 4png.
What am I doing wrong ?
Attachments


What am I doing wrong ?
What version of Hornresp are you using?
- Home
- Loudspeakers
- Subwoofers
- Hornresp