i found that style of construction sounds often better then putting it on a pcb. this is particular true for low level circuits.
Dear Joachim
Is this "i" correct? 🙂
(This night is going to be long)
Regards
George
PS> Ref. attachments, I've turned to jazz music now, so, I see things clearer now🙂🙂
it looks cool what you build and what whould i be without the ocassional bottle of wine ?
Is this "i" correct? 🙂
(This night is going to be long)
Regards
George
PS> Ref. attachments, I've turned to jazz music now, so, I see things clearer now🙂🙂
Attachments
Last edited:
 Many dead bugs.
Hi all
Forgive me for not responding all these days, but I was really offset from the "normal" activities (i.e. diy is considered an "ab-normal" activity ).
).
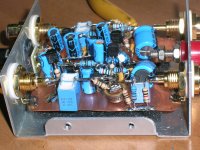
Thank you Salas and Joachim for your kind words about my "housed" circuit that I showed you at posts #80 and #83.
I completed the DC and the AC measurements on the circuit (see 2 first attachments). As you can see, the circuit is a bit stuffed.
I couldn't get rid of the Cdom. It oscillated without it, regardless from the addition of C8, C9 and R10 (each of them made thinks better, but didn't eliminate the oscillation which on this implementation was at around 12MHz).
As Cdom I tried many small caps, but up to 470pF there was no effect. The next higher value that I had was the 1nF, which was adequate to kill the bloody pendulum.
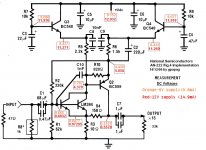
As I understand, this circuit oscillates due to the fact that whatever is connected to it's output is in series with the feedback resistors R3 , R4.
A plain series small resistor at the output or a simple buffer might clear things up and make all the added components obsolete (unfortunatelly, I didn't try any of these two solutions, as I thought of them now, that I was editing the schematic )
)
As it is now, the circuit is unconditionally stable.
It doesnt ring, nor oscillates, whatever I do to it's inputs or outputs or to the PSU input.
That's good. It sounds good too😀
George
Forgive me for not responding all these days, but I was really offset from the "normal" activities (i.e. diy is considered an "ab-normal" activity
).Thank you Salas and Joachim for your kind words about my "housed" circuit that I showed you at posts #80 and #83.
I completed the DC and the AC measurements on the circuit (see 2 first attachments). As you can see, the circuit is a bit stuffed.
I couldn't get rid of the Cdom. It oscillated without it, regardless from the addition of C8, C9 and R10 (each of them made thinks better, but didn't eliminate the oscillation which on this implementation was at around 12MHz).
As Cdom I tried many small caps, but up to 470pF there was no effect. The next higher value that I had was the 1nF, which was adequate to kill the bloody pendulum.
As I understand, this circuit oscillates due to the fact that whatever is connected to it's output is in series with the feedback resistors R3 , R4.
A plain series small resistor at the output or a simple buffer might clear things up and make all the added components obsolete (unfortunatelly, I didn't try any of these two solutions, as I thought of them now, that I was editing the schematic
)As it is now, the circuit is unconditionally stable.
It doesnt ring, nor oscillates, whatever I do to it's inputs or outputs or to the PSU input.
That's good. It sounds good too😀
George
Attachments
Part 2
Besides of being non oscillating, it is very quite.
Noise measurement : 0.024mVpp (0.0085mVrms) broadband noise
Configuration:
Input to ground:47R
Output to ground:33K, PSU: 9V Alkaline battery.
Noise measured with oscilloscope (1mVpp/division=0.2mVpp/small division) .
Input noise amplitude: 0.8 small division=0.176mVpp
Output noise amplitude:1.0 small division=0.2mVpp
Output-Input noise amplitude:0.024mVpp=0.0085mVrms
Due to small noise amplitude and methodology used (+/- 0.1 small division), noise measured can be between 0.012mVpp and 0.036mVpp (0.004mVrms to 0.013mVrms).
Distortiom Measurement
Configuration:
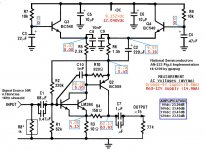
Input connected to signal source (50R, 4.16mVrms 1KHz sinusoidal).
Output to ground:33K
PSU: 9V Alkaline battery.
Distortion measured with dual channel oscilloscope in differential mode (channel 1:circuit output signal, channel 2:circuit input signal).
Both oscilloscope channels adjusted for equal trace amplitude, then one channel inverted and through the ADD mode, screen shows the difference of the two channels.
Any signal which has a time period a fraction of the fundamental’s period, is a distortion signal. (½period = 2nd harmonic, 1/3=3rd harmonic ect).
By comparing the amplitude of the harmonic signal with the amplitude of the fundamental signal, percentage (%) distortion measurement can be accomplished.
So, for 0.2 Vert. Division harmonic and 8 Vert. Division fundamental, distortion equals to 2.5%.
0.4 Vert. Division harmonic and 8 Vert. Division fundamental equals 5%distortion.
0.6 Vert. Division harmonic and 8 Vert. Division fundamental equals 7.5%distortion.
0.8 Vert. Division harmonic and 8 Vert. Division fundamental equals 10%distortion and so on.
This method is cumbersome and time consuming but – within it’s resolution limits - it offers to the hobbyist the advantage of making distortion measurements without having to know the distortion figure of the signal source, as it is a relative measurement. Also, a tuned notch filter is not required.
Using the figure of clipped output waveform to set qualitatively the signal amplitude where clipping starts is not very precise. It is a bit better to use Lissajous figure (X-Y mode). For this preamplifier, clipping initiation is not easy to define, as the feedback signal skews the picture.
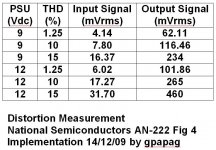
Therefore I made a set of distortion measurements for 9Vdc PSU and another one for 12Vdc PSU (see attachment). Each set has data for 1.25%THD (the lowest I can measure due to the high output of my signal source), 10% THD (quite high value, but not producing visibly distorted output waveform) and 15% THD (where lower corners of waveform are distorted).
At all three levels of distortion, the THD figure is almost 2nd harmonic (I could not see any 3rd or higher order waveform on the screen).
What is also encouraging is that with 9Vdc PSU, the 1.25%THD (anything between 1% and 1.5% actually) is occurring at signal input which is 13.8 times higher (22.8db headroom rel. 1KHz) than the DL-103 output.
I expect that at realistic signal levels of 0.3mV- 1mV the distortion will be sub 0.1%, really negligible (not that I bother with 1% 2nd ).
).
This is for now. Thank you all and have a good time
Best Regards
George
Besides of being non oscillating, it is very quite.
Noise measurement : 0.024mVpp (0.0085mVrms) broadband noise
Configuration:
Input to ground:47R
Output to ground:33K, PSU: 9V Alkaline battery.
Noise measured with oscilloscope (1mVpp/division=0.2mVpp/small division) .
Input noise amplitude: 0.8 small division=0.176mVpp
Output noise amplitude:1.0 small division=0.2mVpp
Output-Input noise amplitude:0.024mVpp=0.0085mVrms
Due to small noise amplitude and methodology used (+/- 0.1 small division), noise measured can be between 0.012mVpp and 0.036mVpp (0.004mVrms to 0.013mVrms).
Distortiom Measurement
Configuration:
Input connected to signal source (50R, 4.16mVrms 1KHz sinusoidal).
Output to ground:33K
PSU: 9V Alkaline battery.
Distortion measured with dual channel oscilloscope in differential mode (channel 1:circuit output signal, channel 2:circuit input signal).
Both oscilloscope channels adjusted for equal trace amplitude, then one channel inverted and through the ADD mode, screen shows the difference of the two channels.
Any signal which has a time period a fraction of the fundamental’s period, is a distortion signal. (½period = 2nd harmonic, 1/3=3rd harmonic ect).
By comparing the amplitude of the harmonic signal with the amplitude of the fundamental signal, percentage (%) distortion measurement can be accomplished.
So, for 0.2 Vert. Division harmonic and 8 Vert. Division fundamental, distortion equals to 2.5%.
0.4 Vert. Division harmonic and 8 Vert. Division fundamental equals 5%distortion.
0.6 Vert. Division harmonic and 8 Vert. Division fundamental equals 7.5%distortion.
0.8 Vert. Division harmonic and 8 Vert. Division fundamental equals 10%distortion and so on.
This method is cumbersome and time consuming but – within it’s resolution limits - it offers to the hobbyist the advantage of making distortion measurements without having to know the distortion figure of the signal source, as it is a relative measurement. Also, a tuned notch filter is not required.
Using the figure of clipped output waveform to set qualitatively the signal amplitude where clipping starts is not very precise. It is a bit better to use Lissajous figure (X-Y mode). For this preamplifier, clipping initiation is not easy to define, as the feedback signal skews the picture.
Therefore I made a set of distortion measurements for 9Vdc PSU and another one for 12Vdc PSU (see attachment). Each set has data for 1.25%THD (the lowest I can measure due to the high output of my signal source), 10% THD (quite high value, but not producing visibly distorted output waveform) and 15% THD (where lower corners of waveform are distorted).
At all three levels of distortion, the THD figure is almost 2nd harmonic (I could not see any 3rd or higher order waveform on the screen).
What is also encouraging is that with 9Vdc PSU, the 1.25%THD (anything between 1% and 1.5% actually) is occurring at signal input which is 13.8 times higher (22.8db headroom rel. 1KHz) than the DL-103 output.
I expect that at realistic signal levels of 0.3mV- 1mV the distortion will be sub 0.1%, really negligible (not that I bother with 1% 2nd
).This is for now. Thank you all and have a good time
Best Regards
George
Attachments
Because of the very low ac voltage variation (compare to the dc value at the output) even at this a little too low value the results are good enough. By variation of this dc voltage in direction to higher value (as in my simulation) the second harmonic would be reduced, but it is not necessarily say, whether the sonic quality by playback is also perceived as better. Nevertheless an attachement to compare the dc values of both.
Attachments
- Status
- Not open for further replies.
- Home
- Source & Line
- Analogue Source
- Head Pre for Denon DL 103