now, take that lower FFT of the W&F signal and demodulate it and show it in a window. That would be the display sought, that displays the flutter component frequencies directly without having to calculate the difference from fo, those are the contributions to the total flutter. That is directly relatable to the rotational size of the components in the mechanical path, ie which bearing is it, or is it the capstan motor, etc.
Running the test at higher frequencies is needed to test for scrape flutter which is most annoying around 2-5khz. Common to use 12.5khz as the flutter test freq giving you a pass band of 6.25 khz.
In the past I have used the output of my W&F meter (Mincom 8300W) into a HP3561A to see the flutter components. I am anticipating moving the whole thing onto my computer with this setup. Also being able to analyze machines not in my shop with a simple file transfer.
From the descriptions of the software that seems like a trivial thing to do next, but as I said, I have had no time to begin to play with the RTX or the software. I'm lucky to get to check the forum once a day right now.
Cheers
Alan
Scrape Flutter Measurement
@Demian:
Yes, the psychoacoustic “Weighting Curve” is bandlimited to about 0.2Hz ~ 200Hz. It may hide some physically important information such as scrape flutter, which is defined in the AES standard as “…Frequency modulation of the signal in the range above approximately 100 Hz, that is caused by stick-slip motion (stiction) of the tape. It results in distortion which may be perceived as a noise added to the signal – that is, a noise not present in the absence of a signal. Also called ‘friction noise’ or ‘stiction noise’…”.
To bypass that bandlimiting weighting curve, use the unweighted W&F measurement option in MI.
@Alan:
I am not so clear about your first paragraph.
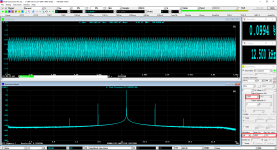
The W&F measurement function in MI is self-contained. Changing the external parameters such as FFT size, window function, overlap ratio, etc. will affect the displayed spectrum in some ways but will not affect the W&F readings. The W&F measurement algorithm in MI is able to detect the carrier frequency automatically. Therefore MI has no problem to measure scrape flutter which normally uses a test frequency above 10 kHz. The following screenshot shows a 12.5kHz carrier frequency modulated by a 3kHz sinewave with a max. frequency deviation of 12.5Hz. Unlike Post #235 which used software level loopback (ideal case), the measurement here was done through RTX6001 hardwired loopback. The measured unweighted peak W&F value is 0.0994% which agrees very well with the theoretical value 12.5Hz / 12500Hz × sin(0.95×90°) = 0.0997%.
BTW, to activate W&F measurement function in MI, right click the spectrum analyzer window and select [Spectrum Analyzer Processing]>”Parameter Measurement”>”Wow and Flutter”. Tick “Unweighted” if you want to do an unweighted measurement. The measured W&F values will be stored in the following two DDPs: WowAndFlutter_A(%) and WowAndFlutter_B(%), and can be displayed using DDP viewers.
@Demian:
Yes, the psychoacoustic “Weighting Curve” is bandlimited to about 0.2Hz ~ 200Hz. It may hide some physically important information such as scrape flutter, which is defined in the AES standard as “…Frequency modulation of the signal in the range above approximately 100 Hz, that is caused by stick-slip motion (stiction) of the tape. It results in distortion which may be perceived as a noise added to the signal – that is, a noise not present in the absence of a signal. Also called ‘friction noise’ or ‘stiction noise’…”.
To bypass that bandlimiting weighting curve, use the unweighted W&F measurement option in MI.
@Alan:
I am not so clear about your first paragraph.
The W&F measurement function in MI is self-contained. Changing the external parameters such as FFT size, window function, overlap ratio, etc. will affect the displayed spectrum in some ways but will not affect the W&F readings. The W&F measurement algorithm in MI is able to detect the carrier frequency automatically. Therefore MI has no problem to measure scrape flutter which normally uses a test frequency above 10 kHz. The following screenshot shows a 12.5kHz carrier frequency modulated by a 3kHz sinewave with a max. frequency deviation of 12.5Hz. Unlike Post #235 which used software level loopback (ideal case), the measurement here was done through RTX6001 hardwired loopback. The measured unweighted peak W&F value is 0.0994% which agrees very well with the theoretical value 12.5Hz / 12500Hz × sin(0.95×90°) = 0.0997%.
BTW, to activate W&F measurement function in MI, right click the spectrum analyzer window and select [Spectrum Analyzer Processing]>”Parameter Measurement”>”Wow and Flutter”. Tick “Unweighted” if you want to do an unweighted measurement. The measured W&F values will be stored in the following two DDPs: WowAndFlutter_A(%) and WowAndFlutter_B(%), and can be displayed using DDP viewers.
Attachments
here is the format I am talking about, this is an Ampex ATR 102 tape recorder, showing the flutter components.

here "DC" is the carrier frequency and the spectral lines are the components of the flutter, the first peak noted is 4 hz and is from the capstan motor.
here "DC" is the carrier frequency and the spectral lines are the components of the flutter, the first peak noted is 4 hz and is from the capstan motor.
Last edited:
FM Demodulation Configuration for Wow and Flutter
Thanks. I understand what you meant now.
If you only want to measure W&F in percentage in MI, there is no need to configure the software to demodulate the signal manually. However, if you want to see the demodulated signal in time domain and frequency domain. Then you will have to configure the demodulation parameters in the oscilloscope manually.
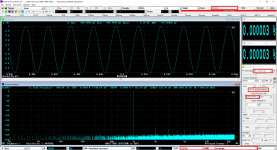
The following screenshot shows a real measurement example of a walkman cassette player (not good in terms of W&F). The test tone is 1 kHz. The measured carrier frequency is 1.031kHz due to speed drift. Ch. A (in Cyan) displays the original W&F signal and Ch. B (in Yellow) displays the demodulated W&F signal. The demodulation parameters are highlighted in the screenshot. In the Spectrum Analyzer, the spectra of both the baseband signal and modulated signal are shown.
Thanks. I understand what you meant now.
If you only want to measure W&F in percentage in MI, there is no need to configure the software to demodulate the signal manually. However, if you want to see the demodulated signal in time domain and frequency domain. Then you will have to configure the demodulation parameters in the oscilloscope manually.
The following screenshot shows a real measurement example of a walkman cassette player (not good in terms of W&F). The test tone is 1 kHz. The measured carrier frequency is 1.031kHz due to speed drift. Ch. A (in Cyan) displays the original W&F signal and Ch. B (in Yellow) displays the demodulated W&F signal. The demodulation parameters are highlighted in the screenshot. In the Spectrum Analyzer, the spectra of both the baseband signal and modulated signal are shown.
Attachments

The THD number is amazing! The width of the skirt of the fundamental seems to suggest that it is not a crystal based oscillator?
I don't want to "bomb" this thread with another information but this design was presented by Linear Technology (AN67 LinearTech application note high performance ultra-pure sine oscillator), Frex took this application note and made a pcb for all.
More information and some more measurements (with other sw) can look here.
In our case, I had serious difficulties to take a THD measurement better than 0.00006% with our Virtins sw, other softwares like ARTA, REW achieved a measurement of 0.000024-0.000030% relative easy.
At the end, I found how can I take the same measurement and with VI pro software. Yes, it was more difficult and I must to discover more information btw various menus.
It might be useful to others to describe what settings you had to change / make in order to achieve such good results with MI.
Of course, it is my pleasure!
At the start, I followed the auto procedure of MI-Pro, with check at autoranging, autoscaling and auto button. Then I pressed the THD1 from the ready presents of MI-Pro.
I am rookie with MI-Pro and start into safe procedure.
With this setup a THD of 0.00009 was the best, a far away from the 0.000024-0.000030% that I had measured a time ago with ARTA-REW.
I saw that the autoranging tends to setup the level to the ±4.472V and FFT set with 131K and Kaiser6.
From my previous measurements of this oscillator, I knew that the best level was the next ±14.14V with Hann and 131K, so I un-checked the autoranging from the ADC setup and manually set the ±14.14V as input RTX level
The next measurement saw THD 0.00006-0.00007%, better but something was missing compares with results from ARTA or REW.
I was thinking that something other is different except the Sampling, Bitdepth, FFT, Wnd.
I saw that the refresh time of ARTA was more slow from VI-Pro, the VI-Pro was more fast at the refreshing.
The following are what I have changed to achieve this result.
The T of Oscilloscope, to achieved a refresh time like ARTA or REW.
Right click on Oscilloscope area and at the Oscilloscope Processing set
4. Digital Filtering to Band Pass (Hz) 20-20000 with Apply to A channel and
1. Inter-Frame Processing to Exponential Average (30%)
At the Spectrum Analyser Properties, set the
2.Inter-Frame Processings to the Expontential Average (30%),
3. Parameter Measurements must THD to be Range 20-20K
Right click on the window of THD measurement and click on DDP Viewer Configuration. Set at Inter-Frame Processing the Exponential Average (30%) and Number of Decimal Places to 6
And voila the THD was done like ARTA-REW!
Of course, it is my pleasure!
At the start, I followed the auto procedure of MI-Pro, with check at autoranging, autoscaling and auto button. Then I pressed the THD1 from the ready presents of MI-Pro.
I am rookie with MI-Pro and start into safe procedure.
With this setup a THD of 0.00009 was the best, a far away from the 0.000024-0.000030% that I had measured a time ago with ARTA-REW.
I saw that the autoranging tends to setup the level to the ±4.472V and FFT set with 131K and Kaiser6.
From my previous measurements of this oscillator, I knew that the best level was the next ±14.14V with Hann and 131K, so I un-checked the autoranging from the ADC setup and manually set the ±14.14V as input RTX level
The next measurement saw THD 0.00006-0.00007%, better
That brings back my earlier question about the autoranging "rules" implemented in MI Pro. How does MI Pro determine the levels to be set at the RTX?
but something was missing compares with results from ARTA or REW.
I was thinking that something other is different except the Sampling, Bitdepth, FFT, Wnd.
I saw that the refresh time of ARTA was more slow from VI-Pro, the VI-Pro was more fast at the refreshing.
The following are what I have changed to achieve this result.
The T of Oscilloscope, to achieved a refresh time like ARTA or REW.
Right click on Oscilloscope area and at the Oscilloscope Processing set
4. Digital Filtering to Band Pass (Hz) 20-20000 with Apply to A channel and
1. Inter-Frame Processing to Exponential Average (30%)
At the Spectrum Analyser Properties, set the
2.Inter-Frame Processings to the Expontential Average (30%),
3. Parameter Measurements must THD to be Range 20-20K
Right click on the window of THD measurement and click on DDP Viewer Configuration. Set at Inter-Frame Processing the Exponential Average (30%) and Number of Decimal Places to 6
And voila the THD was done like ARTA-REW!
Not sure, but that sounds a bit like more averaging reduces THD. That's strange, except if it were THD+N maybe. What am I missing?
Yeap, there is some averaging in the results but the same "cooking" is done and with the others like ARTA, REW but with less menu checking and setup.
About first your question, I haven't any documented answer.
I am at the investigation stage of MI-Pro software, yet!
About first your question, I haven't any documented answer.
I am at the investigation stage of MI-Pro software, yet!
Yeap, there is some averaging in the results but the same "cooking" is done and with the others like ARTA, REW but with less menu checking and setup.
So what exactly does the software do to the data that explains why the THD changes with increased averaging? I guess VIRTINS should know?
I have been burned on this before. If the oscillator isn't exceptionally stable (crystal stable) over time the harmonics move from bin to bin as the frequency shifts then they get much lower since they are spread between bins. Use fewer bins and then the noise obscures everything. You may need to wait 10-20 minutes after starting the oscillator before you can make a measurement, and then it needs to be pretty short (no 16M point FFT's).
Yes, the jittering of test frequency has some effects on THD and THD+N measurement, especially the latter one.
I'm in the habit of allowing test equipment warm up for at least 1/2 hour before use anyway. A habit picked up while working in a calibration lab.
-Chris
-Chris
Lowest THD & THD+N measurable by the software
@lemon
Thanks for your detailed explanation on how you managed to obtain such a low THD. I have repeated your method in a hardwired loopback test of RTX6001 (no EOSC1KV3 oscillator available here). No discernible improvement on THD was observed in my tests, but THD+N improvement was obvious. By switching on/off those processing settings, it was found that the improvement on THD+N is due to the inter-frame exponential average in the oscilloscope, which makes sense. That is, synchronous average in time domain generally reduces noises.
The 20-20kHz Bandpass filtering in time domain may add some artifacts.
I am not sure whether the combination of EOSC1KV3 and RTX6001 can achieve a THD value of 0.00002% ~ 0.00003% or not. In case you want to check the lowest THD value that MI can measure under a certain setting, you can use software loopback or software generated wave files. I attach here three screenshots.
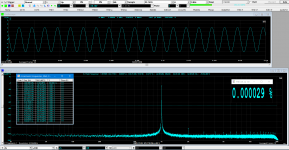
1. Software Loopback THD at 1kHz ([Sampling Rate]/[Signal Frequency] =48000/1000=48. Note that an integer ratio will cause severe correlation between the quantization noise and signal frequency, thus severe artificial harmonics)
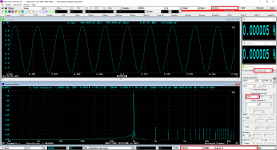
2. Software Loopback THD at 999Hz ([Sampling Rate]/[Signal Frequency] is a non-integer)
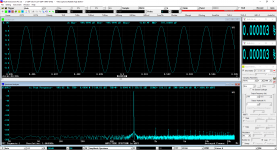
3. Software Loopback THD with No Spectral Leakage (only in this case, the fundamental and harmonics show “Correct” absolute heights in the spectrum analyzer without the help of “Peak Markers”)
The above screenshots show that the lowest measurable THD and THD+N is around 0.000003% (-150dB) under 24-bit, 32768-point FFT in MI.
@lemon
Thanks for your detailed explanation on how you managed to obtain such a low THD. I have repeated your method in a hardwired loopback test of RTX6001 (no EOSC1KV3 oscillator available here). No discernible improvement on THD was observed in my tests, but THD+N improvement was obvious. By switching on/off those processing settings, it was found that the improvement on THD+N is due to the inter-frame exponential average in the oscilloscope, which makes sense. That is, synchronous average in time domain generally reduces noises.
The 20-20kHz Bandpass filtering in time domain may add some artifacts.
I am not sure whether the combination of EOSC1KV3 and RTX6001 can achieve a THD value of 0.00002% ~ 0.00003% or not. In case you want to check the lowest THD value that MI can measure under a certain setting, you can use software loopback or software generated wave files. I attach here three screenshots.
1. Software Loopback THD at 1kHz ([Sampling Rate]/[Signal Frequency] =48000/1000=48. Note that an integer ratio will cause severe correlation between the quantization noise and signal frequency, thus severe artificial harmonics)
2. Software Loopback THD at 999Hz ([Sampling Rate]/[Signal Frequency] is a non-integer)
3. Software Loopback THD with No Spectral Leakage (only in this case, the fundamental and harmonics show “Correct” absolute heights in the spectrum analyzer without the help of “Peak Markers”)
The above screenshots show that the lowest measurable THD and THD+N is around 0.000003% (-150dB) under 24-bit, 32768-point FFT in MI.
Attachments
Window function recommended for THD and THD+N measurement
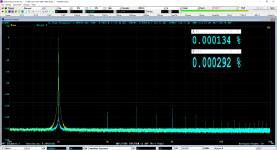
Previously I thought that the wide skirt of the fundamental in Post#366 was due to frequency jittering. Now, it looks like that it was mainly due to the fact that Hann window was used instead of Kaiser 6 window. Kaiser 6 window offers much better spectral leakage suppression than Hann window and is recommended for THD and THD+N measurement.
The attached screenshot “Rectangle-Hann-Kaiser6-WindowComparison” shows the comparison of the three windows: Rectangle, Hann, Kaiser 6.
The attached screenshot “RTX6001LoopbackTestKaiser6vsHannWindow” compares the effects of Kaiser 6 and Hann window on a RTX6001 loopback THD test. It can be seen that the skirt of the fundamental for the case of Hann window is much wider than that for the case of Kaiser 6 window. It extends into frequency bins which should normally be considered as being solely occupied by noises.
I saw that the autoranging tends to setup the level to the ±4.472V and FFT set with 131K and Kaiser6.
From my previous measurements of this oscillator, I knew that the best level was the next ±14.14V with Hann and 131K,
Previously I thought that the wide skirt of the fundamental in Post#366 was due to frequency jittering. Now, it looks like that it was mainly due to the fact that Hann window was used instead of Kaiser 6 window. Kaiser 6 window offers much better spectral leakage suppression than Hann window and is recommended for THD and THD+N measurement.
The attached screenshot “Rectangle-Hann-Kaiser6-WindowComparison” shows the comparison of the three windows: Rectangle, Hann, Kaiser 6.
The attached screenshot “RTX6001LoopbackTestKaiser6vsHannWindow” compares the effects of Kaiser 6 and Hann window on a RTX6001 loopback THD test. It can be seen that the skirt of the fundamental for the case of Hann window is much wider than that for the case of Kaiser 6 window. It extends into frequency bins which should normally be considered as being solely occupied by noises.
Attachments

That brings back my earlier question about the autoranging "rules" implemented in MI Pro. How does MI Pro determine the levels to be set at the RTX?
Not sure, but that sounds a bit like more averaging reduces THD. That's strange, except if it were THD+N maybe. What am I missing?
The autoranging rule is now user configurable. 0 dBFS is the default value but the user can modify it.
Synchronous averaging in time domain helps to improve the THD+N, but not THD.
Averaging in frequency domain helps to reduce the fluctuation of noises in the spectrum but it does not improve the THD and THD+N.
Previously I thought that the wide skirt of the fundamental in Post#366 was due to frequency jittering. Now, it looks like that it was mainly due to the fact that Hann window was used instead of Kaiser 6 window. Kaiser 6 window offers much better spectral leakage suppression than Hann window and is recommended for THD and THD+N measurement.
The attached screenshot “Rectangle-Hann-Kaiser6-WindowComparison” shows the comparison of the three windows: Rectangle, Hann, Kaiser 6.
The attached screenshot “RTX6001LoopbackTestKaiser6vsHannWindow” compares the effects of Kaiser 6 and Hann window on a RTX6001 loopback THD test. It can be seen that the skirt of the fundamental for the case of Hann window is much wider than that for the case of Kaiser 6 window. It extends into frequency bins which should normally be considered as being solely occupied by noises.
I agree that the KaiserX should be used for the THD, THD+N against Hann window.
I remember, that the same thing exists at the ARTA documentation.
For my test, I used Hann because in my older measurement with EOSC1KV3 (before MI-Pro), due stranger reason I had better THD measurement with Hann vs Kaiser with Arta or Rew.
This is my explanation, why I used the Hann and not Kaizer wnd in my test (for comparison reasons).
- Home
- Group Buys
- GB for Virtins MI Pro for RTX6001 autoranging/autoscaling & for soundcard end users