Measure the frequency response of a DUT and apply an inverse software filter
It is possible to measure a DUT’s frequency response using various methods and then right click the Spectrum Analyzer and select one of the following options to generate a frequency compensation file:
Option 1: “Generate Frequency Compensation File (Reference)”
This option is used to generate a Frequency Compensation File, which compensates the currently measured magnitude frequency response in Channel A to that in Channel B with the compensation factor at 1 kHz being 0 dB. Channel A is the one to be compensated and Channel B is the reference. For example, you can connect the microphone to be compensated in Channel A and the reference microphone in Channel B, and generate a Frequency Compensation File for the microphone in Channel A.
Option 2: “Generate Frequency Compensation File (Flat)”
Under amplitude spectrum mode, this option is used to generate a Frequency Compensation File, which compensates the currently measured magnitude frequency response to a flat one with the compensation factor at 1 kHz being 0 dB.
Under transfer function mode, this option is used to generate a Gain and Phase Compensation file, which can be used to compensates the currently measured gain and phase to 0 dB and 0 degree respectively. For example, you can use this option to generate a Gain and Phase Compensation file which eliminates the gain and phase disparity between the two input channels of the measuring device itself.
After generating a frequency compensation file (which has an inverse frequency response of the DUT), you can load it into the spectrum analyzer by right clicking the Spectrum Analyzer and select [Spectrum Analyzer Processing]>”Intra-frame Processing” >”Compensation 1” or “Compensation 2” to compensate it in frequency domain only. If you want to compensate it in both time and frequency domains, right click the Oscilloscope and select [Oscilloscope Processing]>”Digital Filtering”>”Arbitrary”>”Frequency Response” and load the saved frequency compensation file.
Another question for Virtins.
Let's say I want to use a passive notch filter and my RTX. Is there a way in MI Pro to measure the notch filter alone, create an inverse software filter of the notch, and then apply that filter to measurements when the passive notch and DUT are in series? My aim would be to see THD and THD+N with the fundamental removed.
It is possible to measure a DUT’s frequency response using various methods and then right click the Spectrum Analyzer and select one of the following options to generate a frequency compensation file:
Option 1: “Generate Frequency Compensation File (Reference)”
This option is used to generate a Frequency Compensation File, which compensates the currently measured magnitude frequency response in Channel A to that in Channel B with the compensation factor at 1 kHz being 0 dB. Channel A is the one to be compensated and Channel B is the reference. For example, you can connect the microphone to be compensated in Channel A and the reference microphone in Channel B, and generate a Frequency Compensation File for the microphone in Channel A.
Option 2: “Generate Frequency Compensation File (Flat)”
Under amplitude spectrum mode, this option is used to generate a Frequency Compensation File, which compensates the currently measured magnitude frequency response to a flat one with the compensation factor at 1 kHz being 0 dB.
Under transfer function mode, this option is used to generate a Gain and Phase Compensation file, which can be used to compensates the currently measured gain and phase to 0 dB and 0 degree respectively. For example, you can use this option to generate a Gain and Phase Compensation file which eliminates the gain and phase disparity between the two input channels of the measuring device itself.
After generating a frequency compensation file (which has an inverse frequency response of the DUT), you can load it into the spectrum analyzer by right clicking the Spectrum Analyzer and select [Spectrum Analyzer Processing]>”Intra-frame Processing” >”Compensation 1” or “Compensation 2” to compensate it in frequency domain only. If you want to compensate it in both time and frequency domains, right click the Oscilloscope and select [Oscilloscope Processing]>”Digital Filtering”>”Arbitrary”>”Frequency Response” and load the saved frequency compensation file.
MI 3.8.3 is now available
Hi everybody,
Thank you for your support in this GB. The new and official version - MI 3.8.3 is now available for download at: www.virtins.com/MIsetup.exe. This download link should always be used in the future for software version upgrade, which is free forever for the same license level.
An updated version of RTX6001 and MI Quick Start Guide can be found at: http://www.virtins.com/RTX6001-Multi-InstrumentQuickStartGuide.pdf
Real-Time Waveform Comparison between a Sinewave and Its Harmonic & Noise Residue
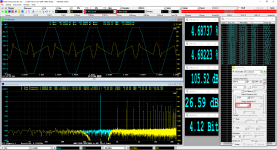
It is now possible to use MI to perform conveniently a waveform comparison between a sine wave and its harmonic and noise residue without any external means (e.g. a hardware notch filter to remove the fundamental). A sample panel setting can be found with the button “THDres” in the Hot Panel Setting Toolbar. If clicked, it will load a pre-configured Panel Setting File which contains basically the following two important settings:
(1) [Setting]>[ADC Device]>”Channel Operation”>”A=iA, B=iA”. It duplicates the signal from the physical input Channel A (“iA”) to both the logical input channels “A” and “B”.
(2) [Oscilloscope Processing]>”Digital Filtering”>” 500Hz ~ 1500Hz band-stop 1022nd -order Kaiser Windowed FIR filter” with FIR delay removed. This software filter is applied to the logical input channel “B” only, so that one can compare the original sinewave (in Ch.A) with its duplicate that has the fundamental removed (in Ch. B).
DDP Array Viewer is used here to show the harmonic frequencies, amplitudes, and phases. The phase information will only be available if [FFT Size]<=[Record Length]< 2×[FFT Size] and no inter-frame average is used.
The setting provides roughly 120 dB attenuation at 1kHz. If you change the sampling rate, you may need to change the order of FIR accordingly to keep this attenuation ratio.
The attached screenshot is an example showing a slightly clipped sinewave and its harmonic and noise residue. Please note that, if the residue is very small (which is usually the case), you can right click the oscilloscope and select “AutoScaling” to make it suitable for viewing. Unfortunately this has to be done manually as it is not possible to preset a correct Y Scale for Ch. B in advance.
One application of this type of comparison is to show the phase relationship graphically between harmonics and fundamental, which is more intuitive than the phase information displayed in numbers in the DDP Array Viewer. One such application example can be found at:
http://www.diyaudio.com/forums/pass-labs/267857-aleph-design-reloaded-28.html#post4809480
One advantage of using FIR filters and FFT filters in this type of application is that they provide linear phase or “zero” phase response if FIR delay is removed. Thus perfect time alignment can be achieved between the original and the filtered one. This is difficult for analog filters. The disadvantage is that the dynamic range is affected. But RTX6001 should be good enough in this type of application for most of the cases.
Another question for Virtins.
My aim would be to see THD and THD+N with the fundamental removed.
It is now possible to use MI to perform conveniently a waveform comparison between a sine wave and its harmonic and noise residue without any external means (e.g. a hardware notch filter to remove the fundamental). A sample panel setting can be found with the button “THDres” in the Hot Panel Setting Toolbar. If clicked, it will load a pre-configured Panel Setting File which contains basically the following two important settings:
(1) [Setting]>[ADC Device]>”Channel Operation”>”A=iA, B=iA”. It duplicates the signal from the physical input Channel A (“iA”) to both the logical input channels “A” and “B”.
(2) [Oscilloscope Processing]>”Digital Filtering”>” 500Hz ~ 1500Hz band-stop 1022nd -order Kaiser Windowed FIR filter” with FIR delay removed. This software filter is applied to the logical input channel “B” only, so that one can compare the original sinewave (in Ch.A) with its duplicate that has the fundamental removed (in Ch. B).
DDP Array Viewer is used here to show the harmonic frequencies, amplitudes, and phases. The phase information will only be available if [FFT Size]<=[Record Length]< 2×[FFT Size] and no inter-frame average is used.
The setting provides roughly 120 dB attenuation at 1kHz. If you change the sampling rate, you may need to change the order of FIR accordingly to keep this attenuation ratio.
The attached screenshot is an example showing a slightly clipped sinewave and its harmonic and noise residue. Please note that, if the residue is very small (which is usually the case), you can right click the oscilloscope and select “AutoScaling” to make it suitable for viewing. Unfortunately this has to be done manually as it is not possible to preset a correct Y Scale for Ch. B in advance.
One application of this type of comparison is to show the phase relationship graphically between harmonics and fundamental, which is more intuitive than the phase information displayed in numbers in the DDP Array Viewer. One such application example can be found at:
http://www.diyaudio.com/forums/pass-labs/267857-aleph-design-reloaded-28.html#post4809480
One advantage of using FIR filters and FFT filters in this type of application is that they provide linear phase or “zero” phase response if FIR delay is removed. Thus perfect time alignment can be achieved between the original and the filtered one. This is difficult for analog filters. The disadvantage is that the dynamic range is affected. But RTX6001 should be good enough in this type of application for most of the cases.
Attachments
Is there a more complete manual somewhere? I would like to capture a signal that usually is modulated by a higher frequency. Hope to separate the two and look at the wave form of the low frequency
Permanent Download Link for Latest Version
One reason to use a generic file name without a release version in it for the latest download is “laziness”🙂. Otherwise we will have to go to various download sites, forums, magazines, websites to update the link when a new version is available.
For old versions, the download file name is MIsetup3.7.exe, for example.
please please please include the release in the file name
One reason to use a generic file name without a release version in it for the latest download is “laziness”🙂. Otherwise we will have to go to various download sites, forums, magazines, websites to update the link when a new version is available.
For old versions, the download file name is MIsetup3.7.exe, for example.
Modulation and Demodulation
The software manual can be brought up by pressing F1, or go to [help=>[Software Manual]. The hardware manual can be accessed through [help=>[Hardware Manual].
AM, FM, PM modulation is supported by the Signal Generator.
AM, FM, PM demodulation is supported by the Oscilloscope.
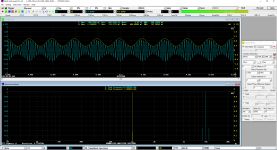
I attach a Panel Setting File here to demonstrate the AM modulation and demodulation. The loopback test result is shown in the attached screenshot. The signal generator generates an AM signal. In the oscilloscope, Ch. A shows the AM signal while Ch. B shows the demodulated signal.]%[/help]]%[/help]
Is there a more complete manual somewhere? I would like to capture a signal that usually is modulated by a higher frequency. Hope to separate the two and look at the wave form of the low frequency
The software manual can be brought up by pressing F1, or go to [help=>[Software Manual]. The hardware manual can be accessed through [help=>[Hardware Manual].
AM, FM, PM modulation is supported by the Signal Generator.
AM, FM, PM demodulation is supported by the Oscilloscope.
I attach a Panel Setting File here to demonstrate the AM modulation and demodulation. The loopback test result is shown in the attached screenshot. The signal generator generates an AM signal. In the oscilloscope, Ch. A shows the AM signal while Ch. B shows the demodulated signal.]%[/help]]%[/help]
Attachments
Panel configurations
Is there a means of storing the hardware configuration as well as the position and size of windows within the MI multiple document interface (MDI) into a configuration file?
I use the RTX and other sound cards for various purposes. I would like to be able to configure the hardware and UI as desired for each type of test, then recall the configuration in its entirety.
I tried creating a custom.psf file using Settings | Current Panel Setting to save, then load a configuration. But this does not contain the sound card hardware configuration.
[help=[help=The software manual can be brought up by pressing F1, or go to [help=>[Software Manual]. The hardware manual can be accessed through [help=>[Hardware Manual].
AM, FM, PM modulation is supported by the Signal Generator.
AM, FM, PM demodulation is supported by the Oscilloscope.
I attach a Panel Setting File here to demonstrate the AM modulation and demodulation. The loopback test result is shown in the attached screenshot. The signal generator generates an AM signal. In the oscilloscope, Ch. A shows the AM signal while Ch. B shows the demodulated signal.]%[/help]]%[/help]
Thanks]%[/help]]%[/help]
I have another situation. I am using Chinese windows 7, MIPro also sets itself to Chinese language. When I Installed it, I selected English, how do I get MIPro to show English menus?
I haven't had much time to get into the software yet, but I do have one question regarding W&F.
You have a setup existing to generate those numbers that shows the source wave on top (oscilloscope) and then shows the demodulated residual on the bottom. But what is really desired is the FFT of the demodulated signal, which then directly shows the modulation lines of the mechanical problems (bearings and motors)
This allows for direct examination of the components of the machine and the specific sources of the error. And consequent trimming/adjustment of same.
Anyone wishing to know more about this subject is directed to Dale Manquen's website, M A N Q U E N . N E T - A U D I O. Dale is gone now, but his site lives on hosted and maintained by his son.
Cheers
Alan
Hi Alan,
Thanks, I'll have a look. You're right about the FFT of course. I think that if you open the spectrum analyser portion it will show you the FFT of what you are looking at in the 'scope window. I wonder if you can point the spec-an to the demodulated output of the 'scope.
-Chris
Thanks, I'll have a look. You're right about the FFT of course. I think that if you open the spectrum analyser portion it will show you the FFT of what you are looking at in the 'scope window. I wonder if you can point the spec-an to the demodulated output of the 'scope.
-Chris
Yes, in Multi-Instrument, whatever displayed in the oscilloscope (raw or after being processed in the oscilloscope) will have their corresponding spectra displayed in the spectrum analyzer.
Is there a means of storing the hardware configuration as well as the position and size of windows within the MI multiple document interface (MDI) into a configuration file?
The Panel Setting File (PSF) does not contain the ADC/DAC hardware configuration. This makes sharing the same PSF file among different hardware possible. If you really want to save different ADC/DAC hardware configurations, you can use multiple instances of the software, with each of them has its own ADC/DAC hardware configuration. Multiple instances of the software can be launched from the same installation directory or multiple installation directories. The title bar of the main windows will indicated [1], [2], [3]... from the second instance onwards.
The Panel Setting File (PSF) contains window size and position information. The size and position information will take effect only when the PSF is saved and loaded with [Setting]>[Display]>"Auto Layout After Loading a Panel Setting File">"NIL" (the default setting). Otherwise, they will be overridden by "Tile Horizontally" or "Tile Vertically" option.
Change language of GUI
Select [Setting]>[Display]>[Language]>"English". The software needs to be restarted for the change to take effect.
I have another situation. I am using Chinese windows 7, MIPro also sets itself to Chinese language. When I Installed it, I selected English, how do I get MIPro to show English menus?
Select [Setting]>[Display]>[Language]>"English". The software needs to be restarted for the change to take effect.
... If you really want to save different ADC/DAC hardware configurations, you can use multiple instances of the software, with each of them has its own ADC/DAC hardware configuration. Multiple instances of the software can be launched from the same installation directory or multiple installation directories. ....
VIRTINS: I don't see how launching multiple instances of MI addresses my requirement since the hardware configuration of each application instance must be manually edited upon invocation. Is there any way to store and retrieve a hardware configuration, to avoid manually reconfiguring MI for a specific sound card upon application startup?
Hello Jim,
Each instance of the software can store one hardware configuration. For example, you can install the software in multiple directories as follows:
1. C:\VIRTINS Multi-Instrument 3.8 RTX6001
2. C:\VIRTINS Multi-Instrument 3.8 RME ADI-2 Pro FS
And then configure each instance manually ONCE to store its own hardware configuration. Then if you launch Instance 1, it will use RTX6001. If you launch Instance 2, it will use RME ADI-2 Pro FS.
Actually it should be quite easy to switch the hardware within the software itself without using the above multi-instance method. To use RTX6001, go to [Setting]>[Restore to factory default] and select “RTX6001 Audio Analyzer ASIO”. To use RME ADI-2 Pro FS (for example), go to [Setting]>[Restore to factory default]>”Sound Card ASIO”. As "Sound Card ASIO" is a generic Device Model, you may need to go to [Setting]>[ADC Device]>”Device No.” and [Setting]>[DAC Device]>”Device No” to select that particular sound card.
Wow & Flutter Measurement
Thanks, that website is a very good reference for Wow & Flutter Measurement.
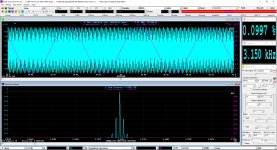
MI Full Package supports W&F measurement according to AES6-2008 (r2012). It is compatible with IEC 60386 Ed.1 1972, IEEE Std-193, CCIR 409-2, and DIN 45507. For W&F measurement, the record length (sampling duration) must be greater than 5s in order to capture sufficiently low modulating frequency (called Drift and Wow). Both psychoacoustically weighted and non-weighted peak W& F measurements are supported.
Attached are the weighting curve and a W&F measurement example. In the example, Ch. A shows a 3150Hz carrier frequency modulated by a 4Hz sinewave with a max. frequency deviation of 3.15Hz. Ch. B shows the FM demodulated signal (It is not required for W&F measurements, but it is shown here for demo purpose). Theoretical peak W&F value in this example can be calculated as 3.15Hz / 3150Hz × sin(0.95×90°) = 0.0997%. The test result matches this very well as shown. The testing signal can be generated using the Signal Generator of MI as shown in the screenshot. It can also be downloaded from: www.virtins.com/3150HzModulatedBy4HzAt0.0997Percent3.15Hz.wav
I haven't had much time to get into the software yet, but I do have one question regarding W&F.
You have a setup existing to generate those numbers that shows the source wave on top (oscilloscope) and then shows the demodulated residual on the bottom. But what is really desired is the FFT of the demodulated signal, which then directly shows the modulation lines of the mechanical problems (bearings and motors)
This allows for direct examination of the components of the machine and the specific sources of the error. And consequent trimming/adjustment of same.
Anyone wishing to know more about this subject is directed to Dale Manquen's website, M A N Q U E N . N E T - A U D I O. Dale is gone now, but his site lives on hosted and maintained by his son.
Cheers
Alan
Thanks, that website is a very good reference for Wow & Flutter Measurement.
MI Full Package supports W&F measurement according to AES6-2008 (r2012). It is compatible with IEC 60386 Ed.1 1972, IEEE Std-193, CCIR 409-2, and DIN 45507. For W&F measurement, the record length (sampling duration) must be greater than 5s in order to capture sufficiently low modulating frequency (called Drift and Wow). Both psychoacoustically weighted and non-weighted peak W& F measurements are supported.
Attached are the weighting curve and a W&F measurement example. In the example, Ch. A shows a 3150Hz carrier frequency modulated by a 4Hz sinewave with a max. frequency deviation of 3.15Hz. Ch. B shows the FM demodulated signal (It is not required for W&F measurements, but it is shown here for demo purpose). Theoretical peak W&F value in this example can be calculated as 3.15Hz / 3150Hz × sin(0.95×90°) = 0.0997%. The test result matches this very well as shown. The testing signal can be generated using the Signal Generator of MI as shown in the screenshot. It can also be downloaded from: www.virtins.com/3150HzModulatedBy4HzAt0.0997Percent3.15Hz.wav
Attachments

For some tests a wideband measurement can be useful to see things that don't show in the band limited measurements. I once used a CD4 test record and an analog spectrum analyzer to check the stability of turntables. It made the differences between belt drive and direct drive servo pretty clear. The belt drive had a Gaussian spread on the carrier and the direct drive had a double hump distribution showing the servo's dead zone. Scrape flutter would also show with this type of testing. I think MI could do this pretty easily.
- Home
- Group Buys
- GB for Virtins MI Pro for RTX6001 autoranging/autoscaling & for soundcard end users