Dear Mikets42,
Unfortunately I have trouble interpreting your spectograms. Would you be so kind as to give an bit of an explanation what we are supposed to see on these spectograms? Probably it is just me, but I have trouble interpreting this way of graphic presentation: i would like to know what exactly it is I am looking at.
Unfortunately I have trouble interpreting your spectograms. Would you be so kind as to give an bit of an explanation what we are supposed to see on these spectograms? Probably it is just me, but I have trouble interpreting this way of graphic presentation: i would like to know what exactly it is I am looking at.
D
Deleted member 375592
@ Boden Of course, gladly!
Spectrograms show all the harmonics, including the distortions that may not be included in the main/H2/H3/etc graphs. Let's consider SB26st tweeter, to start with. The "Raw" results of the exponential sine sweep aka Farina test are shown as a spectrogram. It contains the yellow main ridge (with FR coded as color intensity), and harmonics - the ridges below, which are much less intense. They follow in the order up->down, 2nd, 3rd, etc. If you move a horizontal ruler flat along the time axis (up-down), you will first see the main frequency, then its 2nd harmonic, then 3rd, all color-coded. If you move a vertical ruler along the frequency axis and look up->down, you will also first see the main frequency, and then the 2nd harmonic of f/2, then the 3rd harmonic of f/3, etc. Most often, this "ruler" is the source of the plots you see in datasheets, etc. IMHO, It is quite confusing because you need to compare (say) the H3 on a frequency with the FR on f/3.
If you see a horizontal strike at some moment of time, it's most likely a noise burst. You would likely see some low-frequency noise from cars passing by, their pitch will vary.

The spectrogram has all the info but it is hard to deduce the number values from color intensities. Often, I plot only the residual of ESS, with the main ridge taken out due to its very low informativity.
Thus, let's plot only the ridges of the main and its harmonics, below.

On this plot, you see the main ridge (red), and H2, H3,.. etc. The harmonics are relative and calculated accounting for the difference between FR(f) and FR(f*n) where the n is a harmonic number (that's why it is named FR aligned). This plot is not exhaustive. Sometimes you have a very long tail of harmonics (like AMT) but you don't have enough colors to plot all the Hns. Happily, in the cases of good drivers and reasonably low SPL, only a few harmonics exist, the rest are well below noise.
The plot above also exchanges precision with frequency resolution. You can see lines of it which you can hardly see on the spectrogram. For DIY home living room measurements, this is my preferred option - however, you can take an opposite tradeoff, your choice.
However, for woofers, these curves do not tell the full story, at all. For example, SB12PFC25-4:

Same 80 dB SPL - which is not too loud. Here you can see that on frequencies < 100Hz the number of visible harmonics is very long, moreover, there is a trace of non-harmonic distortions, as solid color goes well into the kHz range when the main is close to 20Hz. Basically, the implicit assumption of harmonic distortions becomes false, obviously. You can also see the resonance at about 200Hz, with a long series of whitish dots. Note that such resonances may be very non-linear. They may disappear completely if you drop SPL by 5 dB.
The same spectrogram is useful when the excitation is not ESS. It may be ... whatever. You can see the spectrogram of the microphone signal of 15 sec from Queen's "Another One Bites The Dust", filtered 300...3000Hz, as if SB12PFC were to be used as midrange.

and the residuals of linear filtering, basically non-linear and IMD distortions on real-world music:

Of course, the best is to listen to this residual - but just plotting its spectrogram may also help.
BTW, this is the spectrogram of the source:

Please do not hesitate to ask any more questions you may have.
Spectrograms show all the harmonics, including the distortions that may not be included in the main/H2/H3/etc graphs. Let's consider SB26st tweeter, to start with. The "Raw" results of the exponential sine sweep aka Farina test are shown as a spectrogram. It contains the yellow main ridge (with FR coded as color intensity), and harmonics - the ridges below, which are much less intense. They follow in the order up->down, 2nd, 3rd, etc. If you move a horizontal ruler flat along the time axis (up-down), you will first see the main frequency, then its 2nd harmonic, then 3rd, all color-coded. If you move a vertical ruler along the frequency axis and look up->down, you will also first see the main frequency, and then the 2nd harmonic of f/2, then the 3rd harmonic of f/3, etc. Most often, this "ruler" is the source of the plots you see in datasheets, etc. IMHO, It is quite confusing because you need to compare (say) the H3 on a frequency with the FR on f/3.
If you see a horizontal strike at some moment of time, it's most likely a noise burst. You would likely see some low-frequency noise from cars passing by, their pitch will vary.
The spectrogram has all the info but it is hard to deduce the number values from color intensities. Often, I plot only the residual of ESS, with the main ridge taken out due to its very low informativity.
Thus, let's plot only the ridges of the main and its harmonics, below.
On this plot, you see the main ridge (red), and H2, H3,.. etc. The harmonics are relative and calculated accounting for the difference between FR(f) and FR(f*n) where the n is a harmonic number (that's why it is named FR aligned). This plot is not exhaustive. Sometimes you have a very long tail of harmonics (like AMT) but you don't have enough colors to plot all the Hns. Happily, in the cases of good drivers and reasonably low SPL, only a few harmonics exist, the rest are well below noise.
The plot above also exchanges precision with frequency resolution. You can see lines of it which you can hardly see on the spectrogram. For DIY home living room measurements, this is my preferred option - however, you can take an opposite tradeoff, your choice.
However, for woofers, these curves do not tell the full story, at all. For example, SB12PFC25-4:
Same 80 dB SPL - which is not too loud. Here you can see that on frequencies < 100Hz the number of visible harmonics is very long, moreover, there is a trace of non-harmonic distortions, as solid color goes well into the kHz range when the main is close to 20Hz. Basically, the implicit assumption of harmonic distortions becomes false, obviously. You can also see the resonance at about 200Hz, with a long series of whitish dots. Note that such resonances may be very non-linear. They may disappear completely if you drop SPL by 5 dB.
The same spectrogram is useful when the excitation is not ESS. It may be ... whatever. You can see the spectrogram of the microphone signal of 15 sec from Queen's "Another One Bites The Dust", filtered 300...3000Hz, as if SB12PFC were to be used as midrange.
and the residuals of linear filtering, basically non-linear and IMD distortions on real-world music:
Of course, the best is to listen to this residual - but just plotting its spectrogram may also help.
BTW, this is the spectrogram of the source:
Please do not hesitate to ask any more questions you may have.
[...] You can also see the resonance at about 200Hz, with a long series of whitish dots. [...]
these?
On the current drive audio resonances in #53:
These "resonances" sound very much like a "latent vocal mic on stage feedback". A mic feedback is much more complex than a resonance.
Best regards
Bernd
D
Deleted member 375592
No, they are not like mic feedback. When you run a sine sweep and get to that frequency, you hear a spike in distortions zh-dz-sh... which comes and goes, like something rattles exactly on this frequency.
I once wrote an adaptive feedback canceller/suppressor/gain-control for a pro-audio company... since then it has been deployed in the field. I was not allowed to know how many instances were used... so I kind of know the subject, to a degree. These develop linearly and do not have harmonics. You have to discriminate between the mic feedback and a flute or flute-like instrument or voice - which may not be as easy as it sounds ... but doable.
I once wrote an adaptive feedback canceller/suppressor/gain-control for a pro-audio company... since then it has been deployed in the field. I was not allowed to know how many instances were used... so I kind of know the subject, to a degree. These develop linearly and do not have harmonics. You have to discriminate between the mic feedback and a flute or flute-like instrument or voice - which may not be as easy as it sounds ... but doable.
So we both have a degree in feedback ;-)
My final breakthrough was to find out, that the most stubborn feedbacks were in fact loudspeakers resonances - with its inherent harmonics.
What i hear in "current-drive-80-hpf300-hpn5-lpf3000-lpn5-1-res.mp3" reminds me...
( attachment #53 )
Did i find the right dots in #83 ?
My final breakthrough was to find out, that the most stubborn feedbacks were in fact loudspeakers resonances - with its inherent harmonics.
What i hear in "current-drive-80-hpf300-hpn5-lpf3000-lpn5-1-res.mp3" reminds me...
( attachment #53 )
Did i find the right dots in #83 ?
D
Deleted member 375592
Yep, feedback🙂
It turns out to be a critical application for airplanes where passengers need to hear pilots loud and clear.
I am not sure... I am attaching the residuals (aka non-linear distortions) of a sine sweep, amplified by 36dB, of the same SB12PFC, on 80dB SPL, so you can listen (~6sec) and decide for yourself.
Attachments
this:[...] moreover, there is a trace of non-harmonic distortions, as solid color goes well into the kHz range when the main is close to 20Hz. [...]
is Barkhausen noise.
Thank you for the audio! 🙂
It reminds me strongly of my experiments about Barkhausen two decades ago. It was easy to hear Barkhausen noise with 30Hz sine. 30Hz sine masks nothing at all.
To tell the full story:
I finally mounted the transducer front facing a sheet of plywood to reduce the excursion. DIY mechanical LTI residual 🙂)))
Best regards,
Bernd
@mikets42:
Thank you for sharing your results, but to me the H3 graphs seem somewhat odd, as there is very little level dependency. In theory, the relative (to fundamental) level of H3 should rise at double dB rate (and the absolute level at triple rate) when SPL increases. This is also quite what I observed when doing my experiments way back. Any explanations to this? The H2:s OTOH seem to follow their corresponding rule.
Thank you for sharing your results, but to me the H3 graphs seem somewhat odd, as there is very little level dependency. In theory, the relative (to fundamental) level of H3 should rise at double dB rate (and the absolute level at triple rate) when SPL increases. This is also quite what I observed when doing my experiments way back. Any explanations to this? The H2:s OTOH seem to follow their corresponding rule.
D
Deleted member 375592
@ETM - I agree with you re H3. Lars von Purify also wrote about it in length. I do not know of any explanations. I observed somewhat similar behavior in the non-linear systems with feedback, where the non-linearity was a soft central clipping as in class AB amplifiers... but I would not jump to conclusions.
H2 is also not so simple. I tried 2nd order IV Volterra kernel. It converges fine but the residual error reduction is only ~8dB. I am quite puzzled by it.


If you or anybody else knows non-linear system identification well, please let me know. I would be very glad to cooperate.
H2 is also not so simple. I tried 2nd order IV Volterra kernel. It converges fine but the residual error reduction is only ~8dB. I am quite puzzled by it.
If you or anybody else knows non-linear system identification well, please let me know. I would be very glad to cooperate.
@mikets42
For the less mathematically inclined, such as myself, what physical mechanism or principle would you propose causes H3 (or does it also apply to a series of odd harmonics, H5, H7 etc?) to stabilize as suggested?
I would sanity-check the measurement against some other way of obtaining a virtual impulse response. My understanding is that REW and similar programs essentially reconstruct an impulse (for later FFT-like analysis) by phase-shifting a sine-wave sweep. But a practical limitation is that any given frequency is only ever excited in a specific sequence, a "sweep", with perfectly symmetrical amplitude. And a graph that adds up the total dwell-time for any specific output voltage (or current) would have something like a cosine shape.
Refer to "jump distortion" to help illustrate a possibly related anomaly, which may occur at near a low frequency resonance when conducting a sweep. Essentially, a resonant peak is tilted sideways by the speaker having a progressive spring rate, resulting in a kind of hysteresis, and a swept sine wave 'jumps' from one region of stable amplitude to another.
I imagine something similar could be happening at a microscopic scale with odd harmonics at higher frequencies, due to magnetic hysteresis.
Last edited:
D
Deleted member 375592
@abstract: The sine sweep and MLS measurements are based on the 1947 Sidney Darlington work on radars. Since then, it has been developed into perfect sequences theory, branched off into other fields, and used a lot: radar, sonar, CDMA, and all kinds of noise-robust communications including satellite, etc. I'd say that it has passed all possible and impossible sanity checks with flying colors already.
BTW, the Darlington transistor pair is also his invention.
BTW, the Darlington transistor pair is also his invention.
here @tmuikku nailed (my) H2 home:H2 is also not so simple. I tried 2nd order IV Volterra kernel. It converges fine but the residual error reduction is only ~8dB. I am quite puzzled by it.
https://www.diyaudio.com/community/...ortion-measurement.402566/page-8#post-7556054
Yeah, assuming #146 is acoustic measurement it shows that 2nd order harmonic is not affected (much) by the resistor, which means main source for 2nd order harmonic distortion is not in electrical domain, but in mechanical / acoustic domain.
Measurement in post #1 shows distortion measured in electrical domain, which shows that a series resistor reduces 2nd order harmonic through out the frequency spectrum. It shows all harmonics are reduced in electrical domain. This is due to following reason: to maintain fair measurement condition acoustic output was kept the same with or without series...
Measurement in post #1 shows distortion measured in electrical domain, which shows that a series resistor reduces 2nd order harmonic through out the frequency spectrum. It shows all harmonics are reduced in electrical domain. This is due to following reason: to maintain fair measurement condition acoustic output was kept the same with or without series...
Last edited:
D
Deleted member 375592
That is the hypothesis I also found reasonable... till I realized that it is not always so. But, yes, sometimes it is very much so. Let's consider Dayton MB620-8.
Voltage drive:


Now current drive:


and now current drive with a mod: a layer of foam tape on the top of the cone, and a thin layer of epoxy resin on the top, to make an I-beam composite.


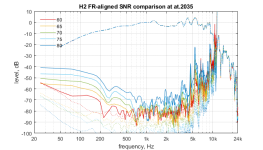
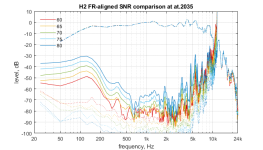
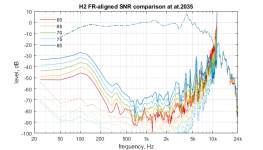
The H3 in the range 600...1700Hz dropped by 35dB, from -45ish down to -80 dB, in half an hour of work to modify an amplifier from voltage drive to current drive, and cone from paper to a composite. I looked at all that ... and decided to change FSAF/etc licensing terms from GPL to BSD because the audio industry's state is beyond pathetic.
Voltage drive:
Now current drive:
and now current drive with a mod: a layer of foam tape on the top of the cone, and a thin layer of epoxy resin on the top, to make an I-beam composite.
The H3 in the range 600...1700Hz dropped by 35dB, from -45ish down to -80 dB, in half an hour of work to modify an amplifier from voltage drive to current drive, and cone from paper to a composite. I looked at all that ... and decided to change FSAF/etc licensing terms from GPL to BSD because the audio industry's state is beyond pathetic.
Hi, if you don't mind here are the above images as thumbnails to enable the gallery mode which makes comparison bit easier.
These are the H2 graphs as appear above, H2 voltage drive, H2 (1) current drive, H(2) current drive with cone mod.
Here the H3
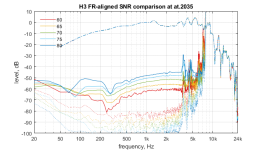
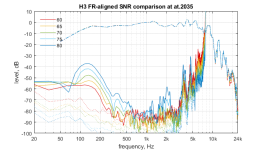
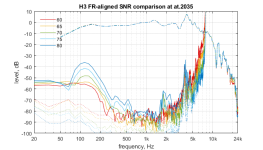
It looks like there is some change on things with the cone mod, but biggest obvious difference seems to be just the current drive.
It's kind of understandable from business perspective to have bit worse performance if it makes more practical and cheaper systems, enables interchangeable amps / speakers and so on. But from DIY perspective there is no reason not to try and reduce motor distortion by experiemnting with current drive. Why not also distortion from the cone but it's not as easy as manipulating electrical impedance.
These are the H2 graphs as appear above, H2 voltage drive, H2 (1) current drive, H(2) current drive with cone mod.


Here the H3


It looks like there is some change on things with the cone mod, but biggest obvious difference seems to be just the current drive.
It's kind of understandable from business perspective to have bit worse performance if it makes more practical and cheaper systems, enables interchangeable amps / speakers and so on. But from DIY perspective there is no reason not to try and reduce motor distortion by experiemnting with current drive. Why not also distortion from the cone but it's not as easy as manipulating electrical impedance.
Last edited:
D
Deleted member 375592
Thanks! The gallery is indeed better.
...and here is a direct comparison on 80dB SPL:


pretty much the same with the H4,H5,etc

...and here is a direct comparison on 80dB SPL:
pretty much the same with the H4,H5,etc
D
Deleted member 375592
I've already been asked a few times why I do my measurements on 80dB SPL - and not on "standard" 94 dB SPL (=1Pa) and how to modify an amp to be a current driver.
1. 80 dB SPL is already pretty loud. 1Pa is horribly loud - and you may not want to torture your family and neighbors. IMHO, it's not worth it.
2. 80dB SPL is about as loud as a usual home speaker driver can sound without going into soft saturation. Many pro audio drivers are also not capable of producing undistorted sound above 85dB SPL.

The number of visible harmonics is ... high, and they are not decreasing fast enough. From the theory of Fourier transform, we know that discontinuity in a function derivative of Nth order produces harmonics decaying with (1/n)^(N+1) speed. Here, we have - more or less - 1/n speed, which means the discontinuity is in the sound pressure function itself. That shall also result in the wide spread of IMD products making them unmaskable. This spread of dirt is often limited only by the cone's capability to reproduce high-frequency content.
3. The only solution I am aware of is N-element line arrays. You produce 1/N sound pressure at each driver and, in the Fresnel zone, you get ~1/sqrt(d) loudness decrease with distance, instead of 1/d for point-source. No wonder 24-element TC9 line arrays sound magnificently (for f>500Hz).
Modifying an amp, step by step.
1. You must have basic knowledge of electronics and the theory of control. Take an MIT/etc YouTube refresher course if it is rusty.
2. You'll need an oscilloscope and a sine generator, >= 5 MHz. Look at eevblog for honest reviews.
3. measure driver's |Z|.

4. Say, you are targeting 20dB voltage gain. Make an air-core Lres/10 inductor if you can't buy it. Measure it by applying 1MHz, in series with a known resistor.
5. Assemble an |Z|/10 equivalent network. The gain the feedback loop shall look like this:

Make sure the feedback gain slope is not negative to be phase-margin-safe.
6. Attach the Z/10 /(Z + Z/10) divider output to the IN-, directly (green wire below) or via a capacitor. The value of the capacitor shall be > 1uF for the pure current drive, and less for the mixed drive (your mileage will vary). The amplifier, feedback network, and the driver itself shall be one "reasonably" compact device for f <= 10MHz. Long wires across the room from the amplifier to the loudspeaker are assured: "no-go".

7. Test the amplified + driver with a scope and signal generator. It shall not be any close to ringing on f > 100kHz. Here is an example using LM3886:

Most chip-amps are not unit gain stable. They must have a gain >= 10 or a phase-positive feedback network (like the one above) if the gain is < 10. Be careful and test twice🙂
8. You may or may not need to modify the cone. They often exhibit high-frequency ringing which is very nasty as it amplifies harmonics. They are generally not stiff enough and have too little internal damping. Technology-wise, they are stone-age. The normal solution is I-beam aka sandwich aka composite. Airplane modeling provides excellent tutorials on achieving maximum performance with the lowest weight. Foam / Balsa reinforced with carbon/aramid mesh and epoxy resins are field-proven to be quite close to the optimal aerospace industry materials (although lacking extreme condition toughness).
1. 80 dB SPL is already pretty loud. 1Pa is horribly loud - and you may not want to torture your family and neighbors. IMHO, it's not worth it.
2. 80dB SPL is about as loud as a usual home speaker driver can sound without going into soft saturation. Many pro audio drivers are also not capable of producing undistorted sound above 85dB SPL.
The number of visible harmonics is ... high, and they are not decreasing fast enough. From the theory of Fourier transform, we know that discontinuity in a function derivative of Nth order produces harmonics decaying with (1/n)^(N+1) speed. Here, we have - more or less - 1/n speed, which means the discontinuity is in the sound pressure function itself. That shall also result in the wide spread of IMD products making them unmaskable. This spread of dirt is often limited only by the cone's capability to reproduce high-frequency content.
3. The only solution I am aware of is N-element line arrays. You produce 1/N sound pressure at each driver and, in the Fresnel zone, you get ~1/sqrt(d) loudness decrease with distance, instead of 1/d for point-source. No wonder 24-element TC9 line arrays sound magnificently (for f>500Hz).
Modifying an amp, step by step.
1. You must have basic knowledge of electronics and the theory of control. Take an MIT/etc YouTube refresher course if it is rusty.
2. You'll need an oscilloscope and a sine generator, >= 5 MHz. Look at eevblog for honest reviews.
3. measure driver's |Z|.
- Add a series resistor 500...1kOhm.
- Adjust generator output volume so that it's not distorted too heavily, like 2...5V instead of 10V.
- Make sure all switched-mode power supplies nearby are either off or well-shielded.
- Measure Vin and Vout for f=[10kHz...5MHz].
- Vout will be from 10mV to 1V.
- Figure out where is the Z resonance around 1MHz, and what are the equivalent Rres, Lres, and Cres. Your picture shall be like this:
4. Say, you are targeting 20dB voltage gain. Make an air-core Lres/10 inductor if you can't buy it. Measure it by applying 1MHz, in series with a known resistor.
5. Assemble an |Z|/10 equivalent network. The gain the feedback loop shall look like this:
Make sure the feedback gain slope is not negative to be phase-margin-safe.
6. Attach the Z/10 /(Z + Z/10) divider output to the IN-, directly (green wire below) or via a capacitor. The value of the capacitor shall be > 1uF for the pure current drive, and less for the mixed drive (your mileage will vary). The amplifier, feedback network, and the driver itself shall be one "reasonably" compact device for f <= 10MHz. Long wires across the room from the amplifier to the loudspeaker are assured: "no-go".
7. Test the amplified + driver with a scope and signal generator. It shall not be any close to ringing on f > 100kHz. Here is an example using LM3886:
Most chip-amps are not unit gain stable. They must have a gain >= 10 or a phase-positive feedback network (like the one above) if the gain is < 10. Be careful and test twice🙂
8. You may or may not need to modify the cone. They often exhibit high-frequency ringing which is very nasty as it amplifies harmonics. They are generally not stiff enough and have too little internal damping. Technology-wise, they are stone-age. The normal solution is I-beam aka sandwich aka composite. Airplane modeling provides excellent tutorials on achieving maximum performance with the lowest weight. Foam / Balsa reinforced with carbon/aramid mesh and epoxy resins are field-proven to be quite close to the optimal aerospace industry materials (although lacking extreme condition toughness).
Where do they come from? I have no idea.
That's easy to answer, it's the missing damping factor of the amplifier. That's an inherent trait of a current source amplifier. Magnet/coil speakers got a lively impedance response, if you want your current source amplifier to perform better, you need to flatten the impedance response of your speakers fluctuations by compensation circuits. Not only makes it the speakers a hell much more expensive, it also contradicts the current source amplifier concept.
There are just two things that are feasible in practice to solve the problem:
- Bi-amp and use a conventional amp for the bass and avoid the expensive impedance correction in the bass. Implement impedance control for the drivers above that.
- Use impedance flat drivers like magnetostats or air motion transformers. I don't know such drivers for bass though.
D
Deleted member 375592
Interesting idea... but I disagree. The "native" resonance frequency is way lower and is not relatable to these. This effect has been observed only on one driver, a dozen+ more tested do not exhibit anything like that. The cost of DSP nowadays is < $2 (wholesale, 1k volume), and it often includes multiple channel ADC (high speed 10...12 bit, noise shapable to 20+) and DAC (PWM). The learning curve is steep, true, which makes it prohibitive for DIY. The recommended way is Equaliser APO + 5.1/7.1 sound card
Let's face it: Traditional speakers are power dependent, not current dependent. And if you flatten the impedance, you can also use a voltage source amp instead. And if you want to use a dsp then you can fix any possible flaws of a voltage source amplifier as well - which complete revokes any arguments for the current source anyway.
Just because you didn't find other speakers that do show the same behaviors doesn't mean that problem doesn't exist. You will realize current source isn't the solution to everything once you've learned resonances don't only manifest in impedance peaks but can also show in importance minima (see Helmholtz resonators).
Live with the amplifiers faults, use different speakers but don't deny the principle faults.
D
Deleted member 375592
Strangely enough, some university professors claim that the cone acceleration and the force applied depend on current: https://phys.libretexts.org/Bookshe...agnetic_Force_on_a_Current-Carrying_Conductor
and the Bl parameter is often quoted in the driver spec... is that a conspiracy against power?
and the Bl parameter is often quoted in the driver spec... is that a conspiracy against power?
- Home
- Loudspeakers
- Multi-Way
- Experiments with the current drive