Yeah, but I don't understand your point with that, can you give a specific example? Time and frequency response are two views on the same thing and since it's all relative, certainly more ripple means more audible. So it's always positive to reduce the ripple in amplitude as it directly shows secondary sound source amplitude has reduced, which means it's less audible. I do not know any phenomenon which gets more audible with less amplitude. If you mean that wide bandwidth ripple could be less audible than narrow bandwidth, then you might be right, but still if you took that and reduced the ripple in amplitude it would be even less audible.
One could widen the bandwidth that shows interference by having long distance from transducer to edge, which lowers frequency the baffle supports and widens the bandwidth that makes the back wave at the edge, so big baffle compared to transducer size. I would argue though, that this is always more audible as long as it's still relatively small compared to room dimensions and listening distance, as it would make the time delay to the edge longer and more distinct as secondary sound source the longer the delay (compared to frequency!). Sound from the edge is like a fingerprint of the structure, the edge applies your perfect point source (transducer on the baffle) a 3D sound signature and as you move in the room the speaker is not a point in space but object with orientation and location and so on.
As Bon wrote above, any point on the driver is an individual point source, which all together make the response to any direction you observe, and when the edge is just next to all these points, what's the difference? If you take a point center of the cone, and a point at the edge of the cone and one point next to this at the baffle edge, whats the difference? If you observe 5cm offset from cone center it's the cone center that has more delay to you than the edge diffraction back wave. Fingerprint of the edge sound mixes with the transducers, as it's about at the same location and time.
Last edited:
Can you take a response plot and convert it to an impulse?Time and frequency response are two views on the same thing and since it's all relative,
Can you look at polar measurements and see the timing of the diffraction?can you give a specific example?
Yes, for sure! Wavelength! If there is a frequency response dip at 2kHz observed some angle, it means the sound source that interferes with direct sound is half a wavelength late to that angle if it's same polarity, or full wavelength late if it's opposing polarity like diffraction backwave! From this you can calculate with simple trigonometry the place the secondary sound source launched if you know the observation angle and distance! distance is not that significant though assuming observation is far enough. Of course things get very complicated if the box shape is complicated, but this is the basis of it all. If you observe from an angle, the closest edges back wave does not propagate toward you, only the direct sound, thus you always see back wave of the edge that is further than the actual sound source, and has similar frequency response, except has high and low pass to it, from baffle size and transducer size.Can you look at polar measurements and see the timing of the diffraction?
And as explained in earlier post these front edge diffractions are quite easy to detect in polar plots as they make the strongest interference, and all other interference rides on top of these as lessor ripple. Also if you look at polars to varsious angles you see the interference move in the frequency response, which shows it's distance moves as observation angle changes, the location can be now pinpointed accurately if one wants to. It's easy to see whether it's from back side or from the front as these show differently at different off-axis angles further helping out identifying this stuff from the graphs. This is especially easy with the ideal simulations to train your eye on, because there is nothing extra, no measurement errors and secondary effects like driver issues and room reflections masking anything, just the simplest thing. Thus the urge to sim with realtime simulator like vituixcad, it's void of any additional effects, easy to adjust in real time to make reasoning. It's all based on just the wavelength, speed of sound, relatively simple math and phenomenon as the basis.
Task, these are two identical ideal point sources both with flat frequency response. What is the delay between them? You can estimate / calculate either distance or time, and convert to the other, both are the same thing through speed of sound, which is 343m/s here.

How about this one?

Now whats this all about?

Tip, if it's hard to imagine and calculate these in head try to make a matching interference pattern in vituixcad, here is how to, just add another ideal driver, hook it like so and change the Z value of one of them, or use a delay block if you want to.

How about this?

Last edited:

This is what I'm trying to expand upon. We have the ability to use some newer shapes they couldn't test back then.Published in 1951...
https://www.aes.org/aeshc/pdf/how.the.aes.began/olson_direct-radiator-loudspeaker-enclosures.pdf
View attachment 1356160
And radiator size vs. baffle dimensions is important too, published in Tim Mellow & Leo Karkkainen, "A dipole loudspeaker with balanced directivity pattern", J. Acoust. Soc. Am. 128 (5), November 2010, pp. 2749 - 2757 https://www.linkwitzlab.com/models.htm
View attachment 1356172
While I am positive the big names have data on this, we in DIY do not.
I may expand upon this and try full shapes around the drivers using a full range.
Exactly.By my understanding, baffle step is responsible for fall of the decreasing frequency on axis response, but the severe ripple with increasing frequency is due to diffraction.
Baffle step is the (rather smooth) transition from 4pi to 2pi radiation.
Diffraction is the interference of driver with "secondary sources" at the baffle edges, similar to comb filtering.
Welp.... here's some data.
Tweeter = sharp edges
Tweeter V1 - small teardop edge
Tweeter V2- big teardrop edge
My super unprofessional conclusion: It does make a difference. I don't think it makes it any "better" but it does change the response.
I will compare off axis next
Tweeter = sharp edges
Tweeter V1 - small teardop edge
Tweeter V2- big teardrop edge
My super unprofessional conclusion: It does make a difference. I don't think it makes it any "better" but it does change the response.
I will compare off axis next
Attachments
How big are the small teardrop and big teardrop?
I don’t know if I could hear the difference unless I was told to listen for something specific.
I don’t know if I could hear the difference unless I was told to listen for something specific.
V1 is small, V2 is pretty big.
I guess this goes to show that little round overs with the router are sort of useless..... outside of ascetics of course. At least as far as round ones go. I'll have to test the increase radius ones.
Maybe it needs an entire shape around the driver. At the end of the day these are still square boxes. I think I'll test a sphere vs a cube and see what difference there is there. I have a 1.5" full range driver sitting around I can use for the test.
Attachments


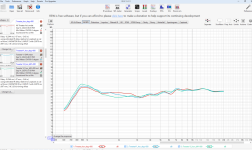
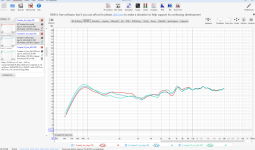
You probably want to look into your measurement settings. I would gate at ~5ms or so and not do any (or at most 1/12 octave) smoothing. Then post the graph again.Welp.... here's some data.
Really?Yes, for sure!
So I can show you any regular polar plot for a typical waveguide. It has many small diffraction events at different times from different parts of the waveguide at different angles to the mic at each angle it's measured at, across various frequencies.
..could you look at it and make a chart of the diffraction spectrum and it's properties?
Yeaaahhhhh.... I already played around it but since you asked.... here ya go. 1/12th smoothing gated at 5msYou probably want to look into your measurement settings. I would gate at ~5ms or so and not do any (or at most 1/12 octave) smoothing. Then post the graph again.
Attachments
There are plenty of DIY designers that have tested all sorts of different shapes and posted plenty of data, it just gets lost and forgotten over time.While I am positive the big names have data on this, we in DIY do not.
Both are diffraction, the difference is the source and the range of frequencies it affects. Edge diffraction is most easily seen as a ripple in the on axis frequency response and the more edges/sources there are with the same distance the worse it becomes, which is why offsetting the driver on the baffle can reduce it. The range of frequencies most affected are those where the tweeter is not directive enough to keep sound from reaching the edge with enough pressure to interfere with the secondary source. Baffle step/diffraction happens below the frequency where the baffle size can maintain control. Once control is lost at the edge the shape and size of any roundover or edge treatment along with box depth/shape and back edge shape affect how the step looks. Most of those things are secondary effects to the baffle width but they can be used to tailor the lower frequency directivity by introducing or removing diffraction.Baffle step is the (rather smooth) transition from 4pi to 2pi radiation.
Diffraction is the interference of driver with "secondary sources" at the baffle edges, similar to comb filtering.
Putting extra shapes or roundovers on a basic box can have an effect but if you really want to control directivity and diffraction it needs to be planned at the start. The simplest solution is to limit flat baffle area and begin the edge treatment as close to the driver as possible, this is why trapezoidal baffles and chamfers are popular when a multiway speaker is used with increasing sizes of drivers. Revel's Salon 2 is another example of a more complicated way to try and acheive the same thing, reducing flat baffle area and having the edge start right next to the driver or waveguide.
The shape of the edge is a secondary factor to it's effective size. In the end all edge shapes that have the same effective size produce very similar results if the intent is to reduce diffraction.
Now that BEM simulation is accessible at little to no cost, the answers to how the shape and size of boxes and edges affect the response can be seen by anyone who can operate the programs and make the associated CAD models or meshes.
I and others have posted plently of these in different threads but it becomes hard to keep track of them all for reference.
Hi,Really?
So I can show you any regular polar plot for a typical waveguide. It has many small diffraction events at different times from different parts of the waveguide at different angles to the mic at each angle it's measured at, across various frequencies.
..could you look at it and make a chart of the diffraction spectrum and it's properties?
of course there is limits what is possible to do by eye, I'm no computer.
The superposition phenomenon is such that a frequency response ripple is pruduced by two or more interfering sounds whose. In a loudspeaker context direct sound strives for flat amplitude, so amplitude of the reflected soudn and delay between the sounds can be read from the interference. As demonstrated in previous post, there is only one delay that will produce matching ripple interval. Since the delayed sound is reflection or diffraction of the direct sound, the direct sound is loudest and dominates frequency response graph. Any secondary sound must have longer path length so attenuation, and makes ripple on the direct sound.
So, as long as interference is readable from the graph it is possible to see the delay and spectum a delayed sound has, split it in parts like the last image on the previous post does. If it's a polar map it's possible to see what kind of an object it is, from the diffraction interference to various angles. Polarmap is like a fingerprint, no other shape makes it the same, unless it has no diffraction, or very low diffraction.
Analyzing the graphs gets easier if there is visual of the object and knowledge it's a loudspeaker. For example, if you work on a waveguide and see ripple in measurement you can make educated quesses where the problem is. First of all, there must be secondary sound if there is ripple, and second of all, if it's high frequency ripple with long period in Hertz, it must have very short delay so it originated near the sound source, so from the throat or phaseplug or at the interface and you can shift your focus there. If the ripple starts from low frequency it must have longer delay and origin somewhere further in the device. Point is, secondary sound with short delay must be originating from short physical distance from sound source, long delay further away.
Waveguides and horns are special compared to square boxes with flat face, because their wall angle compared to observation point on axis is less than 90deg, the diffraction back wave does not propagate toward listening window but back inside the device, where it reflects and then goes toward listening window. Unless it happened at the mouth on a roundover so that it's great enough angle and also propagates toward the observer on-axis.
Typical speaker where a transducer is not inside a recession, like in a horn, there cannot be reflections so all ripple is diffraction (assuming ideal sources and non radiating surfaces of course).
All low frequency ripple has long delay, short delay cannot do ripple on low frequency. So if you see clearly interference around 1kHz and up, it must be secondary sound with at least half wavelength delay, but could be longer (and reduced amplitude on lows), exact delay you'd read from the period.
All these small nuggets of information help decipher what goes into a polarmap.
Neither am I 😉of course there is limits what is possible to do by eye, I'm no computer.
In order to build a low diffraction waveguide, and meet directivity targets a person should put themselves in the place of the wavefront and design it that way.
Yeah why not, seems sensible, although people think about stuff differently. I mean, everyone has different way of think about anything, imagine stuff. Someone might opt-in for 100x more iterations with computer so don't ever have to think about it too much, while someone who could visualize thisbstuff in their imagination, like you suggest, might be able to take shortcuts if the problem is seen and understood and reduce computer iterations needed to get to same goal. In the end waveguide optimization is better done with computer, detail gets too fine 😀
After doing enough of simulation, with thought involved, one starts to see baseline problems just from photos of devices, graphs of course, and what the relative performance is to something else, what works better than something else, and can quickly evaluate options in imagination. Basically coming up with rough shape knowing that when the shape is then optimized with computer to fine detail the performance gets really good. Of course it's not perfect as we are not computers, but sign of having some understanding of whats going on. Fine detail is just ripple on top of the fundamental. For example, one could think a concept which should work, but if it's not coming up in simulation one can learn from it, fundamental coukd be wrong, perhaps information was missing from the plan, or from knowledge, perhaps there is error in intuition or how the simulation was setup, and so on.
After doing enough of simulation, with thought involved, one starts to see baseline problems just from photos of devices, graphs of course, and what the relative performance is to something else, what works better than something else, and can quickly evaluate options in imagination. Basically coming up with rough shape knowing that when the shape is then optimized with computer to fine detail the performance gets really good. Of course it's not perfect as we are not computers, but sign of having some understanding of whats going on. Fine detail is just ripple on top of the fundamental. For example, one could think a concept which should work, but if it's not coming up in simulation one can learn from it, fundamental coukd be wrong, perhaps information was missing from the plan, or from knowledge, perhaps there is error in intuition or how the simulation was setup, and so on.
Last edited:
There are no computer simulations available that place all that information in front of you, at this time. Like I've said before you have to be looking at the right properties...Someone might opt-in for 100x more iterations with computer so don't ever have to think about it too much,
Mabat's math equations for waveguide profiles are fully parametrized and you could let algorithm churn results from random initial parameters. I think at least Mabat and Maiky76 and Tom Kamphuys have posted results from their algorithms in the ATH thread, although I think they have set some border conditions to make shortcuts and not started it from random. Really, I have no idea what they do and what their algorithms are. I've been personally iterating by hand as I lack knowledge on how to do it with algorithm, how to set error function and how to operate multiple software with various output formats automatically. I might try it some day, AI helps with stuff like this immensely, teaches how to do it.
Last edited:
Yeah it's not baked in to the ATH script provided, but I'm sure they have set up custom scripts around the process to automate all of it. I'm doing ABEC sims by hand and then automatically collect results for comparison with simple python scripts, but do the evaluation by eye and adjust from there, so only minor automation to reduce clicking and browsing. I'm sure more computer savvy can do result comparison numerically as well, since ABEC spits out numerical data. Of course one has to be able to set some ideal as goal for it, but that would be required with any kind of optimization procedure.
Searched the ATH thread for automation and Orreborre was likely the first, had evolution algorithm running on it almost four years ago:
https://www.diyaudio.com/community/...-design-the-easy-way-ath4.338806/post-6409168
edit. perhaps I misunderstood your post, yeah there is no computer program that would present all information in front, but that doesn't matter, only the result matter. One has to know beforehand what is a good result to set it as goal, and then iterate long enough trying to achieve that, or call it quits when close enough. Perhaps it turns out something is not possible, or that the process did "gradient descent to a wrong valley" and need to start over. But if one observes the process one learns to notice this stuff and gain general understanding what "good" performance means and what it takes to make happen, and have better initial setup for next set of iterations.
Last edited:
- Home
- Loudspeakers
- Multi-Way
- Edge Diffraction Testing - Shapes