Understood. That was part of my point. The other part I was talking about earlier is that it might depend a lot on the particular clock. Poor clocks are likely to jitter around and change more over time. Really, really good clocks are unlikely to change much no matter how long the delay, because their jitter is always very low.
In addition, I didn't mention some other factors that might come into the equation. For example: (1) dacs add their own jitter to any clock signal sent to them, and (2) many ADCs use internal PLLs for oversampling which may add its own jitter to any crystal reference clock fed into the ADC.
Moreover, part of the idea with oversampling dacs is that a few bits, maybe 5-bits, oversampled at a high enough frequency will average out to the equivalent of maybe 24-bits or so at a lower clock frequency. In that situation, the conversion to 24-bits takes place over multiple clock periods. Thus the effective clock period may correspond to a lower MCLK frequency. With every halving of MCLK frequency (doubling of period), in theory jitter (phase noise, actually) will be reduced by 6dB. Thus effective jitter for an analog signal coming out of the dac may be considerably less than the actual crystal MCLK jitter. However, for a one-bit dac such as Marcel's RTZ dac, the doubled BCLK jitter acts without the averaging effect of an oversampling mulit-bit dac (although it is a FIRDAC which can help some). So, not only may the effect of a delay depend on the clock quality, it may also depend on the specific dac architecture. Similar types of things for an ADC.
That's why I said the two error jitter model I described was simplistic; it was only to help develop some intuition as to causality.
Seems to me the obvious answer is probably to be able to use two independent clocks on different low noise power supplies (low noise so things like AC line harmonics don't cause unwanted correlation between clocks).
Last edited:
Mark
Jitter (phase noise) broad topic is not something I tend to explore here now.
Only a tiny bit of it:
Possible altering the jitter cancellation when loopback testing a soundcard through adding time delay on the analog signal of DAC-out/ADC-in.
On a specific implementation frame:
Just one sound card with it's DAC and ADC (Kosta's V2).
A few RGB58 cables of various lengths connecting the analog DAC-out/ADC-in.
REW's J-test at 44k1/16bit
If something comes up from those few tests, I'll report here.
George
The visual consequence of jitter is the widening of the "skirt" at the fundamental. Low jitter = sharp, narrow line. Higher jitter = wide skirt, smeared line. One can even relate the spectral distribution of the jitter to the shape of the skirt. This is not a quantitative measurement, but good for comparing DACs and/or ADCs, clocks...

^^^ That's maybe half-right, but at least its a good start. Please consider the diagram below:

Noise skirts consist of amplitude noise (AN) and phase noise (PN) that have become intermodulated with the audio signal, via some multiplicative process. Since such a process is nonlinear, intermodulation products (or in RF parlance, sidebands) are produced.
What is actually going on there, and why does the FFT spectral view look like that? Well, that part can seem a little complicated first, but actually its not so bad. To save me having to explain some basics all over again, I will quote something I said in another thread:
(1) FFTs have an averaging effect, the larger the FFT size (i.e the finer the frequency resolution) the more its giving an average measurement. (2) Standard spectral analysis doesn't show phase information in the plots, despite humans having some ability to hear phase at low frequencies, (3) Spectral lines have noise skirts at the base of the line; the skirts contain information about phase noise and amplitude noise that have become intermodulated with the audio signal, and (4) the height of spectral lines is not in general a measure of the signal's peak amplitude level nor of its audibility; its only a measure of peak amplitude and perhaps of audibility (neglecting masking) in the special the case of PSS (Periodic Steady State) signals, such as fixed level sine waves we use as test signals. Even if the test signals are PSS, it isn't always necessarily the case that the system response is PSS.
There was some other stuff I wrote in yet another thread that seemed to confuse some of the degreed engineers, so maybe I better try to explain that again from scratch.
What do AN and PN noise skirts mean in a spectral view FFT? How to interpret them? Maybe easiest to start to explain in terms of a dac. A dac needs two reference signals, a time reference and a voltage reference. Each is multiplied by the dac array to produce an analog output in the following ways: For AN, the dac array signal is multiplied by the refence voltage to produce the height of a dac output pulse. For PN, the dac array output signal is multiplied by the time period of the time reference in the horizontal (time) direction to produce the dac analog output pulse width. When the output pulses are integrated by the dac output filter, the area under the curve is modulated by noise in the output pulse height and or the output pulse time period length.
What does it mean in the time domain? The easiest to understand is AN. Say, a nominal 3.3v reference signal has 0.1Vrms of noise on it. Then the height of the spectral line should be going up and down in height by 0.1Vrms (assuming the spectral line peak value is 0dBFS). So, it is the full amplitude of the output signal that is being modulated up and down. In that process new frequencies have been created which are shown in the noise skirts. The amplitude of the noise skirt bins does not indicated the peak amplitude of the noise frequencies. Why? Its because FFT bins are a measure a average correlation of noise signal power with the bin frequency. If the noise is only at a particular bin frequency part of the time, then the average displayed value will be lower. However, the peak value for that bin may still be very high if it is for a shorter period of time on average.
For the PN component, it means the full height spectral line frequency is shifting to the left and right a little according to the phase variation. Why don't we see that more clearly on the FFT spectral display? Its because of the averaging effect of FFTs which I described in an earlier paragraph. To put the averaging effect into a different context, another way of looking at it is that the more resolution we have in the frequency domain, the less resolution we have in the time domain (a well known tradeoff of FTs). So, the more frequency resolution we have, the more things happening in the time domain are displayed as average values.
Now, since we may hear short time transients in music, it means some of the wiggling around of spectral lines due to PN and or AN may not show up very well in spectral views, but may still be of high amplitude and quite audible in time domain transients.
What is a good practical example of the effects? Well there are the filter options in HQ Player. The manual explains how some filters are better for time domain transients and some are better that favor averaging in the frequency domain, say, for slowly changing orchestral music (for example, filters that are steeper in the transition band).
My main point is that things are not so simple as they may at first seem, and FFT spectral view line heights don't necessarily relate to audibility except for the special case of PSS (periodic steady state) fixed sine wave test signals, and system responses that are also PSS. For non-PSS signals and responses, interpreting spectral displays can be much more difficult. But, no reason to panic. Science keeps moving ahead and methods are being developed to help separate AN effects from PN effects as seen in spectral line skirts.
EDIT: Even for common linear amplifiers noise skirts can indicate problems. Say, for example, there is a current feedback amplifier that uses Susumu RG resistors in the feedback path. According to some experiments I did with FIRDAC output resistors, Susumu RG had some of the more noticeable current noise effects (which have a 1/f-like spectrum). Since current noise resulting from a changing audio signal is a multiplicative process, the audio signal becomes intermodulated with the 1/f-like current noise source. Noise skirts will be seen in a spectral view FFT, and the sound may suffer substantially at LF despite no obvious indication in terms of nonlinear distortion spurs and or in the standard measurement fixed noise floor. The only measurement evidence would be noise skirts. How many people with AP 555x do you think will notice that? Probably none (IME); at least they may not notice if they don't do listening tests too, and know what to listen for.
Last edited:
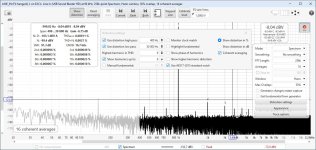
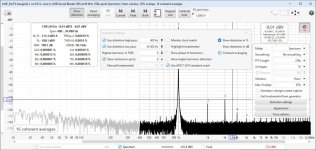
Second image looks a lot like correlated random-noise jitter. I say that because from the image in my last post it can be seen that AN is bounded, but PN is not. The shape of the noise skirts looks more like its of the unbounded PN type. Of course, the first image may show some noise skirts too if the FFT were more high resolution.