Oops, one more thing. Wesayso you mentioned the step response. I think it looks pretty much as expected for an unequalized line source response. You seemed to be implying there was something odd going on that I ought to look into. Care to elaborate?
Few
Few
If you take posts 157 and 158 from my view point it looks amusing.
I know of no designer of quality loudspeakers that does not use a microphone to measure his products.
And in turn I know that every good audio designer uses his favourite recordings to be the final arbitrator of the sound.
A microphone is a point in space in absence of our ear to ear spacing. In absence of proper pinae related transfer functions.
A mic is a useful tool. It is not your ears.
So why I find the two posts amusing is that both points of view are correct. And both are valid. Let your mic steer you in the right direction. Then use music or sounds that you know well to make your final adjustments.
If you have a mic or mics, record things in your home. Your wife, animals, outside. Things that are unmistakable in their reference to what you are used to. And play this back through your speakers. This will provide you the greatest test of fidelity.
Many if not most recordings have little to do with the actual acoustical event. They are artifices that are the results of personal tastes and opinions of the sound engineers.
Two cents from a guy who voiced his first commercial speaker in 1989. My microphone was a RadioShack SPL meter. I have grown a little in test equipment from back then. But still have the same set of ears. Ears rule!
Oops, one more thing. Wesayso you mentioned the step response. I think it looks pretty much as expected for an unequalized line source response. You seemed to be implying there was something odd going on that I ought to look into. Care to elaborate?
Few
If you look at the series of STEP responses you'll notice most wiggles are gone in the summed average. However that one slight wiggle that remains is nearly identical in all of the measurements.
It's just a matter of figuring out how to average out the room. You don't need to move much to the left and right, just enough to change the relative position of reflections from vertical planes. It shouldn't have a large effect on the high frequencies. I'm not suggesting to move more than 20" or 0.5 M to each side.
I agree that a mic isn't 100% representative to what our ears hear. I think the biggest problem with that isn't the mic's or our ear's resolution etc. It's the fact we listen with 2 of them. Offset from each other, at a different distance for each of us.
Once you figure out what that does to the sound we hear it will make a whole lot more sense why flat FR isn't always the full proof answer. Lot's of interesting discussions have gone deeper into that subject, which includes things like Stereo cross talk etc.
I don't agree with Ben's point of view in this particular case. Even though I personally measured at a single spot. You are trying to get an average pleasing result out in the room, right? Without changing the room into a studio. In that case you're well on your way as the best thing would be to "separate" the speakers from the room as much as possible with measurement techniques. The speakers would still use the room but single reflections are averaged out, only the stuff in common at every measurement is retained.
Only moving up or down to see the theory lining up with real room results at 2 M is hard to do. It might already include some common room effects in common along the vertical axis.
@wesayso
You know this or sure. Microphones are an interpretive tool. I know that is a contradiction to known fact. We measure mics in fractions of a decible and degrees of phase. And we use and design correction methods to linearize them in very exacting repeatable methods.
And then we shove them on a mic clip on a stand and start using them. All a person has to do is a little reasoning through the possible changes in response of real life measurement situations. There is a very valid point to doing measurements in a reflection free field. Be it the great outdoors or an anechoic chamber. I have measured in both situations. And I do the bulk of my measurements in a live room that is anything but forgiving in it's response anomalies. But I know what to look or because of dogged familiarization of what changes in response occur when I make a change in mic position.
There are some simple rules of thumb to determine response anomalies related to mic and boundary positions.
A good friend of mine (Dave Dal Farra) created this spreadsheet to do the grunt work in the calculation of mic height versus reflective boundaries. Dave has a great ear for loudspeaker design and I respect his choices in both measurement methods and final voicing.
TinyUpload.com - best file hosting solution, with no limits, totaly free
If you take posts 157 and 158 from my view point it looks amusing.
I know of no designer of quality loudspeakers that does not use a microphone to measure his products.
And in turn I know that every good audio designer uses his favourite recordings to be the final arbitrator of the sound.
A microphone is a point in space in absence of our ear to ear spacing. In absence of proper pinae related transfer functions.
A mic is a useful tool. It is not your ears.
So why I find the two posts amusing is that both points of view are correct. And both are valid. Let your mic steer you in the right direction. Then use music or sounds that you know well to make your final adjustments.
If you have a mic or mics, record things in your home. Your wife, animals, outside. Things that are unmistakable in their reference to what you are used to. And play this back through your speakers. This will provide you the greatest test of fidelity.
Many if not most recordings have little to do with the actual acoustical event. They are artifices that are the results of personal tastes and opinions of the sound engineers.
Two cents from a guy who voiced his first commercial speaker in 1989. My microphone was a RadioShack SPL meter. I have grown a little in test equipment from back then. But still have the same set of ears. Ears rule!
🙂 you don't have the same ears 🙂 loss of high frequency ! By now 🙁
Here's an attempt to more closely duplicate Bolserst's model results.
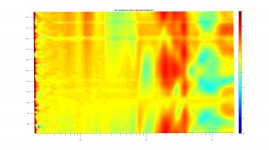
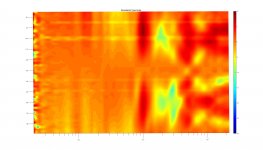
I measured one planar magnetic tower (grills on, no eq, no crossover) with the mic 2 meters away. I varied the mic height in 2 cm increments from 75 to 189 cm above the floor. That's 58 measurements that start near(-ish) the bottom of the second panel and go up to about the top of the third panel.
To mimic Bolserst's graphics, at least to some extent, I adopted his "floor is at the top of the graph" orientation. So the y axis is height above the floor, the x axis is frequency, and the color depicts SPL.
The same data are displayed three ways.
1) No normalization, just raw SPL
2) Normalized to the response at mic height=157 cm (center of third panel)
3) Normalized to the response at mic height=127 cm (center of tower = gap between panels 2 and 3).
There are a couple of spurious measurements contributing horizontal stripes but I think the overall pattern is still discernible. Recall that Bolserst's model covered 180 cm of height centered on the center of the tower. My measurements only span 114 cm and they're not perfectly centered on the tower center--that's all I could reach with my mic-holding tripod. Plus 58 measurements was plenty, especially with Room Eq Wizard misbehaving in several ways.
In another post I'll show the raw measurements so folks can more readily point out where I made missteps in my analysis.
Few
P.S. I see that when uploaded the text on the graphs is tough to read. Matlab has a funny way of creating jpegs. I'll try to avoid that problem in the future.
Attachments

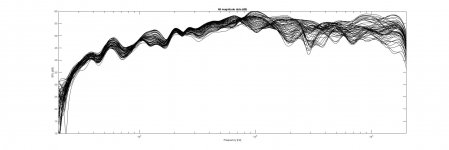
Here are the raw measurements, magnitude only---no phase displayed. I haven't averaged the measurements yet because I need to debug my program that extracts an impulse response from the magnitude and phase data from Room Eq Wizard. I want to be sure the impulses look properly aligned before averaging the measurements. REW provides the basic functionality but I'm not going to mess around with its two-at-a-time A+B command for 58 measurements. That means getting everything sorted out in another environment.
Few
Few
Attachments
🙂 you don't have the same ears 🙂 loss of high frequency ! By now 🙁
I have treated them well. I wear hearing protection when measuring or working on products in my shop. ( I have a full cabinetmaking shop )
So the ears are still useful to 15.3khertz. Not much music up there to miss.
And if the same ears here a live event, they will still hear the event as it is. You or I anyone can hear the same event and have a listen. The reference is the music. The means to enjoy it is our ears.
I love music. It's the reason why I got into this crazy business in the first place!
Last edited:
I received some good advice: export the impulses as .wav files rather than spl and phase as .txt files. I sharpened up my fourier skills a bit by trying to start with the spl and phase data but the impulses are easier to work with.
I want to play with some impulse averaging but before doing that I also wanted to see if the impulses could be used to help visualize the wavefront 2 m in front of the speakers, where the measurements were made. I may be the only one who finds these interesting but I'll toss 'em in here anyway. I find them intriguing.
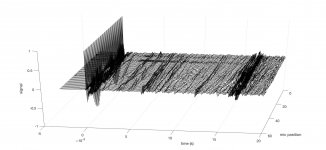
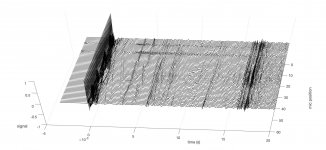
The attached figures are from the same data set I posted yesterday. It's just the 58 measurements, this time displayed as impulse responses stacked in order of mic position (floor to the rear of the first two plots, I believe). The mic was moved vertically 2 cm between measurements.
In the first graph there are ridges that run ~parallel to the wall of impulses (which I manually placed at t=0). There are also some ridges running at other angles. It seems like the angle of the ridge should reflect the location of the source of the reflection. Ridges parallel to the impulses are reflections from walls--they arrive at the same time no matter what the mic height is. The ridges at odd angles come (I'm guessing) from the floor or ceiling or some other obstruction that isn't parallel to the speaker.
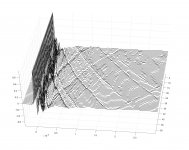
The second graph is the same thing viewed from a lower angle. I noticed that the impulse swings negative immediately after the main positive spike, and does so in a way that depends systematically on mic height. There are two large lobes of negative-going signal visible below the main plane of the graph.
To make those lobes more visible I'll throw in one more graph, this time viewed parallel to the time axis. The broad negative-going lobes are readily visible. I calculated where the most negative-going points are spatially and they occur at the same heights as the centers of the two planar panels. A few of the measurements also have some signal to noise issues. About one of ten runs left me with complete garbage and it looks like a few "slightly garbage" measurements escaped my notice.
I also discovered that I need a better way to move the mic truly vertically. My tripod mic-stand makes it very cumbersome to keep the mic-speaker distance constant if the mic is moved a long way. I think there are some glitches in these plots as a result.
Those glitches may be masked by the fact that REW doesn't retain information about the actual arrival time of the impulse when the .wav files are exported. The impulses are forced to arrive 1 second into the measurement. Kind of a bummer. I'm guessing I could learn a bit more if I moved the mic more carefully and retained the absolute timing in the data.
Few
I want to play with some impulse averaging but before doing that I also wanted to see if the impulses could be used to help visualize the wavefront 2 m in front of the speakers, where the measurements were made. I may be the only one who finds these interesting but I'll toss 'em in here anyway. I find them intriguing.
The attached figures are from the same data set I posted yesterday. It's just the 58 measurements, this time displayed as impulse responses stacked in order of mic position (floor to the rear of the first two plots, I believe). The mic was moved vertically 2 cm between measurements.
In the first graph there are ridges that run ~parallel to the wall of impulses (which I manually placed at t=0). There are also some ridges running at other angles. It seems like the angle of the ridge should reflect the location of the source of the reflection. Ridges parallel to the impulses are reflections from walls--they arrive at the same time no matter what the mic height is. The ridges at odd angles come (I'm guessing) from the floor or ceiling or some other obstruction that isn't parallel to the speaker.
The second graph is the same thing viewed from a lower angle. I noticed that the impulse swings negative immediately after the main positive spike, and does so in a way that depends systematically on mic height. There are two large lobes of negative-going signal visible below the main plane of the graph.
To make those lobes more visible I'll throw in one more graph, this time viewed parallel to the time axis. The broad negative-going lobes are readily visible. I calculated where the most negative-going points are spatially and they occur at the same heights as the centers of the two planar panels. A few of the measurements also have some signal to noise issues. About one of ten runs left me with complete garbage and it looks like a few "slightly garbage" measurements escaped my notice.
I also discovered that I need a better way to move the mic truly vertically. My tripod mic-stand makes it very cumbersome to keep the mic-speaker distance constant if the mic is moved a long way. I think there are some glitches in these plots as a result.
Those glitches may be masked by the fact that REW doesn't retain information about the actual arrival time of the impulse when the .wav files are exported. The impulses are forced to arrive 1 second into the measurement. Kind of a bummer. I'm guessing I could learn a bit more if I moved the mic more carefully and retained the absolute timing in the data.
Few
Attachments

Sorry. I was suffering from a CRI. I had space and time flipped around in my head. The American political situation has me a bit turned around these days.
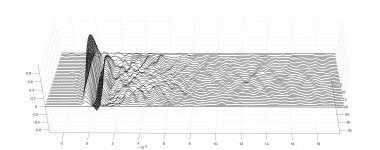
Here's yet another view of the impulse responses, this time with an effort to make it easier to visualize it all in space. In the dominant plane of the graph (call it the xy plane) the limits are set so the same spatial scale can be used in both x and y. What I was previously calling floor or ceiling reflections should have been called reflections, or at least discontinuities, from the gaps between the planar drivers. I don't yet know if it's from the gaps or from reflections from the braces that span the gaps. They occupy the same space so it's a little tricky. Either way, they nearly overlap with the direct sound right where the gaps exist in space (between the diaphragms).
So I'm inclined to think this sort of measurement makes it possible to identify clearly in space where reflections/discontinuities are coming from---at least in some situations. I'm surprised it seems so clear, given the fact the measurements were made from 2 m away from the speakers.
I'm not firing on all cylinders today so I reserve the right to pretend I never posted this if it turns out to be completely wrong...
Few
Attachments
Before breaking out of measurement mode I figured I'd repeat the previous batch but without any low pass on the midrange.
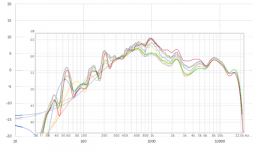
Somebody has been very busy!So which curve serves as the better reference point for equalization? That broad 3-5 dB difference between 800 and 8000 Hz is certainly not going to sound subtle.
As I mentioned via PM, the average curve is what the line source is projecting into the room(ie your first-arrival signal). The MMM is what you get if you average up the first-arrival plus the room reflections. Which better serves as a reference point for EQ is certainly going to be up for debate/experimentation. Personally, I usually use the first arrival as a starting point for setups since every room will be different and how our perception of tonal response is affected by each room will be different…but they tend to be localized increments off of the first arrival curve.
Since you were kind enough to supply me with your REW data, I converted to *.wav files and used ARTA to perform averaging in the time domain. Then, you can see how the first arrival average curve morphs into the MMM curve as you lengthen the window and include more and more of the room. Note in particular that there is a strong reflection between 15mS and 20mS that accounts for a bit over half of the difference between the two curves at 1kHz, but further up in frequency isn't filled in much till past 40mA. By 500mS the full MMM results are pretty much attained.
Attachment #1, 2 Time domain averaged impulse response showing room decay and reflections.
Attachment #3 Frequency response of time averaged impulse response with increasing window size.
Attachment #4 Overlay with your REW frequency domain averaging and actual MMM measurement
Attachments

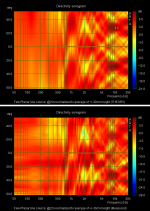
I received the *.wav files for your measurements, and then duplicated the range of heights you used analytically. The attachment shows the comparison with both theory and experimental results averaged over the height range between the middle of the 2nd and the middle of the 3rd planars. Even with all the measurement setup variations you mentioned I think the similarity is, as you said, quite striking.Here's an attempt to more closely duplicate Bolserst's model results.
Very nice visual. I agree that the criss-crossing patterns are due to the gaps between the planars…at least that is what I’m seeing in the theoretical results. I could send you some sets of *.wav files for impulse responses of your line array with and without floor and ceiling mirrors to plot up in a similar fashion if you would like.What I was previously calling floor or ceiling reflections should have been called reflections, or at least discontinuities, from the gaps between the planar drivers. I don't yet know if it's from the gaps or from reflections from the braces that span the gaps.
Attachments
Somebody has been very busy!
The MMM is what you get if you average up the first-arrival plus the room reflections. Which better serves as a reference point for EQ is certainly going to be up for debate/experimentation. Personally, I usually use the first arrival as a starting point for setups since every room will be different and how our perception of tonal response is affected by each room will be different…but they tend to be localized increments off of the first arrival curve.
You've done exactly what I asked Few to do a couple of posts ago, looking at the averaged sum in a longer time frame to see if it lines up with the MMM measurement. I knew it would.
What to EQ? In my humble opinion you have only one valid choice. Why? because if you EQ based on the averaged sum, you're EQ-ing the first wave front that actually hits the mic (and ears) and it will correct the speakers, not the room (as much). All of the later room additions will still colour the perceived tonal balance, but EQ-ing the first wave front will make imaging better and even make the later plots look much cleaner, such as a new MMM measurement.
This does not exclude you from altering your "room curve" to account for the room additions as shown by a MMM. You can still use broad stroked EQ to make the perceived tonal balance to your liking to account for that.
Doing it the other way around you're not fixing the first arrival wave front, which is responsible for the imaging queues.
I would not base any EQ on this set of measurements as nothing was done to average out the vertical planes which are parallel to the arrays.
I'd take a new set of measurements at the average envisioned listening distance and at average listening heights (a little up, a little down, a little to the left and a little to the right... it does not need to be a very large/wide area of measurements), taken around the exact sweet spot.
Make a sum of these measurements and look at a cycle of 5-6 to base the EQ upon.
The MMM will be your guide to determine a (starting) room curve, You'll know where you have extra energy in the room. Fixing that first wave front maximises all imaging queues, fixing the overall frequency balance will give you the right tonal balance. These two are separate mechanisms in our perception. The sense of Imaging is based on very tiny time differences. Tonal balance is perceived over a longer time frame.
As these measurements were at 2 meter, the late reflections will probably be a little bit earlier at the final listening distance. As long as they are late enough (hopefully after 10- 15 ms) they might actually give a very pleasing sense of envelopment. Early reflections mess with imaging, later reflections can even be pleasing and aid in imaging. They can fill in the dips that cross talk of left speaker entering the right ear and vice versa create. It will actually give more sense of depth of the stage.
If you do the above, as a basic guideline, you can listen over a longer time frame (weeks at a time) and use broad stroke EQ to lock in your favourite room curve over time using many pieces and genres of music. EQ-ing the first wave front will keep imaging working as it should. As long as you don't have a lot of strong early reflections present (earlier than ~7 ms, I personally shoot for a clean 20ms, but that means using damping panels)
Check out the RT30/60 times in these measurements in REW, they will show the extra room coloration that exists between the early wave front and the MMM. Some extra curtains, carpets, cushions etc. could help out, or some hidden damping panels pretending to be posters or paintings 🙂.
If you want to see what's different from EQ-ing first wave front or using the MMM, just look at very early waterfall plots after EQ-ing with both methods separately. I can predict which one of those will look better!
Waterfall settings to use as an indication:

The cleanest looking waterfall would be the winner. That's the one with the best imaging queues.
Separate from this the (overall ungated or gated ~25/30 ms *) FR curve would determine tonal balance as perceived.
(*) depending on room.
Try both and pick the winner, that's how you learn, right? But please include some variation to the left/right sides in the final measurements for EQ-ing. It would be a shame not to do that, that's the one thing line arrays don't average out by themselves. You won't regret the time spend.
Last edited:
I think I agree with your approach, I want to try rewording it to make sure.The MMM will be your guide to determine a (starting) room curve, You'll know where you have extra energy in the room. Fixing that first wave front maximises all imaging queues, fixing the overall frequency balance will give you the right tonal balance. These two are separate mechanisms in our perception. The sense of Imaging is based on very tiny time differences. Tonal balance is perceived over a longer time frame.
1) EQ based on the first-arrival curve, including small hill and valley features in the response.
2) Make broad smooth adjustments to 1) based on MMM around your listening position or on perceived tonal balance. Do not adjust small features based on MMM.
3) If you plan to listen in different parts of the room at times, you may need to adjust 2) or come up with an average for several listening areas, but you would never change 1).
Is that it?
Is this recommendation of adding in left/right variations for the first-arrival EQ? or for the better adjusting the room tonal balance after first-arrival EQ is set. It certainly makes sense for the adjusting the room. If you found it necessary for the first-arrival do you think it was to help average out an early reflection? Or average out a feature of your sound source or enclosure diffraction.… But please include some variation to the left/right sides in the final measurements for EQ-ing. It would be a shame not to do that, that's the one thing line arrays don't average out by themselves. You won't regret the time spend.
Last edited:
Wow, Bolserst, which sonogram did you say is the measurement and which is from the model?? It almost doesn't matter! Pretty cool. Seeing where the actual speakers align with a "perfect" version of the same construction definitely helps me zero in on areas where I can make improvements. The graphs showing at which times the room affects each frequency range are enlightening as well. All very helpful indeed--thanks so much for all your work.
I see that while typing a longer post the conversation about how to approach equalization has continued. I'll therefore address just one more point here.
In response to Wesayso: I didn't include horizontal measurements in this set of data because I wanted to compare my measurements with Bolserst's modeling results. His sonograms involved no horizontal averaging.
Once I had the 58 measurements in hand I was also able to use the impulse responses to see that some of the early ripples I've observed come from the gaps between the panels. I wasn't able to reach that conclusion looking at individual impulse responses or averages over two spatial dimensions. Now I can play with attempts to minimize the impact of the gaps. I don't yet know how much they affect sound quality but at least now I have a tool for measuring them unambiguously.
I'll chime in separately regarding the approach to equalization.
Few
I think I agree with your approach, I want to try rewording it to make sure.
1) EQ based on the first-arrival curve, including small hill and valley features in the response.
2) Make broad smooth adjustments to 1) based on MMM around your listening position or on perceived tonal balance. Do not adjust small features based on MMM.
3) If you plan to listen in different parts of the room at times, you may need to adjust 2) or come up with an average for several listening areas, but you would never change 1).
Is that it?
1) correct, using a frequency dependent view on the sum to really only see the first arrival.
2) Also correct, only perceived tonal balance (low Q) edits of the corrected results from 1.
3) This could work, chances are the perceived balance after doing 1 + 2 will provide a pretty pleasing result in a large area.
Is this recommendation of adding in left/right variations for the first-arrival EQ? or for the better adjusting the room tonal balance after first-arrival EQ is set. It certainly makes sense for the adjusting the room. If you found it necessary for the first-arrival do you think it was to help average out an early reflection? Or average out a feature of your sound source or enclosure diffraction.
The left/right variations are recommended to sort out reflections from planes parallel to the arrays. Due to their vertical size they "average out" a lot of in room objects in a room, except for large vertical parallel planes.
It would be good to take a close look at the IR to see the level of reflections left after the averaging process.
Filtering the IR to see what happens at each frequency is one way, the left/right variation would filter out all that is common in a measurement that only has its measurement points up and down. No need to sway far left or right. Just enough to change the relationship between the direct sound and a reflection coming from a side wall etc. Only moving the mic up and down does not change that relationship.
I see that while typing a longer post the conversation about how to approach equalization has continued. I'll therefore address just one more point here.
In response to Wesayso: I didn't include horizontal measurements in this set of data because I wanted to compare my measurements with Bolserst's modeling results. His sonograms involved no horizontal averaging.
Once I had the 58 measurements in hand I was also able to use the impulse responses to see that some of the early ripples I've observed come from the gaps between the panels. I wasn't able to reach that conclusion looking at individual impulse responses or averages over two spatial dimensions. Now I can play with attempts to minimize the impact of the gaps. I don't yet know how much they affect sound quality but at least now I have a tool for measuring them unambiguously.
I'll chime in separately regarding the approach to equalization.
Few
I can perfectly understand you wanted to compare theory with real life results. Hence sticking to these vertical measurements.
I just mentioned what would be my preferred choice to use as a base for EQ and why. Too many times we leave things open for interpretation. So I wanted to paint a clear picture. 🙂
So far things are looking quite good! I'm sure you'll find a good recipe.
Be warned though, REW's frequency dependent window is somewhat smoothed when compared to other tools. I've shown an example of that here:
http://www.diyaudio.com/forums/multi-way/221434-rephase-loudspeaker-phase-linearization-eq-fir-filtering-tool-172.html#post4974493
Thanks for the suggestions and support guys. The equalization procedure Wesayso and Bolserst suggest is consistent with what I've read elsewhere and it certainly seems reasonable.
The question of what counts as "first arrival" is interesting. If windowing eliminates room effects then horizontal averaging is useful if 1) the speaker's response changes quickly with horizontal angle (azimuth), or 2) there are early reflections (perhaps off baffle edges) that can't be windowed away. I've already shown that my MTM dipole geometry makes the frequency response quite independent of azimuth. I would be surprised, though, if I didn't see some early reflections off the tower frame. So that's something I should look into more carefully. If and when I find them I'll have to wrestle with the question of what to do about them.
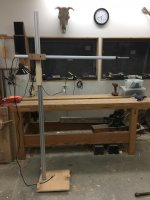
To avoid more hassles with my mic-supporting tripod I assembled a new mic stand (see attached photo). Perhaps not the best use of my afternoon, but if I end up repeating the vertical measurements I'd like to have more range and avoid worries about the mic's trajectory not being truly vertical (parallel to the speaker array). With the new rig I can adjust the feet to make the vertical member truly vertical, and I won't need to extend tripod legs mid-session to gain enough range. That dance with the tripod always screwed up my alignment and slowed me way down.
This doesn't yet provide an easy way to make measurements at a fixed height but different azimuth, though. I want to try that to see if the impulse response visualization technique works as well on that axis as it did vertically. If I just want to worry about reflections off the towers themselves, and not the room, it would probably be easiest to rotate the speaker and keep the mic stationary. I could slap together a simple rotation stage for that purpose.
Don't worry about the skull on the wall in the photo. It's just there to keep me honest.
Few
The question of what counts as "first arrival" is interesting. If windowing eliminates room effects then horizontal averaging is useful if 1) the speaker's response changes quickly with horizontal angle (azimuth), or 2) there are early reflections (perhaps off baffle edges) that can't be windowed away. I've already shown that my MTM dipole geometry makes the frequency response quite independent of azimuth. I would be surprised, though, if I didn't see some early reflections off the tower frame. So that's something I should look into more carefully. If and when I find them I'll have to wrestle with the question of what to do about them.
To avoid more hassles with my mic-supporting tripod I assembled a new mic stand (see attached photo). Perhaps not the best use of my afternoon, but if I end up repeating the vertical measurements I'd like to have more range and avoid worries about the mic's trajectory not being truly vertical (parallel to the speaker array). With the new rig I can adjust the feet to make the vertical member truly vertical, and I won't need to extend tripod legs mid-session to gain enough range. That dance with the tripod always screwed up my alignment and slowed me way down.
This doesn't yet provide an easy way to make measurements at a fixed height but different azimuth, though. I want to try that to see if the impulse response visualization technique works as well on that axis as it did vertically. If I just want to worry about reflections off the towers themselves, and not the room, it would probably be easiest to rotate the speaker and keep the mic stationary. I could slap together a simple rotation stage for that purpose.
Don't worry about the skull on the wall in the photo. It's just there to keep me honest.
Few
Attachments
I made a simple turntable for the towers so I could vary the speaker orientation precisely. I made a sequence of measurements with the mic 1 m from the speaker, and just above the midpoint of the tower. I chose that height because I wanted to find an impulse response that wasn't too complicated without adding lots of equalization. That height was the best I could find.
I included my 1000 Hz Bessel low pass on the midrange because I didn't want the measurements to be dominated by the beaming of the midrange when it's run full range. To compensate, I put a high shelf equalization on the tweeter, starting a bit below 1000 Hz, to raise its level to match that of the midrange. I also used my usual very shallow filter to cut the response below 50 Hz. Other than that the towers were run as-is.
I made measurements starting in the plane of the speakers, where their dipole radiation would ideally give a null. I rotated the speaker 5 degrees between measurements until I had wrapped around to the other side of the speaker, so I covered 180 degrees. 90 degrees means right in front of the speaker.
The attached graphs show the resulting impulse responses displayed a few different ways. I wanted to see if my impulse plotting approach would reveal reflections off the edges of the towers or other structures.
Caveats: Room Eq Wizard sets the impulse arrival to 1 second no matter what you do with the loop back reference. Also, all the impulses were normalized so that the maximum amplitude is 100%. That means I lost absolute timing and absolute amplitude information. A bit of a bummer but I don't know how to avoid those two limitations with REW.
The loss of absolute timing isn't too big a problem for this exercise, but I would have liked to have retained the true amplitude information. Without it, I've had to fudge things a bit. The first three graphs show less response near the plane of the speaker because I've multiplied the responses by sin(theta) to mimic the ideal dipole behavior. The fourth graph does not include the sin(theta); the raw (normalized by REW) data are shown. The raw data show exaggerated noise near the plane of the speaker because REW magnified the signal to compensate for the dipole loss.
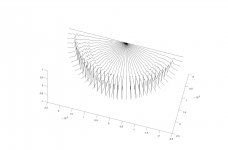
Graph 1: The 37 impulse responses, each multiplied by sin(theta). The middle graph in the set corresponds to the speaker being aimed at the mic.
Graph 2: The same as graph 1 but I oriented the impulses so they indicate the direction of the mic relative to the speaker. This way the impulses can be visualized in space more directly. Picture the speaker located at the intersection of all the lines. Note that I chose to place the first arrival of the impulse far from the speaker with subsequent times appearing closer to the center of the graph. I had to "reverse time" to do this but it's more physical this way.
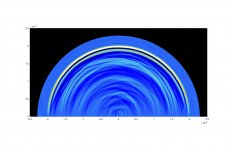
Graph 3: This is a colormapped version of graph 2. Think of looking down on the speaker which is centered at the bottom of the graph, with the sound radiating outward. The bright rim near the outside edge is the main impulse. It is the first to arrive at the mic. The ripples closer to the center of the half-circle are the tails of the impulses that arrive later.
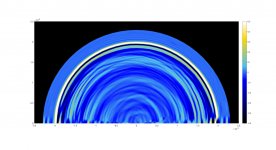
Graph 4: Same as graph 3 except no sin(theta) was used. There are more ripples in the responses off to the sides of the speaker because of REW's normalization procedure.
So what did I learn? Well I'm open to input from others, but I don't see big screaming reflections from the edges of the tower frame as I feared I might. I tried to think before measuring so I would know what to look for but maybe I'm not thinking correctly. I expected to see in all the radial graphs (numbers 2, 3, and 4) some ripples that appear to be radiating from the speaker edges---points on both sides of the center of the graph.
To know where to look I measured the speaker width and found the edges of the tower are 10-12 cm from the center (depending on what you call the important edge). 10 cm corresponds to 290 microseconds. So in the plane of the speaker the direct sound travels 1 m from the tweeter to the mic. A reflection from the far edge of the tower frame would travel 1 m plus 2 x 10 cm, so it should arrive 0.58 ms after the direct tweeter signal.
After making the attached graphs I zoomed in a bit so I could look for ripples seeming to come from the +.58 ms and -.58 ms points on the colormapped graphs. I think there may be something faint there but I found I had to really be looking for it to see it. I'll have to try to create a really nasty reflection artificially at that edge and see if it behaves as I'm imagining it would. In the meantime, I'll post what I have in case anyone find's them interesting.
Few
I included my 1000 Hz Bessel low pass on the midrange because I didn't want the measurements to be dominated by the beaming of the midrange when it's run full range. To compensate, I put a high shelf equalization on the tweeter, starting a bit below 1000 Hz, to raise its level to match that of the midrange. I also used my usual very shallow filter to cut the response below 50 Hz. Other than that the towers were run as-is.
I made measurements starting in the plane of the speakers, where their dipole radiation would ideally give a null. I rotated the speaker 5 degrees between measurements until I had wrapped around to the other side of the speaker, so I covered 180 degrees. 90 degrees means right in front of the speaker.
The attached graphs show the resulting impulse responses displayed a few different ways. I wanted to see if my impulse plotting approach would reveal reflections off the edges of the towers or other structures.
Caveats: Room Eq Wizard sets the impulse arrival to 1 second no matter what you do with the loop back reference. Also, all the impulses were normalized so that the maximum amplitude is 100%. That means I lost absolute timing and absolute amplitude information. A bit of a bummer but I don't know how to avoid those two limitations with REW.
The loss of absolute timing isn't too big a problem for this exercise, but I would have liked to have retained the true amplitude information. Without it, I've had to fudge things a bit. The first three graphs show less response near the plane of the speaker because I've multiplied the responses by sin(theta) to mimic the ideal dipole behavior. The fourth graph does not include the sin(theta); the raw (normalized by REW) data are shown. The raw data show exaggerated noise near the plane of the speaker because REW magnified the signal to compensate for the dipole loss.
Graph 1: The 37 impulse responses, each multiplied by sin(theta). The middle graph in the set corresponds to the speaker being aimed at the mic.
Graph 2: The same as graph 1 but I oriented the impulses so they indicate the direction of the mic relative to the speaker. This way the impulses can be visualized in space more directly. Picture the speaker located at the intersection of all the lines. Note that I chose to place the first arrival of the impulse far from the speaker with subsequent times appearing closer to the center of the graph. I had to "reverse time" to do this but it's more physical this way.
Graph 3: This is a colormapped version of graph 2. Think of looking down on the speaker which is centered at the bottom of the graph, with the sound radiating outward. The bright rim near the outside edge is the main impulse. It is the first to arrive at the mic. The ripples closer to the center of the half-circle are the tails of the impulses that arrive later.
Graph 4: Same as graph 3 except no sin(theta) was used. There are more ripples in the responses off to the sides of the speaker because of REW's normalization procedure.
So what did I learn? Well I'm open to input from others, but I don't see big screaming reflections from the edges of the tower frame as I feared I might. I tried to think before measuring so I would know what to look for but maybe I'm not thinking correctly. I expected to see in all the radial graphs (numbers 2, 3, and 4) some ripples that appear to be radiating from the speaker edges---points on both sides of the center of the graph.
To know where to look I measured the speaker width and found the edges of the tower are 10-12 cm from the center (depending on what you call the important edge). 10 cm corresponds to 290 microseconds. So in the plane of the speaker the direct sound travels 1 m from the tweeter to the mic. A reflection from the far edge of the tower frame would travel 1 m plus 2 x 10 cm, so it should arrive 0.58 ms after the direct tweeter signal.
After making the attached graphs I zoomed in a bit so I could look for ripples seeming to come from the +.58 ms and -.58 ms points on the colormapped graphs. I think there may be something faint there but I found I had to really be looking for it to see it. I'll have to try to create a really nasty reflection artificially at that edge and see if it behaves as I'm imagining it would. In the meantime, I'll post what I have in case anyone find's them interesting.
Few
Attachments
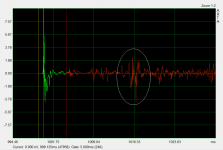
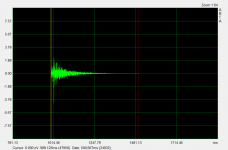
A quick reflection test. I turned the speaker so the mic is looking almost at the speaker's edge (theta of around 5 degrees using my earlier convention). I made two impulse response measurements. One with the speaker as-is, and the second while holding a piece of foam core board at the edge of the speaker's frame. The board's plane was perpendicular to the speaker's plane, and the board projected to the front of the speaker but not to the back.
I've attached the two impulse responses. Blue is with no board, red is with the board.
The board was about 12 cm away from the center of the tweeter so a reflection should arrive around 0.7 ms after the first arrival. This measurement shows a 0.68 ms delay; close enough for government work.
So I think I was looking in the right place when seeking signs of edge reflections. I don't have the patience to redo all the measurements with a reflector purposely installed on the speaker. I guess I need a more automated measurement scheme!
For now I'll go away satisfied that the dipole radiation pattern, and my efforts to avoid projections near the planar diaphragms, do a decent job of avoiding major reflections. That said, there are ripples in the frequency response that come from the finite baffle width so maybe the moral of the story is that the frequency domain is a better place to search for the effect. I still find the time domain, when viewed sort of as a space domain, makes some features easier to identify. If nothing else I've had a little fun.
Few
EDIT: I think my last paragraph gets too close to conflating the diffraction that happens at the edge of a dipole with finite width baffle and the reflections that could arise from projections (or cavities) encountered by the sound as it moves away from the diaphragm. I believe frequency response ripples I've seen below 1 KHz have mostly been the result of interference between the out-of-phase back wave sound diffracting around the baffle and interfering with the front wave sound at the mic.
Attachments

Last edited:
- Home
- Loudspeakers
- Planars & Exotics
- DIY planar magnetic + open baffle woofer array