That is because the response was normalized to that height. (ie it was assumed EQ was applied to make the measured response flat at the height). Back in Post #132 I actually provided two sets of plots, one normalized at the tower midpoint(h = 0) and one normalized close to the center of the 3rd planar (h=28). I combined them in the attachment so you can compare. The data is exactly the same, it just makes a different assumption as to what listening height you had used to EQ flat.I noticed in your reflection-free simulations that the response looks quite smooth right along the tower midpoint. For example, the top right sonogram in your most recent set (post #137) shows quite uniform response along the 0 degree axis.
The alternate method(bottom plot in attachment) is to determine the average response and normalize based on that.
Of course when normalizing by an average response there will not be a single height for which there is a smooth response.
But, this is probably more representative of what your goal is for EQ.
Yes, yes I did 😀I'm assuming that your model assumes (follow that?)
The assumption is that your planars perform as ideal massless dipole radiators driven by frequency independent force:
1) near field has flat response
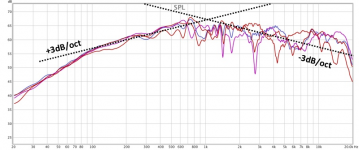
2) based on 1), at distant measurement points from the line array, the overall response trend will tilt up at roughly +10dB/dec (+3dB/oct).
You hadn’t shown any non-EQ’d measurements, but I’m guessing due to mass of diaphragm and conductors that the near field response is transitioning to a -6dB/oct roll off in the top octave and the distant measurements shift from a +3dB/oct tilt to a -3dB/oct tilt at higher frequencies. But, none of that will change the normalized sonogram/polar plots.
Vanderkooy’s equations have the dipole and proximity effects of dipole sources “built in”.
Attachments
"That is because the response was normalized to that height."
Well, that would do it! I missed that when I looked only at the later plots. Thanks for the clarification.
Way back in post #16 there's an unequalized nearfield measurement but I hadn't yet imported the generic mic calibration file or installed the felt at that time. Also, I took those measurements with the grill cloth in place and that definitely attenuates the higher frequencies. So there's a measurement there but it's probably got too many complications in the mix to be of great use. The next time I have a chance for a measurement session I can make a more useful nearfield measurement.
Few
Thanks for pointing me to those measurements 🙂
Just curious, was the midrange portion of the planars being driven with the same signal as the tweeter?
Other than the droop at the very top(which, as you pointed out, is likely from the mic) those measurements line up pretty well with the expected sloping behavior I described.
Apologies for not getting the examples of averaged plots for EQ posted yet.
Life has a nasty habit of interfering with hobbies. The number crunching is complete, I just need to get back and generate the plots.
Attachments
Yes, at that early stage I was sending the same signal, full-range except rolled off below ~50 Hz, to both the midrange and tweeter. Interesting to see the slopes match. I was convinced there would be an additional slope from the grill cloth but maybe its effect is fairly flat up there. I'll have to compare my with- and without-grill measurements to find out.
There's certainly no need to apologize for "delays." On the other hand, don't expect full payment until the job is completed.😀
These hobbies can sure become time consuming...
Few
There's certainly no need to apologize for "delays." On the other hand, don't expect full payment until the job is completed.😀
These hobbies can sure become time consuming...
Few
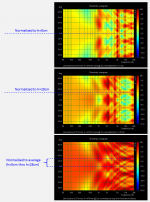
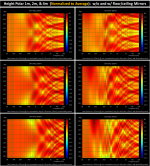
Here are a few plots showing the influence of the first reflection floor and ceiling mirror sources. As before, the sonograms show response relative to height above and below the center of the planar array at a fixed distance. Negative height numbers are closer to floor, positive closer to the ceiling. In hind sight, I should have swapped this sign convention so the plots would be more intuitive(ie floor at the bottom of the plot). I guess it really only makes a difference if the array or floor/ceiling spaces are not symmetric.
Attachment #2: comparison of height polars at distances of 1m, 2m, and 4m with and without floor/ceiling mirrors. Left side plots are without mirror sources, right side plots are with. All plots were normalized by the average response between the center of the two middle planars.(ie one spatial cycle)
- the spatial variations in the midrange and upward are not influenced much be the floor/ceiling
- below 500Hz the differing distances between array and floor/ceiling cause an imbalance in the response with more support closer to the floor as expected. The disparity becomes more prominent as you move further from the source. The rule of thumb for listening window being the middle 1/3 of the line source still seems to hold up.
Attachment #3 - #5: overlays of the average responses used to normalize the sonograms. Above 1kHz the curves are essentially the same for all distances, with or without floor/ceiling mirrors.(nM= no mirrors, wM=with mirrors) This was what I was wanting to show, that you could use an average curve calculated from a fixed distance with varying heights for determining an appropriate EQ for higher frequencies. At lower frequencies, since your line source is not fully floor to ceiling, you will have variations with distance. Of course as you get below Schroeder frequency room modes will also start to influence/dominate the response.
Attachments
Here are a few plots showing the influence of the first reflection floor and ceiling mirror sources. As before, the sonograms show response relative to height above and below the center of the planar array at a fixed distance. Negative height numbers are closer to floor, positive closer to the ceiling. In hind sight, I should have swapped this sign convention so the plots would be more intuitive(ie floor at the bottom of the plot). I guess it really only makes a difference if the array or floor/ceiling spaces are not symmetric.
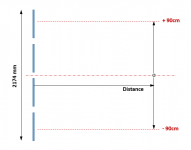
Interesting. Gives ball park figures. So for typical ear height at a listening position of 37 to 39 inches (94 to 99 cm) what do you think? All the calculations can also be summed up with a fairly simple floor to ear and ceiling to ear calculation in respect to listening distance.
Thanks! Helpful as always, Bolserst (both you and the post🙂).
In hindsight I guess the limited effect of reflections at high frequencies makes sense given how strongly directive a 2.5 m line is at those frequencies. There's not much high frequency energy directed toward the floor or ceiling so there's little reflection that might contribute to the final response. Is that description/rationalization consistent with what you've seen? The polar responses you've posted haven't included angles dramatically off the main horizontal axis so I want to be sure I'm not making unsupported claims.
After some fiddling with my set-up I think I have REW making proper use of the loop back timing reference. The impulse now appears at a time that corresponds to the expected propagation time from mic to speaker. My situation is a little unconventional so I had to get a little creative.
Few
The lack of any visible(i.e. in the plots - other wise I should have said audible 😛) effect at high frequencies is caused by a different effect. If you imagine the line source to be a line of point sources all operating with the same phase, then the waves from sources close to the listening height are all the same distance from the listener so all have the same phase more or less, so reinforce each other. As you start summing the effects of waves further from the centre of the line, the distance to the respective sources changes more quickly, and the phases of the waves are so mixed up, they effectively sum to nothing.
If you follow the logic you can see that at high frequencies (where the phase changes very quickly), it is only a small part of the line that is closest to the listener that contributes to what you hear. As the frequencies lower, the effective length of the line increases.
It is this apparent change of length of the line source that gives the line source the peculiar sqrt(f) term in the frequency response that the segmented design compensates nicely.
regards
R
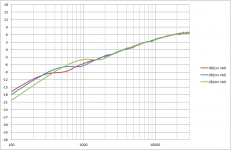
Here's a first attempt to follow Bolserst's advice on averaging measurements, with a comparison to the moving mic results (two versions).
In all cases:
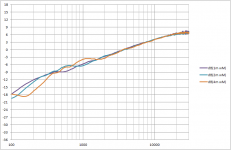
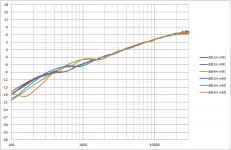
First I made five measurements over the range described above, this time using a loop back time reference and making sure the impulses lined up (one was off by one time point). I averaged the five using the cumbersome A+B approach in Room Eq Wizard so the phase response is retained. All these measurements had a 5-cycle window applied; no other smoothing.
I'm attaching the resulting individual step responses and the resulting average. The responses are displaced vertically so they're easier to see. The bottom (green) response is the average of the others.
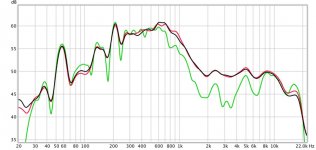
I also made two moving mic measurements over the same range of mic heights. 1/6 octave smoothing was applied in both cases. In one case I moved the mic only vertically (red plot), and in the other I also moved it horizontally (black plot). I superimposed the two moving mic magnitude measurements on the averaged measurement (green plot) for comparison.
The drop off above 1 KHz is largely because I have the 1 KHz Bessel low pass on the midrange but no compensating equalization. This result is useful to me as I embark on the equalization step but I probably should have removed the Bessel low pass for the purpose of posting measurements. Sorry about that.
I see more agreement over much of the frequency range than I expected, and I'm surprised to see the significant level reduction between 800 and 8000 Hz when the averaged measurement is compared to the two moving mic measurements (which agree with each other to a remarkable extent).
So which curve serves as the better reference point for equalization? That broad 3-5 dB difference between 800 and 8000 Hz is certainly not going to sound subtle. And does it make sense to equalize away the peaks that appear over that range? The averaged results would certainly call for more dramatic adjustment than would the moving mic results.
Few
In all cases:
1) mic-speaker distance = 2 meters
2) mic height ranges from middle of tower (between second and third panel) to middle of the third panel counting from the floor
3) midrange and tweeter have a Bessel high pass at 30 Hz to gradually roll off the deepest bass
4) midrange had 1 KHz Bessel low pass
5) no equalization
6) grills on
2) mic height ranges from middle of tower (between second and third panel) to middle of the third panel counting from the floor
3) midrange and tweeter have a Bessel high pass at 30 Hz to gradually roll off the deepest bass
4) midrange had 1 KHz Bessel low pass
5) no equalization
6) grills on
First I made five measurements over the range described above, this time using a loop back time reference and making sure the impulses lined up (one was off by one time point). I averaged the five using the cumbersome A+B approach in Room Eq Wizard so the phase response is retained. All these measurements had a 5-cycle window applied; no other smoothing.
I'm attaching the resulting individual step responses and the resulting average. The responses are displaced vertically so they're easier to see. The bottom (green) response is the average of the others.
I also made two moving mic measurements over the same range of mic heights. 1/6 octave smoothing was applied in both cases. In one case I moved the mic only vertically (red plot), and in the other I also moved it horizontally (black plot). I superimposed the two moving mic magnitude measurements on the averaged measurement (green plot) for comparison.
The drop off above 1 KHz is largely because I have the 1 KHz Bessel low pass on the midrange but no compensating equalization. This result is useful to me as I embark on the equalization step but I probably should have removed the Bessel low pass for the purpose of posting measurements. Sorry about that.
I see more agreement over much of the frequency range than I expected, and I'm surprised to see the significant level reduction between 800 and 8000 Hz when the averaged measurement is compared to the two moving mic measurements (which agree with each other to a remarkable extent).
So which curve serves as the better reference point for equalization? That broad 3-5 dB difference between 800 and 8000 Hz is certainly not going to sound subtle. And does it make sense to equalize away the peaks that appear over that range? The averaged results would certainly call for more dramatic adjustment than would the moving mic results.
Few
Attachments
Golfnut: Aren't we saying the same thing in different ways? I would argue the cancellation effect you described so nicely is the underlying cause of the polar response I referred to---the lack of high frequency energy directed toward the floor and ceiling. Or am I misunderstanding your argument?
Few
Few
The averaged result is a 5 cycle window, showing what happens in the early wave front. You probably can undo that 5 cycle window to look at a longer time frame.
This average measurement makes for a clearer look at the speaker and shows less of the room effects. The sum of those 5 measurements already shows how much of the reflections etc are averaged out.
The moving mic will always include more of the room into the measurement due to it's time frame. Was the moving mic moving along the same line these 5 measurements were taken at? If not, all bets are off. The average should be build by measurements utilising the same space as the waved (moving) mic.
What would be interesting is to EQ the average measurements, though I would limit the measurements to a square around the sweet spot, also taking measurements to the left and right(*) and do a moving mic sweep after applying that EQ.
Some nice averaging techniques and it's effects can be seen here:
http://www.diyaudio.com/forums/multi-way/291160-my-synergy-corner-horn-bass-bins-27.html#post4971154
In this example APL TDA EQ was used which averages a lot of measurements. That program does it automatically and generates a (FIR) correction. Now I'm not saying you need that program, just look at this as an example. You can do a good job (more work) with REW by following the queues.
(*) Why move to left and right as well as up and down? The arrays are pretty good at averaging out all kind of room effects by themselves. However bigger vertical planes can have a larger effect as they are about equal distance to the mic even at other heights. By moving to the left and to the right you average those (room) effects too.
I bet the moving mic measurement wasn't only moving up or down?
Last edited:
Thanks Wesayso. To answer your question, I made two types of moving mic measurements. One set mimicked the mic positions used in the windowed measurements (vertical motion only) and the other set included horizontal motions as well as vertical motions. The horizontal motions were confined within about 30 cm I would guess. As you can see, the difference between the measurements is quite small. I included both because I was curious to see how much difference there would be and I know others have been following the moving mic thread and might be interested to know what I found.
I understand that the non-windowed moving mic measurements will always include the room's contribution, and the windowed response (if the window is short enough) will eliminate them. What's not clear to me is which response will serve as a better starting point for equalization since I will not be limited to anything close to the sweet spot while listening. I obviously want the sweet spot to be as sweet as possible within the broader constraints, but if I equalize peaks that appear uniquely in that location I will be creating dips when I listen from any other location. I realize I'm not telling you anything you don't already know. I just want to emphasize that my room and listening habits may be quite unusual and I want to customize the system to accommodate my particular situation.
I would enjoy the exercise of aiming to perfect the measurements in one mic location, just to see how well I can do, but I have already demonstrated to myself that such an approach yields poor results for my real-world music listening. Bolserst made a measurement suggestion based on the modeling results he has posted here so I wanted to report back on what I found, given all the effort he went to.
Thank for the link---I'll definitely take a look. I'm always up for learning a new trick!
Few
Some kind of averaging will probably yield you the best results. Personally, in your shoes, I'd try both. The moving mic as a base for EQ as well as multiple measurements summed together taken in a limited space.
Compare the two which one does best. As well as checking the results of the averaged summed result with a moving mic. I suppose the other way around would also still be possible.
To be successful with a single measurement you'd have to get all (early) reflections down by a certain amount to get a pleasing result over a wider area. That would probably include working with damping panels, diffusion etc. That's closest to what I did. Though I do have plans to "look" at averaged sum results in the near future. I have established that the average of multiple measurements (not using the summed average) of the stereo pair translated very well to the curve I used (aimed for) at that one measurement spot. But that was after hanging at least 2 big damping panels out in the room.
Is it time to think-through what claim is being examined by tests?
Are you trying to establish how true the theory is and/or how close your speakers are to the theory?
Or are you trying to see what results you get at your listening position(s)? And/or how that may be influenced by EQ?
Or are you trying to see what is the freq response of your speaker(s)?
"Ready, fire, aim" isn't a good style.
Ben
Thanks for the style critique, Ben.🙄 As I have explained in previous posts, I am pursuing several goals, not all of them simultaneously.
Wesayso, I learned two big lessons from Bolserst's modeling. The first is that even in the absence of room contributions, relatively small mic motions can cause relatively large response variations (at least with my system). Second, I now have a clearer idea of what the limits are for a finite length line with a few discontinuities. That knowledge is very useful because it will help me avoid chasing rainbows.
I agree with you that averaging will be necessary. Then the question is what should be averaged? Bolserst's models suggested windowed measurements of the type I made today might yield good results. I wanted to follow his advice and find out how my measurements would compare with the predictions.
I threw in the moving mic measurements out of curiosity. They can be made very quickly and I've found they they yield pretty decent sounding results when they're used as the basis for equalization. They also give me a familiar point of reference.
Still looking forward to pursuing the link you provided---I've been covering myself with glue and sawdust in the shop.
Few
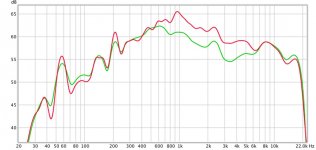
Before breaking out of measurement mode I figured I'd repeat the previous batch but without any low pass on the midrange.
Attachment 1: Same system of 5 windowed measurements averaged (5 cycle window, plotted in green) superimposed on a moving mic measurement (just vertical motion, plotted in red).
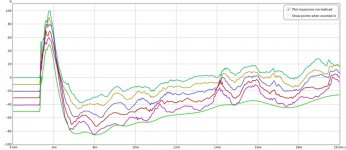
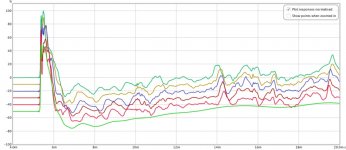
Attachment 2: Step responses of all 5 measurements used in the average, as well as the resulting average (at the bottom, in green). Again displaced vertically for clarity.
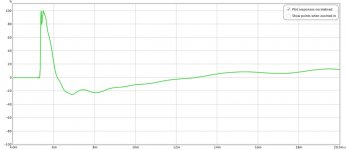
Attachment 3: Step response just of the averaged responses.
I can certainly say the averaged responses give a much cleaner step response. The delayed arrivals from points above and below the mic are clearly visible and a lot of the distracting wiggles in the tail of the step are smoothed. This seems like a nice way to see how equalizing the magnitude response affects the step response. Too bad I'm running out of time for today...
By the way, in case it wasn't clear, all measurements posted today are for just one planar magnetic tower; no woofer array contribution.
Few
Attachment 1: Same system of 5 windowed measurements averaged (5 cycle window, plotted in green) superimposed on a moving mic measurement (just vertical motion, plotted in red).
Attachment 2: Step responses of all 5 measurements used in the average, as well as the resulting average (at the bottom, in green). Again displaced vertically for clarity.
Attachment 3: Step response just of the averaged responses.
I can certainly say the averaged responses give a much cleaner step response. The delayed arrivals from points above and below the mic are clearly visible and a lot of the distracting wiggles in the tail of the step are smoothed. This seems like a nice way to see how equalizing the magnitude response affects the step response. Too bad I'm running out of time for today...
By the way, in case it wasn't clear, all measurements posted today are for just one planar magnetic tower; no woofer array contribution.
Few
Attachments
I hope to have set off your thinking cap, I do consider it important to also vary in the horizontal plane. Especially after seeing the STEP responses. Just some friendly advice 😉.
Averaging these measurements (by arithmetic or by swing your mic around) is one way to learn barely anything and to position you to learn little more. Any single measurement seems to tell you most of what you want to know and provides a repeatable foundation for the next step.
I think the root issue is that people believe there exists a "true" curve and they are just trying to uncover it. I'm not making a philosophical statement or regurgitating Heisenberg, just holding a realistic view of acoustic evaluation, statistical bad thinking, and good lab practice.
Instead, trying thinking you need a stable measurement whose sound you know.
Ben
Last edited:
Wesayso
Thanks. Friendly advice is always welcome, and my thinking cap is permanently on. Unfortunately my thinking tires do not always make good contact with the road.
In the most recent data post I included moving mic results from vertical motion only. I did that to mimic the windowed measurements, not because I think there's nothing to be learned horizontally. I received some friendly advice recently and posted accordingly🙂:
When I use the Bessel low pass on the midrange the directivity of the panels is quite independent of frequency, as I showed in previous posts. I didn't include horizontal motion in the most recent set of data because the midranges were run all the way up to 20 KHz (no low pass) so horizontal mic motion would give a false impression of a response droop at high frequencies.
Few
Thanks. Friendly advice is always welcome, and my thinking cap is permanently on. Unfortunately my thinking tires do not always make good contact with the road.
In the most recent data post I included moving mic results from vertical motion only. I did that to mimic the windowed measurements, not because I think there's nothing to be learned horizontally. I received some friendly advice recently and posted accordingly🙂:
"Was the moving mic moving along the same line these 5 measurements were taken at? If not, all bets are off. The average should be build by measurements utilising the same space as the waved (moving) mic."
When I use the Bessel low pass on the midrange the directivity of the panels is quite independent of frequency, as I showed in previous posts. I didn't include horizontal motion in the most recent set of data because the midranges were run all the way up to 20 KHz (no low pass) so horizontal mic motion would give a false impression of a response droop at high frequencies.
Few
Last edited:
- Home
- Loudspeakers
- Planars & Exotics
- DIY planar magnetic + open baffle woofer array