In HOLM, you can import a reference file and a file to compare it to. HOLM will then plot the frequency response difference. You can use sweeps, noise, music, whatever. If you want to see the frequency response of a file against a linear plot, you just use a log sweep as the reference.
Michael
regarding the file comparison you perform through Holm.
What about if Holm does a simple-plain subtraction of the two files (sample-reference)?
If it does this, then reference and sample files have to be highly correlated for the output to be meaningful and not misleading, something like subtracting amplifier input signal from amplifier output signal.
George
George the files I got from your link were:
psr_noise_IRIAA_48R.wav
30multitone IRIAA reduced volume R.wav
The strange thing is, I got two different plots in HOLMIpulse, depending on what reference sweep I used.
I don't see how you could produce a useful "reference" wave in either of the above cases. The original source files were mathematically generated they are not sweeps, the multitone signal is 30 specific frequencies and random phases it is not possible to sync anything to it without the original information. And as a reminder the files are set to give valid results at 65536 FFT points only preferably un-windowed but as you see from my last plot they still make sense windowed but are unnecessarily widened and hide some of the detail between bins.
Unless you have a mode in HOLMImpulse to just do FFT's of raw wav data specifying bins and windows it is not a useful tool for this.
That may be the case, yes. The author of the software intended the function to be a comparison of the FR between 2 files. If the files are log sweeps, it can also show you distortion. I did find in that test that using a log sweep or using a linear sweep showed rather different results. I've attached a log sweep from HOLM. If you get a chance, please run it thru our DSP and I'll compare it to the original. The recorded file should show the RIAA curve. The sweep is at -23dB so you should not have any clipping problems.
Attachments
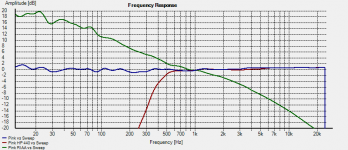
Just as a sanity check I compared pink noise to a log sweep in HOLMImpulse.
You'll see Pink noise, pink high passed @ 440Hz and pink passed thru a software RIAA filter (Audacity).
They look about how I'd expect, so I don't know what's gone wrong plotting your noise file. Since the pink noise plots flat compared to the log sweep, maybe your noise does not because it's not pink. What do you think?
Attachments
Michael it is a big puzzle yes?
I had made a guess about Holm looking at the integral of the reference curve.
Most probably I was wrong but not totally wrong.
Maybe the plots that Holms is producing is not FFT plots (like me, Scott, Demian have shown) but RTA plots.
FFT: bins are of constant width in frequency
RTA: bins are of constant width in octave (or fractions of octave)
White noise: equal energy per Hz bandwidth
Pink noise: equal energy per octave bandwidth
So:
Log sweeps and pink noise show flat on RTA but dropping at 3dB/octave on FFT
Linear sweeps and white noise show rising at 3dB/oct on RTA but flat on FFT
See these two links for more juicy explanation
http://www.diyaudio.com/forums/equipment-tools/116665-why-do-sweep-signals-have-progressively-decreasing-amplitude.html#post1424039
Ruido rosa, blanco y rojo < Referencias de Audio Profesional / Pink, white, red noise < Pro Audio Reference
George
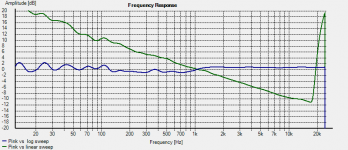
Yes, George, that seems to be it. Below you will see the same pink noise plotted against a log sweep and against a linear sweep. The linear sweep looks like an FFT plor while the log looks like an RTA. Good catch.
Sorry for the diversion, I just wanted to look at your results in software that I know and use. A few years back I had a good FFT program that ran on WinXP, but it's long gone.
If you get a chance to run the log sweep thru your digital RIAA setup, I'd love to see it. I can compare it to the original to see if the ripples show up here, too.
Attachments
Michael it is a big puzzle yes?
I had made a guess about Holm looking at the integral of the reference curve.
Most probably I was wrong but not totally wrong.
Maybe the plots that Holms is producing is not FFT plots (like me, Scott, Demian have shown) but RTA plots.
George
B&K uses RTA and I always end up having to translate to what I like, constant V/rt-Hz.
Most major players I have encountered use Listen (https://www.listeninc.com/products/soundcheck-software/) with B&K stuff. All very spendy but very flexible and powerful. They all seem to get Klipple and Loudsoft as ell. I do have serious questions about whether the Asian guys have any understanding of the measurement results.
You should be able to use ARTA to look at the FFT.
You should be able to use ARTA to look at the FFT.
If you get a chance to run the log sweep thru your digital RIAA setup, I'd love to see it. I can compare it to the original to see if the ripples show up here, too.
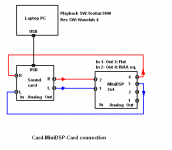
The file from the 2x4 MiniDSP output.
https://www.dropbox.com/s/iz3dbfj0hsl5af9/Replay%20MiniDSP%20HOLM%20Sweep%20minus%2023%20LOG%20sweep.wav?dl=0
The L channel is the flat output, the R channel is the RIAA output
Don’t use the original as reference. Use the L channel as the reference to see only the effects of the RIAA equalisation.
Michael, a question: Does HolmImpulse opens wav files?
A few years back I had a good FFT program that ran on WinXP, but it's long gone.
The free Rmaa works OK for me
RightMark Audio Analyzer. Products. Audio Rightmark
George
Attachments
Thanks for running that George. 
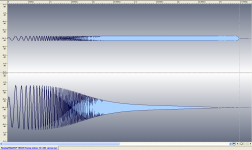
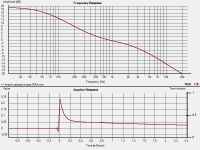
Here is what Holm plotted. I have also attached a txt file (zipped) of the response at 1024 points. You can look at those values to see exactly where the FR is at at given frequency. Sorry about all the values to the right of the decimal, that's how HOLMImpulse exports it.
Here is what Holm plotted. I have also attached a txt file (zipped) of the response at 1024 points. You can look at those values to see exactly where the FR is at at given frequency. Sorry about all the values to the right of the decimal, that's how HOLMImpulse exports it.
Attachments

Good Michael 😎
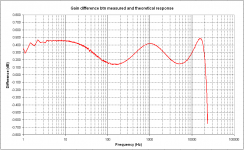
Here is the analysis of your text file.
Not bad at all
George
That looks good for the single biquad at 48k. The fitting algorithm stops at 20k therefore the abrupt drop due to the warped frequency space near fs/2.
BTW this device looks good for fixing clock sync problems, reviews say AD/DA are good too. https://www.bhphotovideo.com/c/product/264903-REG/Behringer_SRC2496_ULTRAMATCH_PRO_Sample.html
George - have you figured out why the recorded miniDSP output is so off?
Last edited:
Thanks for doing that plot, George. I keep seeing a small depression at 1 KHz in the plots and wonder if it's not a HOLMIpulse artifact. Don't know what would cause it, but it keeps showing up in most signals. I see it being about 0.6 dB but your plots show less
George - have you figured out why the recorded miniDSP output is so off?
I can only attribute it to the influence of a temporary strange cosmic perturbation (bad aspects in my transit Horoscope) 😀.
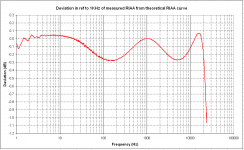
I tested again my 2x4 MiniDSP using the soundcard and REW V5.14 SW with Log sweep as test signal.
One channel (L) of the miniDSP flat and 0dB gain.
The other (R) with your RIAA 48k coefficients for a gain of 13.16dB@1KHz and by setting the input attenuator to –13dB in the plug-in, I brought the gain to 0dB.
I exported the measurements as text (.txt) which I imported in Excel.
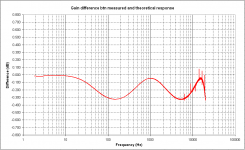
Then I subtracted the data of the two outputs for to get the net effect of the DSP RIAA filter.
The results are very satisfactory. The ripple is 0.28dB p-p. (In your article you mention a theoretical ripple of +/- 0.13dB).
There are some glitches present, they are visible thanks to the high resolution of the measurement (54608 measurement points in each of the two measurements).
Bottom line: Your LA article is a great one. The coefficients work very well and the 2x4 MiniDSP does a decent job.
I drink to these

BTW this device looks good for
Too big 😀 and same price with the MiniDSP 2x4 HD 🙂
George
Attachments


I pulled the manual for my 2x8 and was pleased to note that its actually a 4x10 once you put the add on cards in. No idea what I need 10 channels for but I'll work it out 🙂 This does mean I can have a vinyl preset and use the analog in for other things as well as needed.
Now I have to repurchase the plugin as lost the software (all bought S/H). Should I get the 48KHz or 96KHz? Seems consensus is that it doesn't matter if not declicking? Don't think I need the extra PEQs or the limiter?
Now I have to repurchase the plugin as lost the software (all bought S/H). Should I get the 48KHz or 96KHz? Seems consensus is that it doesn't matter if not declicking? Don't think I need the extra PEQs or the limiter?
I drink to these
George
I'll pass on the Ouzo 😉, but everything is working as planned that is good.
BTW to pick a nit the .26dB vs .28dB is accounted for by taking 20Hz to 20kHz exclusively the maths are perfect they can't help it.
Last edited:
An interesting topic, digitizing vinyl.
However, I tried to follow the thread but am somehow lost. I thougt it to be a discussion about recording vinyl, process it and store it in a digital form.
But the discussion seems to rotate around a device who must provide possibilities to digitize the analog signal and process so that it can be listened on the fly?
Now I have to repurchase the plugin as lost the software (all bought S/H). Should I get the 48KHz or 96KHz? Seems consensus is that it doesn't matter if not declicking? Don't think I need the extra PEQs or the limiter?
Bill, go for the 96KHz.
We need you to serve as the test bench for the 96KHz biquad coefficients 😉 (I’ll provide the spreadsheet).
If the results are good, I will be tempted to purchase a 2x4MiniDSP HD in 2017
I'll pass on the Ouzo 😉, but everything is working as planned that is good.
The credit goes to you. Enjoy the ouzo
BTW to pick a nit the .26dB vs .28dB is accounted for by taking 20Hz to 20kHz exclusively the maths are perfect they can't help it
They are!
And I can’t help it being imperfect. 😀 (I think it would be boring if these two letters were missing).
George
An interesting topic, digitizing vinyl.
However, I tried to follow the thread but am somehow lost. I thougt it to be a discussion about recording vinyl, process it and store it in a digital form.
But the discussion seems to rotate around a device who must provide possibilities to digitize the analog signal and process so that it can be listened on the fly?
Go back to post #143. You’ll find what you are looking for (thanks to Mitch )
http://www.diyaudio.com/forums/analogue-source/298896-digitizing-vinyl-15.html#post4881101
🙂
George
What will they think of next...
https://www.kickstarter.com/projects/pinkdonut/rokblok-a-new-spin-on-vinyl
Jan
https://www.kickstarter.com/projects/pinkdonut/rokblok-a-new-spin-on-vinyl
Jan
- Status
- Not open for further replies.
- Home
- Source & Line
- Analogue Source
- Digitizing vinyl