Jmmlc said:Hello Svante,
You loose your $1.
🙂
Yes possibly I do, but that would be because I failed to tell you that my comment was regarding 1st order filters. I am aware that people have shown that the ear is sensitive to phase shifts. However, one must be very clear about what kind of phase shifts that are introduced.
So if I am to clarify what I meant: Can you manage to detect a first order 2 kHz allpass filter in a correctly performed double-blind test?
Have you actually done this test yourself? I have done it myself and on my students the last 15 years or so. The students typically doubt that there is anything connected in the box at all. On rare occasions they point out 7 of 7, but then again they should just by chance. On these occasions I ask them do do the test again, and it almost always fails. There has been rare occasions when the 90 deg frequency is low (120 Hz) that I think they have actually been able to detect the filter, but nobody thinks the difference is large. One really has to find the right signal, plain music does not do.
Now failure to detect is not a proof of absence of the effect I am aware of that. One could always state that I use poor equipment or bad music or similar.
Of course phase plays a role in other types of signal processing. For example, take any signal and turn it backwards. The only thing that is changed is the phase. This is clearly audible. So, somewhere there is a limit to how much phase shift that has to be introduced for audibility, and I'd say that most crossover filter's phase shift falls below that threshold. At least for mid frequencies.
gedlee said:
Many reseachers, including myself (see Moore, Geddes and Lee, etc. in JAES) have shown - in double blind tests - that group delay can be audible. It is not always audible, it depends on the frequency, delay time, AND the playback level. Group delayed signals, such as diffraction can be very audible.
Now, I challenge you to find these effects in the frequency domain
You challenge me to find the effects of diffraction in the frequency domain? Ok, the answer is just one click away in my signature, if you run the Edge to simulate the baffle step, there are effects from diffraction that are clearly visible in the frequency response.
When speaking about the audibility of phase, one must make very certain that ONLY phase is affected and not the frequency response. Of course a delayed reflection is audible, but that is mainly due to the effects on the FR.
gedlee said:
Hence, lets not throw out the impulse response all together. At least not until you can show me these effects in the frequency domain.
Actually I am not throwing it out. Right now I am working on a software to measure both the IR and the FR. I think one should look at both. But in doing this, I think one should keep the proportions right between the importance of the two. Looking at the IR only, and forgetting about the FR is very common I think. It seems that it is sort of fashionable to look at the IR, the FR is old and boring. That is what I am opposing to, really.
Svante said:
You challenge me to find the effects of diffraction in the frequency domain? Ok, the answer is just one click away in my signature, if you run the Edge to simulate the baffle step, there are effects from diffraction that are clearly visible in the frequency response.
When speaking about the audibility of phase, one must make very certain that ONLY phase is affected and not the frequency response. Of course a delayed reflection is audible, but that is mainly due to the effects on the FR.
Actually I am not throwing it out. Right now I am working on a software to measure both the IR and the FR. I think one should look at both. But in doing this, I think one should keep the proportions right between the importance of the two. Looking at the IR only, and forgetting about the FR is very common I think. It seems that it is sort of fashionable to look at the IR, the FR is old and boring. That is what I am opposing to, really.
First, I said that it was POSSIBLE to see everything in the FR, its just not as obvious. And there are aberations in the frequency response that can be the same but have different non-minmal phase aspects that will NOT have the same audibility. You cannot look at magnitude only and tell this, you need the phase, but the phase is almost impossible to sort out. Hence SOME effects are more obviuos in the time domain.
Measuring both the FR and IR is trivial, they are simply transform pairs. Why do you need to work on software to do this?
And I am NOT saying that one can hear phase, they can't, but group delay is not simply phase, and it IS audible. Both Moore and I found this.
Last, you did imply that looking at the impulse response was pointless. Your position above is more reasonable.
gedlee said:
Measuring both the FR and IR is trivial, they are simply transform pairs. Why do you need to work on software to do this?
Hmm, trivial in what sense? From the user's point of view or from the programmer's? Of course anyone can download software that does a Fourier transform, that is trivial, I agree with that. Then there are all those little things that the softwares don't do the way you want it. And I want to learn. Then there is nothing better than DIY 🙂 .
Svante said:Then there are all those little things that the softwares don't do the way you want it.
Thats exactly why I use MathCAD. I can do anything that I can think of.
It makes no sense to get down to the programming level of an FFT, thats just a subroutine that is some 50 years old. If you want to learn stay at the higher level of manipulating an array of time samples. Thats the most fundamental level of the signal. I don't always use an FFT - there are lots of other things that you can do once you have the raw data as an array of points - a data vector, if you will.
Ladies and Gentlemen, may I have you attention please
I've made a lot of measurements in the last two days and I have stumbled onto something which completely blows my mind. Based on these observations I state the following:
I claim that I have invented a method for measuring the impedance of a power amplifier as it is seen by the driver.
The method:
A driver or driver/enclosure combination is excited by an acoustic signal while the driver is loaded with the amplifier under test. Voltage and current are measured simultaneously and by means of dual-FFT analysis a plot of impedance versus frequency can be obtained.
The impedance plot can be used to calculate the electrical damping of the driver as it varies with frequency.
Furthermore, by loading the driver with different resistive loads fundamental properties of the driver can be measured.
Scientific basis:
The formula for calculating Qes.
Intellectual property:
I deposit this method in the public domain under the name G-method. All commercial and non-commercial use is allowed as long the original work is referenced.
Because of the nature of my finding it is absolutely imperative that other people follow the same procedure so that the results can confirmed or discredited.
Think I'm exaggerating? Let me tell you that nobody, and I mean nobody, will be prepared for what is about to follow.
Let' start with the basics, the method itself. I will demonstrate that this method is accurate and that the result are reproducible.
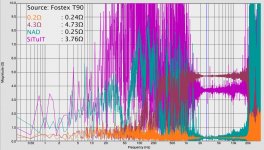
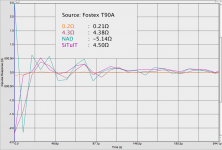
Attached you see the impedance plots for four different loads as a Fostex T90A horntweeter sees them. I selected resistors with values close to the impedance of the amps under test.
I state that these results are accurate and completely in accordance with the existing theoretical framework.
Primary observation: An Amplifier is not a resistor.
Gut feeling: The irregularities in the operating band of the T90 are caused by driver resonances.
In the next post we will hear what a Seas dome tweeter has to say.
I've made a lot of measurements in the last two days and I have stumbled onto something which completely blows my mind. Based on these observations I state the following:
I claim that I have invented a method for measuring the impedance of a power amplifier as it is seen by the driver.
The method:
A driver or driver/enclosure combination is excited by an acoustic signal while the driver is loaded with the amplifier under test. Voltage and current are measured simultaneously and by means of dual-FFT analysis a plot of impedance versus frequency can be obtained.
The impedance plot can be used to calculate the electrical damping of the driver as it varies with frequency.
Furthermore, by loading the driver with different resistive loads fundamental properties of the driver can be measured.
Scientific basis:
The formula for calculating Qes.
Intellectual property:
I deposit this method in the public domain under the name G-method. All commercial and non-commercial use is allowed as long the original work is referenced.
Because of the nature of my finding it is absolutely imperative that other people follow the same procedure so that the results can confirmed or discredited.
Think I'm exaggerating? Let me tell you that nobody, and I mean nobody, will be prepared for what is about to follow.
Let' start with the basics, the method itself. I will demonstrate that this method is accurate and that the result are reproducible.
Attached you see the impedance plots for four different loads as a Fostex T90A horntweeter sees them. I selected resistors with values close to the impedance of the amps under test.
I state that these results are accurate and completely in accordance with the existing theoretical framework.
Primary observation: An Amplifier is not a resistor.
Gut feeling: The irregularities in the operating band of the T90 are caused by driver resonances.
In the next post we will hear what a Seas dome tweeter has to say.
Attachments
Oops, let me rephrase that:
Primary observation:
The impedance plot for the amps is very different from that of their resistive counterparts.
Interpretation:
An amplifier is NOT a resistor.
Attached are the results for a Seas Dome tweeter. I don't know the type, it just says Seas on the back. The fact that the obtained values are again in close proximity of what we expect them to be is a testament to the sensitivity of the proposed method.
Let me offer a blunt interpretation:
The NAD sucks in the high frequencies, The Set sucks, period.
Attachments
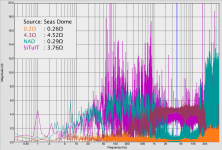
Exhibit #4
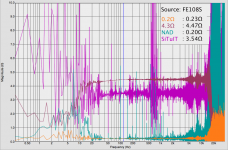
This time we listen to what a Fostex FE108S in folded Voigt pipe has to say. For this measurement the loudspeaker was placed at 1m distance from the noise source. Measurements on the tweeters were made while placed on top of this speaker. The hight was about 1m.
I think it is safe to say that there is a pattern here.
Before we turn our attention to the impulse response again I will have to perform some more measurements that will help to establish the validity of the method itself.
Attachments
Rube Goldberg method for measuring resistance
First:
I discovered the reason for the negative values in the impulse response. It is because I designed my little impedance box from the amplifier perspective. If the driver is used as the source the current runs in the other direction, so the phase of the current is opposed to that of the voltage in my measurement.
Second:
The method itself has an interesting property: Calibration of the mic pre-amps is not required. Two things determine the accuracy of the G-method:
1. The value of the current sense resistor must be known precisely.
2. The gain of the two channels measuring voltage and current must be matched, or the difference in gain must be known precisely.
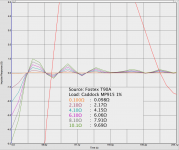
As proof of the validity and, if I may say so, astonishing accuracy of the G-method I offer the data presented in the attachment.
The graph shows the impedance impulse response for six different, purely resistive, loads. I used Caddock MP915 non-inductive 1% resistors as a load. The current sense resistor consists of 5 parallel Caddock 0.50Ω 1% resistors.
I multiplied the value at t=0 by two to calculate the resistance. The obtained results are within 5% of the expected values, if the 10Ω resistor is excluded the values are within 3%.
First:
I discovered the reason for the negative values in the impulse response. It is because I designed my little impedance box from the amplifier perspective. If the driver is used as the source the current runs in the other direction, so the phase of the current is opposed to that of the voltage in my measurement.
Second:
The method itself has an interesting property: Calibration of the mic pre-amps is not required. Two things determine the accuracy of the G-method:
1. The value of the current sense resistor must be known precisely.
2. The gain of the two channels measuring voltage and current must be matched, or the difference in gain must be known precisely.
As proof of the validity and, if I may say so, astonishing accuracy of the G-method I offer the data presented in the attachment.
The graph shows the impedance impulse response for six different, purely resistive, loads. I used Caddock MP915 non-inductive 1% resistors as a load. The current sense resistor consists of 5 parallel Caddock 0.50Ω 1% resistors.
I multiplied the value at t=0 by two to calculate the resistance. The obtained results are within 5% of the expected values, if the 10Ω resistor is excluded the values are within 3%.
Attachments
Re: Ladies and Gentlemen, may I have you attention please
maybe I'm missing something essential and for sure I don't want to lessen your efforts on these matters, but to me it seems you just replicated the (more or less) standard method of determining the dynamic output impedance of an amp. This method is basically as following:
- attach a controlled current source at the output
- inject a known current into DUT
- measure voltage across DUT
- get impedance from voltage and current vectors
One common way to implement that in detail is to apply an underlying DC/LF bias current to the output, while the input is fed with a signal to get some DC/LF voltage bias at the output. This allows for a steady state 4-quadrant bias (which can be thought of resembling sections of a speakers dynamic behaviour with a LF pulse). On top of this a small signal AC current is injected, and AC voltage is measured, getting an small signal impedance (vector) under a certain large signal bias condition. The accumulated data can be thought of a vector field, 2D vectors (impedance, magnitude and phase) in 3D space (vs. current, voltage and frequency). This can further made parametric wrt large signal transitions, reflecting dynamic, thermal and PSU related issues within the amp and their consequences on output impedance. Which, whenever it changes for whatever reasons, is de facto... distortion.
I've used this method in ATE (automatic test equipment) to fully characterize output impedance changes vs operating conditions of industrial (non-audio) power amps, besides it's an excellent stress test for the amplifier.
- Klaus
Hi Gerrit,Gerrit Boers said:I claim that I have invented a method for measuring the impedance of a power amplifier as it is seen by the driver.
maybe I'm missing something essential and for sure I don't want to lessen your efforts on these matters, but to me it seems you just replicated the (more or less) standard method of determining the dynamic output impedance of an amp. This method is basically as following:
- attach a controlled current source at the output
- inject a known current into DUT
- measure voltage across DUT
- get impedance from voltage and current vectors
One common way to implement that in detail is to apply an underlying DC/LF bias current to the output, while the input is fed with a signal to get some DC/LF voltage bias at the output. This allows for a steady state 4-quadrant bias (which can be thought of resembling sections of a speakers dynamic behaviour with a LF pulse). On top of this a small signal AC current is injected, and AC voltage is measured, getting an small signal impedance (vector) under a certain large signal bias condition. The accumulated data can be thought of a vector field, 2D vectors (impedance, magnitude and phase) in 3D space (vs. current, voltage and frequency). This can further made parametric wrt large signal transitions, reflecting dynamic, thermal and PSU related issues within the amp and their consequences on output impedance. Which, whenever it changes for whatever reasons, is de facto... distortion.
I've used this method in ATE (automatic test equipment) to fully characterize output impedance changes vs operating conditions of industrial (non-audio) power amps, besides it's an excellent stress test for the amplifier.
- Klaus
gedlee said:
Thats exactly why I use MathCAD. I can do anything that I can think of.
It makes no sense to get down to the programming level of an FFT, thats just a subroutine that is some 50 years old. If you want to learn stay at the higher level of manipulating an array of time samples. Thats the most fundamental level of the signal. I don't always use an FFT - there are lots of other things that you can do once you have the raw data as an array of points - a data vector, if you will.
Well. As long as I think that I learn something from it, it does make sense. Right? We all develop strategies in our usage of computer tools, and mine has become to write things on a sometimes too low level. It has had as a side effect that the software I write has become useful for quite a few end users. It is not the easy way out, but I learn. MathCAD or Matlab may be great to understand signal processing but the code and software that is the result can typically not be put in the hands of a normal loudspeaker DIYer.
And yes, there is more to the software than the FFT routine. It is not revolutionary, I admit, but I count on being able to sell it.
Hmm, I have a feeling that I am OT now. Sorry about that.
maybe I'm missing something essential and for sure I don't want to lessen your efforts on these matters, but to me it seems you just replicated the (more or less) standard method of determining the dynamic output impedance of an amp. This method is basically as following:
- attach a controlled current source at the output
- inject a known current into DUT
- measure voltage across DUT
- get impedance from voltage and current vectors
The essential difference is that I'm using the driver as a source. The driver is the current source, the current is the result of a complex interaction between the room, the driver and the enclosure of the driver. And I'm pretty sure that nobody has performed this particular experiment because the findings are startling.
Secondly, this is also about the driver. If the driver is loaded with a purely resistive load it essentially sees a reflection of itself.
Ultimately this is about the interaction between a particular driver and its load. Using six channels one could evaluate a two-way system at three points: Between the amp and the filter, between the filter and the tweeter and between the filter and the woofer.
Red pill or blue pill?
I beg you all to pay attention to the results I have presented in the last couple of posts. Take a good look at the impedance plots. I maintain that there is an awful lot of information in there. Information about both the amps and the driver. Look at the calibration data.
This also the last change to get out and leave. To quote Nietzsche:
If you long for piece and happiness then have faith, if you are a disciple of truth then search.
In my next post I will present the impulse response data for the two amps compared to their resistive counterparts. This will raise a question, at least it did with me. I will then present evidence that will put the question at ease. Finally there will be a blockbuster trilogy of posts in the last of which I will introduce a new metric for the damping factor of a particular amplifier driver combination.
In case you have missed it, this is getting very serious, dare I say scientific.
What is the Matrix?
Message to the moderators:
After this post there are basically two options:
- A lot of name calling and accusations resulting in endless discussion.
- We actually try to be scientific about this.
Let me broadly categorize what people will exclaim when they look at the attachment:
- Oh, dear
- Yes!!
- Fraud!!
- Please make it go away.
There will be accusations that I will use this result to explain away the lousy impedance plot of the SET amp. This will not be the case, I don't need to do this, the results will speak for themselves.
I have documented my method, I have shown that I can get reliable results.
And here's the important part: My results are in complete agreement with the existing theoretical framework.
Before you look at the attached result, let me tell you that the best is yet to come.
I would like to ask you to refrain from posting until I have presented the new metric I mentioned earlier.
Attachments
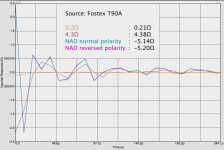
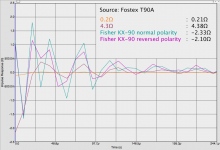
The attached result shows what happens if you do the same with a Fisher KX-90 push-pull tube amp.
The NAD and the Fisher have one thing in common. Care to guess what it is?
Ladies and Gentlemen, hang on to your hat because the next posts will show something that is not supposed to happen, cannot happen, is just plain impossible.
The NAD and the Fisher have one thing in common. Care to guess what it is?
Ladies and Gentlemen, hang on to your hat because the next posts will show something that is not supposed to happen, cannot happen, is just plain impossible.
Attachments
Where feedback went wrong
The attachment shows the impedance impulse response for the SiTuIT single ended tube amp when the polarity of the driver is reversed. The observed values for the resistors will be addressed later.
The results for two drivers are displayed, I can also show the results for the other two drivers.
The attachment shows the impedance impulse response for the SiTuIT single ended tube amp when the polarity of the driver is reversed. The observed values for the resistors will be addressed later.
The results for two drivers are displayed, I can also show the results for the other two drivers.
Attachments

Some more of feedback's biggest mistakes
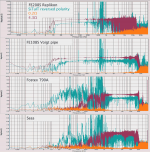
The previous result was interesting. This is the one that blew my mind.
And here it is, the impedance plot of the SiTuIT single ended tube amp for four different drivers.
I had to reduce the size of the image because of file size limitations but I think that the message is clear.
The previous result was interesting. This is the one that blew my mind.
And here it is, the impedance plot of the SiTuIT single ended tube amp for four different drivers.
I had to reduce the size of the image because of file size limitations but I think that the message is clear.
Attachments
Re: Re: Ladies and Gentlemen, may I have you attention please
Klaus -
Why would this be any different (or will it?) than just measuring the voltage and current with two different loads and calculating the output impedance? This is pretty easy.
KSTR said:Hi Gerrit,
This method is basically as following:
- attach a controlled current source at the output
- inject a known current into DUT
- measure voltage across DUT
- get impedance from voltage and current vectors
I've used this method in ATE (automatic test equipment) to fully characterize output impedance changes vs operating conditions of industrial (non-audio) power amps, besides it's an excellent stress test for the amplifier.
- Klaus
Klaus -
Why would this be any different (or will it?) than just measuring the voltage and current with two different loads and calculating the output impedance? This is pretty easy.
Earl,gedlee said:Klaus -
Why would this be any different (or will it?) than just measuring the voltage and current with two different loads and calculating the output impedance? This is pretty easy.
assuming that you meant using resistive loads, this gives only impedance values for those two specific load points, and those are in the 1st and 3rd quadrants. Even when pure reactive loads are used this still only covers a small part of the complete 4-quadrant area, the load ellipses (one could look for shape distortion of these to find buried nonlinearities of the impedance, though). While this measurement will probably suffice for 99% of typical audio amps and setups, it is a bulk or lumped measurement technique (if that is the correct english wording for it). I mentioned it recently, in the Solid State --> GR-25 thread (giving the formulas also) as one way of reality checking the results coming from the injected current method -- in fact, rather vice versa, as the two-loads-method appears to be somewhat less numerically stable than the current injection method when the load difference ratio is not high enough. As far as I see it, Gerrit's method also qualifes as a bulk method (that would perfectly explain the slightly different results with reversed polarity, especially with the single ended amp).
Depending very much on actual design of the amp, some strange things (including spurious oscillation) only come to light with a full scan of the I-V plane (within SOA bounds), and to find those were important in my application (the amps under test were intended as voltage output test pin drivers themselves).
The power of the small-signal test under varying large signal conditions is that it shows tiny variations of output impedance very clearly (e.g. "gm doubling" with emitter/source followers) while the bulk methods might mask those (render them buried in the noise) unless one happens to be in the right large signal region so the impedance change has a significant influence on measured bulk impedance.
- Klaus
Re: What is the Matrix?
- Klaus
Please rest assured that your investigations have my interest, and this interest is still very neutral -- not likely choosing sides (if at all) until I i) fully understand what exactly you did and ii) make my own mind about what is happening and how your graphs relate to it.Gerrit Boers said:Let me broadly categorize what people will exclaim when they look at the attachment:
- Oh, dear
- Yes!!
- Fraud!!
- Please make it go away.
There will be accusations that I will use this result to explain away the lousy impedance plot of the SET amp. This will not be the case, I don't need to do this, the results will speak for themselves.
I think it would be apreciated if you could give some more details about the exakt setup and conditions under which the experiments take place.I have documented my method, I have shown that I can get reliable results.
- Klaus
- Status
- Not open for further replies.
- Home
- Loudspeakers
- Multi-Way
- Current sense measurements on amp/loudspeaker