Hello Svante,
May be we should defined optimal souce impedance in order to obtain an optimal pulse response.
What we see very often is with a low Qts loudspeaker controlled by a very low ohm output impedance is an overrun on square waves. (well square waves and pulse reponse are different animals but it is quite difficult to interpret visually a pulse response)
A Butterworth response will have a small overrun. A bessel will not have and the square wave will be better reproduced.
Then what is an optimal pulse response : Butterworth, Bessel...?
May be it is more easy if the Qts is not too high to reach a Bessel response using a series resistor or an amplifer having some output impedance.
Best regards from Paris, France
Jean-Michel Le Cléac'h
Svante said:Boys, boys... 😀
We will have to define what "optimal" means here. I can see at least four interpretations in this thread so far:
Which impedance results in
1. ...the lowest distortion?
2. ...the best frequency response?
3. ...the most efficient use of power?
4. ...the neatest look of the voltage/current output from the amplifier?
Number 1 and 2 are IMO the most interesting in normal hifi.
Jmmlc said:Hello Svante,
May be we should defined optimal souce impedance in order to obtain an optimal pulse response.
What we see very often is with a low Qts loudspeaker controlled by a very low ohm output impedance is an overrun on square waves. (well square waves and pulse reponse are different animals but it is quite difficult to interpret visually a pulse response)
A Butterworth response will have a small overrun. A bessel will not have and the square wave will be better reproduced.
Then what is an optimal pulse response : Butterworth, Bessel...?
Well, that depends on if you want to look at the square wave or if you want to listen to the sound, I'd say.
Looking at square waves, or impulse responses can be quite deceiving IMO. The frequency response curve is much more correlated to the perception of sound, so I think it should be the first choice when doing measrements. Of course, that does not exclude looking at both, but if there is a choice as you put it here, the FR should overrule measurements in the time domain. IMO, that is... 🙂
Hello Svante,
Thank you for your reply even if I disagree somewhat about the supremacy of the frequency response over the pulse response.
A good frequency response can be obtain by a system having a bad pulse response (see the pulse response of a system using a Linkwitz-Riley crossover) while an excellent pulse response leads by definition to an excellent frequency response...
But specifically in the bass where the output impedance of an ampliifier plays a large role in the response, I tend to prefer a "Bessel style" response.
Best regards from Paris, France
Jean-Michel Le Cléac'h
Svante said:
Well, that depends on if you want to look at the square wave or if you want to listen to the sound, I'd say.
Looking at square waves, or impulse responses can be quite deceiving IMO. The frequency response curve is much more correlated to the perception of sound, so I think it should be the first choice when doing measrements. Of course, that does not exclude looking at both, but if there is a choice as you put it here, the FR should overrule measurements in the time domain. IMO, that is... 🙂
Current drive leaves all mechanical resonances undamped and does nothing against comb filtering due to delayed internal enclosure and external room sound reflections interacting back with the driver.
Back in 1945 they conceived speakers as devices to be driven from a non-zero impedance because they were completely unable to produce tube amplifiers with low output impedance, not because that was the optimum solution.
Back in 1945 they conceived speakers as devices to be driven from a non-zero impedance because they were completely unable to produce tube amplifiers with low output impedance, not because that was the optimum solution.
Hello,
I never saw any proof of such an interaction with the reflected waves... Do you have any paper title to recommand ?
Few years ago I did a study about the use of a series resistor between an ampliifer having a very low output impedance and a compression driver TAD TD2001 loaded by a Le Cléac'h horn (Fc= 320Hz).
see: http://perso.wanadoo.fr/francis.audio2/creux_1900Hz_TAD_TD2001.doc
The document is written in french language but the figures are easy to understand
first figure in the document shows the inverse correlation between frequency response curve (red) and impedance curve (blue). Within the interval of frequency fior which the horn provide a acoustical resistive load to the driver, every element of the shape on the first curve has its inverse equivalent on the second curve. This is surely not a random phenomenon. e.g: The explanation of the hole in the TD2001 curve is given in one of the 2 Kinoshita's JAES paper (1978-79). It is due to the resonance inside a cavity benath the coil. This resonance is reflected on the impedance curve.
Last figure (the 3rd fig), shows the linearization of the frequency response curve using series resistor (8ohms pink; 16ohms red).
A further improvement of the linearity is obtained when I use my Shabda SE amplifier, the output impedance of which is 53 ohms.
I guess similar improvement may be obtain with other compression drivers if their main impedance peak is lower than the cut-off of the driver.
Best regards from Paris, France
Jean-Michel Le Cléac'h
If you want to analyze what makes the sound, you would have to analyze the entirs chain, from voltage (or current) through the motor and the mechanical impedance, through the cone velocity and finally to the sound.
Correct, my point is that current measurements are more correlated to what's going on in the room than voltage measurements.
Ideally one would need to measure what's happening in the brain of the listener.
Current drive leaves all mechanical resonances undamped and does nothing against comb filtering due to delayed internal enclosure and external room sound reflections interacting back with the driver.
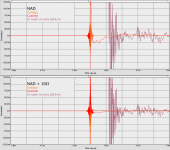
Attached is the correlation for voltage, current and in-room signal for the NAD and the NAD with 16ohms series resistance. To be fair, the directly connected NAD has lower values for most peaks in the first 0.7ms, but in the timescale shown in these plots the NAD with the series resistance seems to perform better. The first room reflection is just outside the plot, so we're looking at driver/enclosure resonances/reflections. Personally, I find it difficult to base any definite conclusion based on these results.
The damping factor of the NAD is limited by the 0.1 ohm current sense resistor to 80, with the series resistance this number drops to 0.5. This would suggest a huge difference in favor of the direct connection. I, for one, don't see this reflected in these measurement results.
Attachments
Hi Gerrit,
Neat results.
The plain NAD is charging up all of the first half cycle induced (sometimes longer) storage mechanisms due to low source impedance drive.
Then when the amplifier drives the voltage back, those energies remain trapped as independent sources in series with the amplifier output.
Cheers ....... Graham.
An awful lot of opinions not based in facts.
First, there can be substantial differences in the frequency domain and time domain approaches to sound analysis when one considers perception. The ear is not an FFT analyzer and doesn't obey the usual belief in the equivalence of the time and frequency domains. Excess Group delay can be quite audible and nonlinear distortion like (see www.gedlee.com/distortion_perception.htm ) which will not be seen in the frequency domain, but can readily be seen in the time domain.
Second, the perception of nonlinear distortion (also see above link) is not simple and no attempt to make it simple via looking at the current or the voltage will make it so. Its the order of the nonlinearity that matters not if it is in the current or voltage.
Third, saying that a driver responds to current is semantic, because it takes a voltage to create this current. Voltage and current are inseperable quantities and completely dependent on each other.
Fourth, higher output impedances ala, tube amps REDUCE the damping of a driver - this is because the voice coil is a Gyrator NOT a transformer and converts the electrical domain into its conjugate opr dual form as seen by the loudspeaker. Thus, raising the output impedance in the electrical domain LOWERS the resistance as seen by the driver in its mechanical domain.
Lets get these points cleared up and this discussion will be a lot more productive.
It is interesting and should continue as its important, but there is no point in arguing about things which have been cleared up elsewhere.
One more observation from my past:
Feedback REDUCES the overall nonlinearity in a system but it also INCREASES the orders of the remaining nonlinearity after the feedback is applied. Thus it could easily be the situation where the feedback lowered the THD but increased the audibility of the remaining distortion. Audibilty and nonlinearity ARE NOT one-to-one relationships.
That said it could also be the case where the feedback lowered BOTH the THD and the audibility. There is simply no simple answer here. Without a valid model of what we hear we cannot make statements about the audibility of feedback, or loudspeakers or anything else for that matter.
One has to look at the nonlinearity of the final result through a knowledge of what is audible and what is not. This works. It has been discussed in many other places (but I don't know of them right now).
Gerrit Boers said:
That is exactly what these measurements show,
Hi,
A thread that starts with an apparent question when what
is actually wanted is to tell you what they think answer is.
Your measurements do not show the effective damping
of the driver as you are not taking into account the
interchange between electrical and mechanical energy.
You are reading stuff into your measurements that is simply wrong.
🙂/sreten.
Hi all,
Welcome Dr. Geddes, I hope you'll find the results of the following experiment as interesting as I did.
Sreten,
You're correct, that was not proper reasoning. See below for more proof.
Here's the experiment:
I measured the current and voltage on the output of the NAD while making a lot of pseudo-random noise on the other channel. The noise was amplified by one of the SET monoblocks to exclude any effects of crosstalk internal to the NAD. Then I switched the NAD for a testlead, i.e. I shorted the driver. As the 0.1 ohm current sense resistor is still in the circuit, this situation represents a true damping factor of 80.
I think this result shows that, from the perspective of the driver, the NAD does NOT represent a low impedance load.
Attachments
Forget the last post
I'm just trying to replicate the previous result, seems I made a mistake somewhere.
I will take some more time to perform some proper measurements. My apologies for this, it was an honest mistake.
I'm just trying to replicate the previous result, seems I made a mistake somewhere.
I will take some more time to perform some proper measurements. My apologies for this, it was an honest mistake.
It seems the previous post was not a complete waste of time after all. I must admit that I was so preoccupied with proving my position that I mixed up observation with interpretation.
I suggest we put the whole solid state versus tube argument aside and concentrate on the observations.
What makes the measurement in the last post interesting is that it reverses the signal flow.
Normally we stimulate the driver electrically and measure the electric and/or acoustic results. Now the driver is stimulated acoustically and the measurement takes place on the electric side. The driver is the source and the amp is the load.
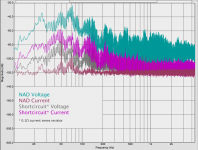
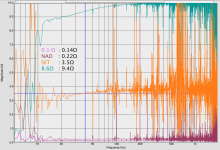
By means of an dual-FFT analyzer the impedance can be plotted as the driver sees it. Attached is the result for four different loads, the numbers in black are the values for the impedance at the cursor position (40Hz).
First a note on the measurement itself. Both voltage and current are measured by means of a balanced microphone pre-amp operating at maximum gain setting. The channel that measures the voltage has the -20dB pad activated, thus the gain for the current measurement is 60dB and for the voltage it is 40dB.
Observation:
The range between 30Hz and 50Hz is very clean compared to the rest of the spectrum.
Interpretation:
This is the range where the BLH/BVR amplifies the low frequencies, this results in a stronger electrical signal which in turn results in a higher signal to noise ratio.
Observation:
The plot for the SET amp contains very large spikes, both up and down. It looks like these spikes come in clusters.
I suggest we put the whole solid state versus tube argument aside and concentrate on the observations.
What makes the measurement in the last post interesting is that it reverses the signal flow.
Normally we stimulate the driver electrically and measure the electric and/or acoustic results. Now the driver is stimulated acoustically and the measurement takes place on the electric side. The driver is the source and the amp is the load.
By means of an dual-FFT analyzer the impedance can be plotted as the driver sees it. Attached is the result for four different loads, the numbers in black are the values for the impedance at the cursor position (40Hz).
First a note on the measurement itself. Both voltage and current are measured by means of a balanced microphone pre-amp operating at maximum gain setting. The channel that measures the voltage has the -20dB pad activated, thus the gain for the current measurement is 60dB and for the voltage it is 40dB.
Observation:
The range between 30Hz and 50Hz is very clean compared to the rest of the spectrum.
Interpretation:
This is the range where the BLH/BVR amplifies the low frequencies, this results in a stronger electrical signal which in turn results in a higher signal to noise ratio.
Observation:
The plot for the SET amp contains very large spikes, both up and down. It looks like these spikes come in clusters.
Attachments
Hello Gerrit,
Do you know the log sine sweep + convolution method (developped by Angelo Farina)
See his JAES paper:
http://pcfarina.eng.unipr.it/Public/Papers/134-AES00.PDF
It is a powerful tool to recover a pulse response having a very high ratio signal/noise (even more than a MLSA method).
Oonly two plugins called "sweepgen" and "convolve" are required to be installed in Adobe Audition.
They can be downloaded at:
http://www.aurora-plugins.com/Aurora_XP/index.htm
Some integrated tools like Arta can perform the same too.
Best regards from Paris, France
Jean-MIchel Le Cléac'h
Gerrit Boers said:It seems the previous post was not a complete waste of time after all. I must admit that I was so preoccupied with proving my position that I mixed up observation with interpretation.
I suggest we put the whole solid state versus tube argument aside and concentrate on the observations.
What makes the measurement in the last post interesting is that it reverses the signal flow.
Normally we stimulate the driver electrically and measure the electric and/or acoustic results. Now the driver is stimulated acoustically and the measurement takes place on the electric side. The driver is the source and the amp is the load.
By means of an dual-FFT analyzer the impedance can be plotted as the driver sees it. Attached is the result for four different loads, the numbers in black are the values for the impedance at the cursor position (40Hz).
First a note on the measurement itself. Both voltage and current are measured by means of a balanced microphone pre-amp operating at maximum gain setting. The channel that measures the voltage has the -20dB pad activated, thus the gain for the current measurement is 60dB and for the voltage it is 40dB.
Observation:
The range between 30Hz and 50Hz is very clean compared to the rest of the spectrum.
Interpretation:
This is the range where the BLH/BVR amplifies the low frequencies, this results in a stronger electrical signal which in turn results in a higher signal to noise ratio.
Observation:
The plot for the SET amp contains very large spikes, both up and down. It looks like these spikes come in clusters.
Hi Jean-Michel,
I was not aware of that particular procedure, thanks for the link. I will look into this.
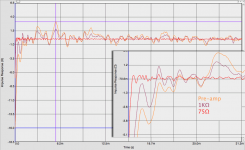
Attached is the impulse response for three different loads; Just the pre-amp, a 1K resistor and a 75Ω resistor. To measure what impedance the pre-amp represents to the driver I moved the voltage measurement leads so that the current sense resistor was in the loop. I will attach this impedance plot to another post. According to specifications the pre-amp has an input impedance of 2KΩ.
The vertical scale is in Ω and the response starts with negative values, I must admit that do not fully understand what this means. Is this because the driver is generating current?
IMO the attached measurement serves to illustrate this point. By reducing the load impedance the feedback of the system is increased and thus the damping is increased. This is clearly visible in the plot. The plot for the 75Ω load shows a severe reduction of the lower frequency components and much better overall damping, but high frequency components are clearly visible in the plot.
I was not aware of that particular procedure, thanks for the link. I will look into this.
Attached is the impulse response for three different loads; Just the pre-amp, a 1K resistor and a 75Ω resistor. To measure what impedance the pre-amp represents to the driver I moved the voltage measurement leads so that the current sense resistor was in the loop. I will attach this impedance plot to another post. According to specifications the pre-amp has an input impedance of 2KΩ.
The vertical scale is in Ω and the response starts with negative values, I must admit that do not fully understand what this means. Is this because the driver is generating current?
Feedback REDUCES the overall nonlinearity in a system but it also INCREASES the orders of the remaining nonlinearity after the feedback is applied.
IMO the attached measurement serves to illustrate this point. By reducing the load impedance the feedback of the system is increased and thus the damping is increased. This is clearly visible in the plot. The plot for the 75Ω load shows a severe reduction of the lower frequency components and much better overall damping, but high frequency components are clearly visible in the plot.
Attachments
Jmmlc said:Hello Svante,
Thank you for your reply even if I disagree somewhat about the supremacy of the frequency response over the pulse response.
A good frequency response can be obtain by a system having a bad pulse response (see the pulse response of a system using a Linkwitz-Riley crossover) while an excellent pulse response leads by definition to an excellent frequency response...
Yes, all of this is true but...
1. Even if the impulse response from a LR filter is horrible, does it matter? The response of such a filter is essentially the same as from an allpass filter. I have done quite a few listening tests on allpass filters and they are almost impossible to hear, even though I have used a blind test setup with proper statistic treatment etc. I have used mainly headphones for this. For frequencies above 500 Hz I am willing to bet $1 that you cannot hear the filter in a blind test. Below 200 Hz it is possible that you will be able to identify it if you find the right signal. On normal music, it is very hard there too. The bottom line here is that there is a better correlation between listening impresson and FR than with listening impression and IR.
2. As I understand it, correct me if I am wrong, you have looked at the impulse response of the current to the loudspeaker. Your idea is that this impulse response is more important than the impulse response of the voltage? The reason for this would be that the force acting on the cone is proportional to the current and not the voltage?
If this is the case, you have got it all wrong. It is perfectly natural that the current impulse response is not "perfect" if we drive a loudspeaker load. Since the loudspeaker impedance has a resonant behaviour, so will the current. Forcing the amplifier to have a "perfect" current impulse response is essentially equivalent with giving it a high output impedance. This in turn is equivalent to setting the drivers Qts=Qms. In other words, the Q of the system will be around 2-5, and this means really resonant (=poor sounding) bass.
3. Even if a perfect impulse response leads to a perfect frequency response, this is not very interesting. The interesting part is the connection between a non-perfect IR/FR and how it sounds. I'd say that I can imagine reasonably well from a FR how a system sounds. The IR, OTOH tells me almost nothing.
I have seen over-interpretations of the impulse response so many times, it must be something really seductive in its appearance that makes people connect it to perceived sound quality. IMO we do not hear impulse response. So, stop looking at them and look at the frequency response instead.
(Of course I realise that me saying so will not stop anyone, but now I have said it anyway 🙂 )
Hi Svante,
Further discussion - prompted by your post - not arguing at you.
High impedance drive might get you the notes (frequency response), but it cannot provide the impact and control of voltage drive, thus a compromise is necessary which equates to optimum impedance drive related to driver, cabinet, room etc.
In a rear loaded cabinet (Replikon) the rear loading has great effect at LF, and with higher Qes drivers the cabinet air motion can control driver motion about resonance providing a smooth sounding increase in output. Then med/low Qes drivers will put much more energy into the cabinet air-spring storage mechanisms with voltage drive than with current drive, which with the voltage drive sounds like more powerfully impacting bass transients. Whether a loudspeaker is NAD or triode driven is not as relevent as the nature of their output imedances.
Where a driver/cabinet system has impedance peaks these show that the cabinet is dominating driver transduction. Where driver impedance is flat then the driver response is likely to be good too no matter whether current or voltage drive, and so the impact/transient response is much more likely to be accurate. (I mean the driver response without there being a separate paliative impedance correction circuit which is for amplifier driving benefit only, not for the driver and its transduction capabilities other than shaping the overall response.)
I might not be able to hear driver fundamental system resonance related impulse response modification on some kinds of music (classical string/wind), but most certainly I can on rock and kick-drum/bass guitar, and most especially with that first plectrum picked release on a low note. Also especially when the overall reproduction has not been modified (which to me this means ruined) by the likes of a Replikon.
Many LF source impedance modified results due to the (undamped) Replikon must apply to the Replikon only.
Cheers ......... Graham.
Re: Forget the last post
Hello Gerrit,
Jean Hiraga mentionned in his paper "Sound of distortion" translated bu Jan Didden in Glass Audio a method to study the distortion due to the back EFM which was developped in a university in Tokyo:
See (without figures but may be the full paper can be find somewhere on internet):
http://www.milbert.com/articles/sound_of_distortion
Here is an excerpt:
"Among the different measurement schemes proposed to prove the existence of this type of distortion, there is no lack of interest in those that simulate the appreciable energy caused by the counter-electromotive force of the loudspeaker and the acoustic enclosure, which is re-injected -- not as a voltage but as an energy -- into the output of the amplifier -- while the amplifier itself is reproducing a different frequency."
"Actually, the classical measurements (harmonic distortion, intermodulation distortion according to the SMPTE norms) do not allow detecting it. The basics of this method, which was proposed about 20 years ago by a team of researchers from the University of Musashi, Tokyo, are still relevant today. They are depicted, with some extensions, in Fig. 2."
"The method consists of injecting a 1kHz signal at the input of the amplifier under test to obtain a nominal 15W power into the load at the output. This is either a pure resistive 8-ohm load or a loudspeaker. A low output impedance power generator, in turn, through a non-inductive 250-ohm / 1000W resistor and a LC filter to suppress the 1kHz band (self-induction of 7.5mH/15A plus capacitor 3.3uF), inserts a 50Hz signal into the terminals of the load or the loudspeaker. You thus recover the composite signal present at the load or loudspeaker terminals. This signal is then fed into an audio spectrum analyzer."
Best regards from Paris, France
Jean-Michel Le Cléac'h
Gerrit Boers said:I'm just trying to replicate the previous result, seems I made a mistake somewhere.
I will take some more time to perform some proper measurements. My apologies for this, it was an honest mistake.
Hello Svante,
You loose your $1.
Phase distortion is something I am very sensible to, some peoples are, some other are not, see Daisuke Koya's thesis on the subject:
http://mue.music.miami.edu/thesis/daisuke_koya/MastersThesisDaisukeKoya.pdf
At ETF'04 I gave a conference on the phase distortion and method to reduce it in one of its main source :the crossover.
See the link in the message:
http://www.diyaudio.com/forums/showthread.php?postid=1482039#post1482039
A better french version of that conference can be downloaded at:
www.melaudia.net/zdoc/distorsion_de_phase.pdf
Since long time I develop crossovers having a very low phase distortion below 4kHz (somtimes called "Le Cléac'h crossover" as now many people use them).
About the pulse measurement by the sweep_sine_log + convolution : this is just a recommandation to Gerrit to obtain a large signal/noise ratio. This leads to a better "readability" of the results. Not only the current can be derived as a pulse but also the voltage. I guess that using different series resistors between a low output impedance amplifier and a loudspeaker this enable to study the effect of the back EFM.
From the pulse measurement you can derive quickly and with less artefacts more information than with conventional method. (A Fourier transform will lead to the module + phase by example).
Also a deconvolution of a mesured pulse by a reference one (by example with no series resistor) can be done to extract the information about the back EFM... One can imagine different use of those pulse measurements...
About the damping of a loudpeaker we have to separate the case of the medium and high frequency loudspeaker, the acoustical load of which can be considered in a first step as resistive of the case, of the bass loudspeaker which is nearly allways acoustically loaded by a reactive load (except in the case of large bass horns having a very low cut-off, in which case the acoustical load is motly resistive above 20Hz).
My opinion is that most bass loudspeaker I used to listen was badly damped. The common idea is that a low ouput impedance of the amplifer allows a "better damping" of the loudspeaker. IMHO most often it is overdamped. And we can agree that if using a very large output impedance it will be most often "underdamped". So between the two exists an optimal loading. This is what we are disussing: how to define what is an "optimal loading".
An interesting study linked to that point is Nelson Pass's paper
http://www.firstwatt.com/downloads/cs-amps-speakers.pdf
inside which he gives the best values for the components of a parallel network for different loudspeakers when using a transconductance amplifier.
I rarely just look at the pulse reponse obtained by the logsweep + convolution method, most often I used tools as FFT, spectrograms, etc. and I developped my own Matlab routine Matlab based on a DFT with a window the width of which varies with frequency. This allow me to derive both the frequency response, the unwrapped phase curve and the group delay curve. Too bad that you don't pay enough attention to the distortion due to phase / group delay...
Best regards from Paris, France
Jean-Michel Le Cléac'h
Svante said:
Yes, all of this is true but...
1. Even if the impulse response from a LR filter is horrible, does it matter? The response of such a filter is essentially the same as from an allpass filter. I have done quite a few listening tests on allpass filters and they are almost impossible to hear, even though I have used a blind test setup with proper statistic treatment etc. I have used mainly headphones for this. For frequencies above 500 Hz I am willing to bet $1 that you cannot hear the filter in a blind test. Below 200 Hz it is possible that you will be able to identify it if you find the right signal. On normal music, it is very hard there too. The bottom line here is that there is a better correlation between listening impresson and FR than with listening impression and IR.
2. As I understand it, correct me if I am wrong, you have looked at the impulse response of the current to the loudspeaker. Your idea is that this impulse response is more important than the impulse response of the voltage? The reason for this would be that the force acting on the cone is proportional to the current and not the voltage?
If this is the case, you have got it all wrong. It is perfectly natural that the current impulse response is not "perfect" if we drive a loudspeaker load. Since the loudspeaker impedance has a resonant behaviour, so will the current. Forcing the amplifier to have a "perfect" current impulse response is essentially equivalent with giving it a high output impedance. This in turn is equivalent to setting the drivers Qts=Qms. In other words, the Q of the system will be around 2-5, and this means really resonant (=poor sounding) bass.
3. Even if a perfect impulse response leads to a perfect frequency response, this is not very interesting. The interesting part is the connection between a non-perfect IR/FR and how it sounds. I'd say that I can imagine reasonably well from a FR how a system sounds. The IR, OTOH tells me almost nothing.
I have seen over-interpretations of the impulse response so many times, it must be something really seductive in its appearance that makes people connect it to perceived sound quality. IMO we do not hear impulse response. So, stop looking at them and look at the frequency response instead.
(Of course I realise that me saying so will not stop anyone, but now I have said it anyway 🙂 )
Many reseachers, including myself (see Moore, Geddes and Lee, etc. in JAES) have shown - in double blind tests - that group delay can be audible. It is not always audible, it depends on the frequency, delay time, AND the playback level. Group delayed signals, such as diffraction can be very audible.
Now, I challenge you to find these effects in the frequency domain - it can be done, of course, but not from magnitude only and even with the phase you must unwrap it and subtract out the minimum phase portions and then find that part of the magnitude response that is related to the excess phase. So basically there ARE audible effects that are difficult to impossible to see in the frequency domain. But these things can be quite easy to see in the impulse response. For a long time I did not believe in CSD plots because they didn't show anything that is not in the impulse response and the impulse response and the frequency response are the same thing. But there ARE things that can be more readily identified by CSD. I don't think that many people know how to do this, and for the most part CSD is misread and it is little different than the impulse response. But there is one small, but key, factor and that is that the impulse response is linear and the ear reacts log. So one needs to look very carefully at the low level tails on the impulse response or look at the log levels.
Hence, lets not throw out the impulse response all together. At least not until you can show me these effects in the frequency domain.
- Status
- Not open for further replies.
- Home
- Loudspeakers
- Multi-Way
- Current sense measurements on amp/loudspeaker