Well one option to prove there actually are differences would be to let Juhazi show us an APL_TDA plot of his AINOgradient speakers, measured at the listening spot. The Demo version would do it, just make a screen grab like I did.
My plot above is a left + right channel measurement with my convolution engine inline to correct the response. An exercise like that should clue you in to possible differences between these different concepts we are talking about.
Just an open invitation, I've already talked someone into taking a measurement like this, knowing he has a brilliant room and multi way speakers. So you're not doing it to satisfy my curiosity. Just to learn something new. I wanted to learn so I did try it. So did the forum friend I'm talking about, just to learn.
Well, showing decays in various formats (eg. wavelets) is more about the room than the speaker. REW can show walvelets of decay but in a different manner than ALP. I can show one of AINOs in my room, but that would not help this discussion.
ra7's 1,3kHz dip appears in all of his measurements, at every distance and every height. just small variations. With longer gating is smooths out because of more random reflections start to mix in.
The line array "thing" to me is just about adding source points and mixing in more sources and reflections. I don't believe in "tall wavefront", it is just a simplified presentation of these multiple arrivals with some smoothing. With ERB or other psychoacoustic filter they get smoothed in a FFT graphical presentation. But that happens to every other type of speaker in a room too! And all those multpile "first" arrivals exist in reality. Also floor and ceiling reflections happen, but they get mixed and "smoothed" alike!
I don't question the good sound of a LA or CLA. We are always making compromises with speakers in a room. There are many ways to skin a cat or a snake.
Sorry guys, I can't make a CLA proto now, my HT room is occupied by my lazy son who sleeps until late aftenoon...
Last edited:
Juhazi - please allow me to make a point here. Just the way I see it, no harm meant.
Lets say this thread was about restoring a classic car. Ra7 is showing pictures of the great body work he has been doing. He posts the pictures or even video of what he has done so far.
Now you come in and say: Hey! That car isn't fit to drive! It's totally un-save. Look at the threads on those tires! Barely any threads left!
Now ra7 has to make it clear to you the wheels are on the car temporary, just for the re-spray. He isn't finished yet and his actual set of wheels were left off to prevent them getting a mist of paint.
That's what I see you doing here. Might be a bit of a bold statement but you did miss the point which ra7 brought forward and used the measurements to show some stuff he isn't done with yet. Now substitute the wheels for a damping panel at the right position. 😉
Lets review APL_TDA. If you look up the actual meaning of the abbreviation, the TDA part stands for Time Domain Analysis. So while it may look like a room decay plot, and part of it is, the reason it was made is to show the time domain behaviour of speakers. So it isn't really just a waterfall plot. Yes, it does show room behaviour. But more importantly it shows us time behaviour. What do we hear, that kind of stuff. It's actually a wavelet kind of view if you want to look at REW's counterpart. This post will show you both, the TDA plot and it's REW counterpart.
Please read this paper: http://aplaudio.com/downloads/Equalizing_loudspeakers.pdf, look at the examples shown and take another look at the graph I posted. Then decide if it might be interesting for you to run that demo. I promise you, you will be seeing your room and speaker. And isn't that the point? Get good performance of our speakers in our room? You don't need to run that piece of software for me. But it just might prove a valuable lesson for yourself. Most of us here do try to get great sound in our room, the last time I checked. I'm convinced (and I think ra7 is as well) line arrays can bring that to us. No need for you to agree.
I did follow your AINO-gradient project even though I did not post on your thread. I enjoyed reading the journey you made. Part of me was very curious how it would all work out. Try the mentioned APL_TDA software just to check your accomplishments in the time domain. You might learn something from it. I know I did.
Ra7 will probably continue as scheduled to track down the reason for that dip you mentioned. As said, I do not see that dip in my measurements so there must be a reason why is shows up in his measurements. We were already on it in fact. I promise you we will try and track it down and solve that problem. Meanwhile I hope the graphs ra7 posted served it's own purposes of what it was meant to show for you and others viewing this thread.
Thanks for the impassioned support Wesayso!
Juhazi, Wesayso is right. I haven't diagnosed all the room reflections. The height/distance measurements should be taken as a group and were meant to study the response of the array compared to theory. I was merely trying to answer some of the questions that had come up in the thread. Now, you have brought up a new question, and I don't have an answer yet. But I will do some digging and try to answer your question. I am curious to know where that dip is coming from. Wesayso has also pointed out some other reflections that need treatment. One thing to note again is that these speakers are meant to be listened at some distance. Just like other speakers, horns for example, they will simply not sound right if you sit too close. You say that "With longer gating is smooths out because of more random reflections start to mix in." But doesn't the response look worse with longer gates for a normal multi-way speaker? That is the whole point of gating, right? To eliminate reflections? So, why then do we see the array response improving with longer gates?
There is no question about the topology, the performance, and the benefits of a floor-to-ceiling array. I disagree with you about the "it is just a simplified presentation of these multiple arrivals with some smoothing." The floor and ceiling reflections are actually missing! They are simply not there! I can show you the measurement of a normal speaker in the corner and the line array to prove that the ceiling reflection is completely eliminated.
Indeed there are many ways to solve the problem of sound reproduction in a room, but I believe that line arrays may be the optimum solution in terms of solving the key issues, performing superbly in every other important aspect (frequency response, power handling, distortion, etc.) as well as occupying very little space. In my brief diy career, I started with full range drivers, then on to open baffles, then on to horns and now this speaker. I have explored many solutions but this topology solves many key issues in an elegant fashion.
You being in Finland, Wesayso's arrays are in your neighborhood. Why don't you try to stop by and have a listen? I can assure you that you will be blown away. He is much farther along in the post-processing and the room treatment department. And post-processing and room treatment are very important, especially for this type of speaker where conventional approaches may not work.
Indeed point source full space radiation can be divided into two hemispheres with a solid wall without affecting the pattern which is enough to demonstrate the point that a wave can be constrained by providing travelling regions of equal pressure around it so that there is no gradient to encourage expansion outside these regions, and that walls will also provide this same effect.
Where I see less disagreement about this though is at the lower end of the band. Not that higher frequencies are really that difficult to organise whatever the case.
Where I see less disagreement about this though is at the lower end of the band. Not that higher frequencies are really that difficult to organise whatever the case.
To wesayso - I installed APL-DTA and run a measurement with it and REW. DTA used sine sweep and basically it does same analyses as REW. DTA has minimal user-set parameters an only some graphic presentations. It's TDA (delay) looks very much like REW's wavelet spectrogram, only axes are switched. Also it's DTR (group delay?) is nice/simple.
To ra7 and AllenB - bass region seems to work as giant driver (coherent waveform) until first nulling (1,3kHz??) above that lobing takes over. Reflection analysis is very difficult and we should know the room dimensions too.
Thank you again ra7 and wesayso for showing us these LAs and your measurements. Very good information and food for thoughts!
To ra7 and AllenB - bass region seems to work as giant driver (coherent waveform) until first nulling (1,3kHz??) above that lobing takes over. Reflection analysis is very difficult and we should know the room dimensions too.
First nulling? What does that even mean? Can you explain the physics behind your hypothesis? You are completely dismissing all other possibilities and jumping to conclusions.
And lobing takes over? This is exactly what the charts show does not happen. Within the listening window, the response is very even.
I would ask that you hold your opinion for a while until I have had a chance to look at the measurements, understand what is happening and determine the cause of the dip. Your patience will be much appreciated.
Last edited:
Given such great time domain charts, what is the imaging like? I'd like to ask a few specific questions, if I may, though your not under obligation to answer.
1. How is the sound field when near one or the other speaker?
2. In 2 dimensions, what's the imaging like? How precise, and large does the image seem? I mean, does it "sound" like you are watching a concert on a movie screen, or does it sound like you are in a club with live musicians? Not sound quality, just size of presentation.
3. In 3 Dimensions, do you get the illusion of height, or does everything sound like is on the same plane?
4. What are good demo tracks that you might be using?
Thanks!
Erik
Juhazi - Correct, I said that, the methods of calculation are different though. REW uses FFT and as outlined in the paper on the TDA software, that piece of software does it a bit different using band pass filters. The claim from it's author is more precision in the time domain. The presentation of data is very different though.
But it does provide a clear view on the actual time response of your speaker.
It does look to do a better job than REW, presenting that data to interpret what is happening.
To quote the paper:
This was reason enough for me to at least try the demo version. The jury is still out for me what I think about the above claim but it presents the timing data nice and clear. It has much overlap with the way I view and do my processing, which might help explain my results.
I showed you my results, what did yours look like? 🙂
I still disagree with the other part of your post. As already said, I don't have that dip. This is an area ra7 is still working on. My results have benefitted from placing 3 damping panels at key places. We can't deny we're in a real room. I'll add more info on my room at a later time. I've had more questions on that so I should make it clear what I'm dealing with. I don't have a symmetrical setup at all.
Erik, are you asking me? (as the poster of the TDA chart from my system which is in a corner but not exactly a corner array)? 😀
But it does provide a clear view on the actual time response of your speaker.
It does look to do a better job than REW, presenting that data to interpret what is happening.
To quote the paper:
Almost all audio analyzers use Discrete Fourier Transformation (often called Fast
Fourier Transformation for data size that is power of 2) and derive (calculate) all their
information (curves) from data obtained through FFT.
But you must supply FFT with a sequence of samples –a block of data. This block
must be quite large to have a usable frequency resolution. But with large block size
we get very inaccurate timing information that is comparable to that block size. The
Time Delayed Spectrometry (TDS) is its implementation with „waterfall” graphs as a
result.
This brings us back to history to when the first audio spectrum analyzers were built,
incorporating a number of Band Pass filters, detector circuitry and LED strips as
indicators.
And also, it brings us back to our human hearing that is using many resonators, BPF,
(mechanical?) to analyze sounds that we perceive.
The processing of Band Pass filters outputs gives us very interesting, high resolution
timing information that allows to see how the signal energy of different frequencies
travels thru a system (or a loudspeaker, particularly) and to see (as a result)
frequency-dependent delays directly in graph form and in very high resolution. And
please don’t worry – the Heisenberg-Gabor limit is not broken. We are just a bit
closer to this limit.
From the Heisenberg-Gabor limit we know that dF*dt=CONST. For FFT analysis this
constant tends to be 1 (or some part of 1). But for TDA, it is about 1/20 … 1/50 -
about 10 times (or more) better than FFT.
This was reason enough for me to at least try the demo version. The jury is still out for me what I think about the above claim but it presents the timing data nice and clear. It has much overlap with the way I view and do my processing, which might help explain my results.
I showed you my results, what did yours look like? 🙂
I still disagree with the other part of your post. As already said, I don't have that dip. This is an area ra7 is still working on. My results have benefitted from placing 3 damping panels at key places. We can't deny we're in a real room. I'll add more info on my room at a later time. I've had more questions on that so I should make it clear what I'm dealing with. I don't have a symmetrical setup at all.
Given such great time domain charts, what is the imaging like? I'd like to ask a few specific questions, if I may, though your not under obligation to answer.
1. How is the sound field when near one or the other speaker?
2. In 2 dimensions, what's the imaging like? How precise, and large does the image seem? I mean, does it "sound" like you are watching a concert on a movie screen, or does it sound like you are in a club with live musicians? Not sound quality, just size of presentation.
3. In 3 Dimensions, do you get the illusion of height, or does everything sound like is on the same plane?
4. What are good demo tracks that you might be using?
Thanks!
Erik
Erik, are you asking me? (as the poster of the TDA chart from my system which is in a corner but not exactly a corner array)? 😀
Last edited:
We are wandering from the subject, I hope to be able to do TDA measurement of Ainos tomorrow. I will create a new thread for that now.
ra7 - first nulling (the lowest in F) is what xrk got in Akabak simulation (green line). It is a phenomenom that all loudspeakers of finite dimension have, interference from edges or multiple sources. Radiator and baffle dimensions make that, in order of wavelength. Here it is explained for dipoles, which have it in maximal magnitude. An infinite baffle is free of it, and a LA is trying to imitate that vertically. Just looks to me that this first nulling is at 1,3kHz in your CLA/room.
ra7 - first nulling (the lowest in F) is what xrk got in Akabak simulation (green line). It is a phenomenom that all loudspeakers of finite dimension have, interference from edges or multiple sources. Radiator and baffle dimensions make that, in order of wavelength. Here it is explained for dipoles, which have it in maximal magnitude. An infinite baffle is free of it, and a LA is trying to imitate that vertically. Just looks to me that this first nulling is at 1,3kHz in your CLA/room.
Last edited:
Have you thought about what is the source of the null? It is a question of sound sources adding according to their magnitude and phase shift. When the phase shift is 180, you get a null. Now, how might this look for 25 sources summing at a point more than 12 feet away? Can you get a null at 1.3 kHz from such a scenario? I don't think so.
In Speaker Dave's paper on line array theory, he examines the situation at 90 degrees from the array's main listening axis, i.e., imagine looking at the array from the top. From that angle, the interunit spacing is the highest. Depending on this interunit spacing you can get a perfect cancellation at a frequency where the interunit spacing is exactly half wavelength. You will get a perfect sum at a frequency where the interunit spacing is exactly one wavelength, i.e., phase goes through one cycle and then the second units adds in full with the one ahead. This is the worst case scenario. At normal listening distances and normal listening axis, the interunit spacing becomes negligible and because there are 24 drivers and you are sitting away from the drivers, the phase shifts are completely random and you get less than perfect summing, but summing nevertheless.
So, no, I don't believe it is a null because of finite dimensions of the speaker. At least, I don't see any relationship yet. Again, I appreciate you putting forth a question, but let's not get ahead of what we know at this point.
Maybe you have a lot of experience with nulling in OB speakers. Yes, it is a big problem that must be overcome in that design. But I just don't see how it can apply here.
Last edited:
A continuity of pressure regions, ie that which defines the wavefront shape, can be seen to be appropriate where this shape fits geometrically with the physical (wall) constraints that are present, otherwise it may be seen to be in conflict with the walls.
No differently though, any virtual plane (or asymptote thereof) normal to the wavefront and located somewhere between the physical walls should also conform this way, or the wavefront fails to maintain the support which keeps it running true, and higher order modes will result.
These two sims are identical except for a slight difference in frequency.
Attachments
Last edited:
I am puzzled why everyone is so worried about ...WWWWWTWWWWWW.... lobing but not FFFFFFFFFFFFFFFFFFFFFFFFFFFFFFFF... lobing!
I´d like to see some real world measurements of the first like ra7 showed of his CLA.
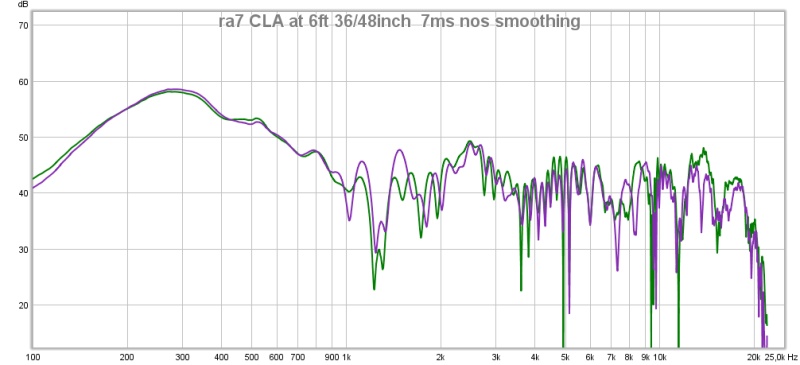
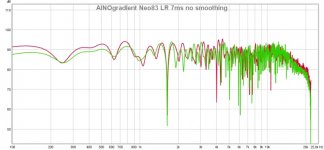
And here is his line at 6ft unsmoothed 7ms IRgate (like we look at 2/3ways integration/lobing) I am puzzled about that 1,3kHz dip, that should be pretty audible and it lies at a very sensitive range...
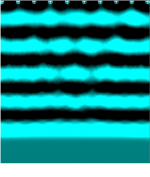
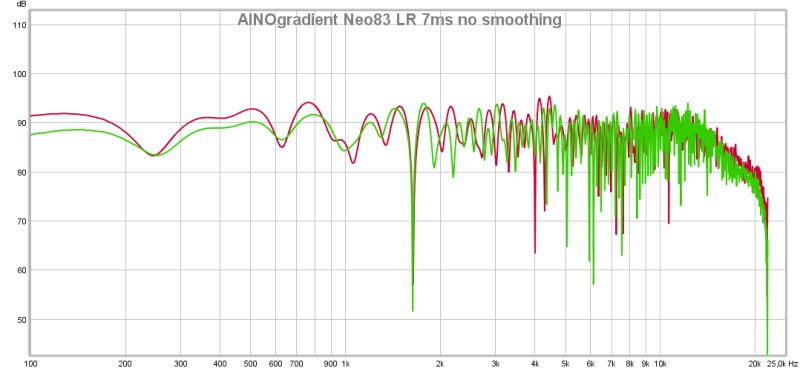
For comparison my AINOgradient speakers at listening position in my room, same 7ms gating and no smoothing to show nulls of interferences. The dip at 250Hz is ceiling reflection i guess. 1,7kHz dip is frontwall hitting back.
Attachments
Last edited:
Your AINO gradient:
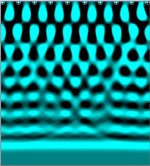
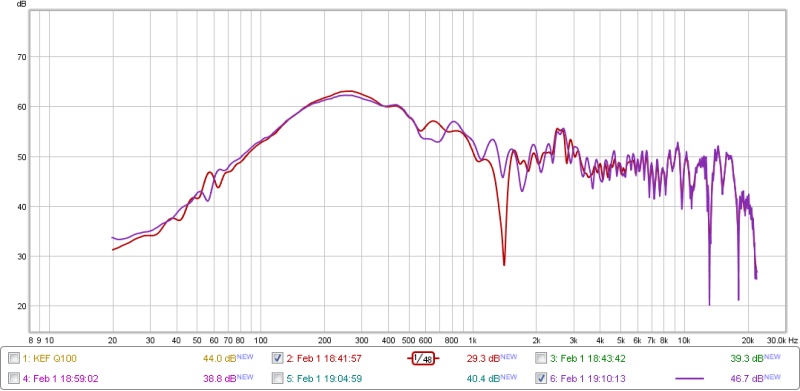
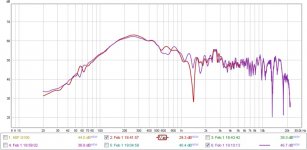
vs things to come for ra7 (my line arrays, left and right 7 ms gate, unsmoothed)

Now where did that pesky dip go... 😉
By the way 7ms does not work well for me as I do have a reflection before that. This is a listening position measurement and my back wall behind the mic is simply too close.
vs things to come for ra7 (my line arrays, left and right 7 ms gate, unsmoothed)
Now where did that pesky dip go... 😉
By the way 7ms does not work well for me as I do have a reflection before that. This is a listening position measurement and my back wall behind the mic is simply too close.
Last edited:
DRC soluiton
ra7,
Is it possible to post the time domain transfer function that you developed using DRC? I am most interested phase vs. frequency (unwrapped) or group delay vs. frequency.
Thanks....Frank
ra7,
Is it possible to post the time domain transfer function that you developed using DRC? I am most interested phase vs. frequency (unwrapped) or group delay vs. frequency.
Thanks....Frank
I am going to be away from my computer until the 30th. I'll see what i can share then. Note that the correction I am currently using is mostly the standard erb setting with a few tweaks. There is more work to be done before i can call it final.
After being away for a while, I finally got a chance to investigate the cause of the dip pointed out by Juhazi. It is coming from the projector screen edge that is on the front wall. Here is a measurement with the projector screen on the wall, and then off the wall (placed to the side; it is so big that it is not easy to move it around).
So, there we have it. The dip is not a function of the line array, or the size of the driver, or interference between units or any such thing. Hope that answers Juhazi's question. As shown by Wesayso, it is not present in his array either. This, and the fact that the dip goes away once the projector edge is moved away should be enough to show that the dip is not a feature of the design.
I do need to find a way to mitigate it. Maybe with some foam on the edge or something similar. The projector screen is certainly not going anywhere.
EDIT: The earlier reflection in the second plot could very well be the screen edge that has been moved further away but along the wall.
Attachments
Last edited:
ra7,
Is it possible to post the time domain transfer function that you developed using DRC? I am most interested phase vs. frequency (unwrapped) or group delay vs. frequency.
Thanks....Frank
Frank,
I am still in the processing of removing the reflection mentioned above and maybe it is best not to rely on the current correction supplied by DRC. Though, I have to say it sounds pretty damn good. I will post the correction when I get to the next stage. Thanks!
Thank you ra7, damn these room measurements!
I find it strange that a projector screen makes such a strong reflection, obviously it has a solid frame. Perhaps you can construct a fake wall panel (flap) that covers that part of front wall and prevents sound waves hitting the frame?
I find it strange that a projector screen makes such a strong reflection, obviously it has a solid frame. Perhaps you can construct a fake wall panel (flap) that covers that part of front wall and prevents sound waves hitting the frame?
It's such a narrow sharp dip - do you actual hear it with your ears? Maybe add some foam on the edge and do your best and call it a day.
- Home
- Loudspeakers
- Multi-Way
- Corner Floor-to-Ceiling Line Array Using Vifa TC9