That is some very nice work there! It's great to see DIY work backed up by actual measurements.
Concerning the distortion curve, what's the distortion look like @40 Hz? That's in the passband and according to the impedance curve, likely the point where the driver is undergoing maximum displacement.
How does the response compare to the sim? You can check this by exporting the response from Hornresp as an FRD file, then importing it into REW. I'm particularly interested in seeing if the "lossy Le" feature in Hornresp produces a result that's a better match for the measurements.
Were the cabs close together for the impedance measurements?
So that's how you import HR data - thank you!
I'm having a bit of trouble thought. Bare with me. I went to Acoustical Power > File > Export > SPL + Phase > selected frd filetype and saved a filename. Now, in REW: Open > Hornresp > Export > selected "all file types" from the drop-down to see my saved frd file > open....and I don't see anything happen...
The cabs were a couple/few feet away from each other during impedance testing. Should I isolate them more?
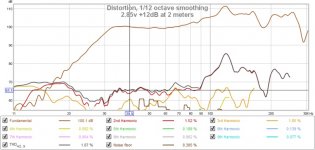
The highest I tested that day was 2.85v +12dB. Perhaps I can drive it harder this coming afternoon. Here's a distortion plot taken from 2 meters:
Attachments
Last edited:
So that's how you import HR data - thank you!
I'm having a bit of trouble thought. Bare with me. I went to Acoustical Power > File > Export > SPL + Phase > selected frd filetype and saved a filename. Now, in REW: Open > Hornresp > Export > selected "all file types" from the drop-down to see my saved frd file > open....and I don't see anything happen...
In REW, it's File > Import Frequency Response..
You should see a new "measurement" tab open on the left. Click on "SPL and Phase" to see it.
In REW, it's File > Import Frequency Response..
You should see a new "measurement" tab open on the left. Click on "SPL and Phase" to see it.
Fantastic! Thank you for the immediate assistance.
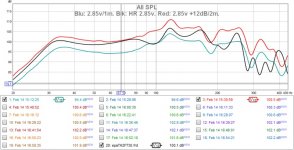
Here is a comparison with 2.85v 1m vs HR 2.85v vs 2.85v +12dB 2m.
Should I maybe consider purchasing a sound level calibrator? I calibrated SPL with slow, C-weighting in REW (to match the SPL meter settings), but the SPL meter also has a "Hi" and a "Low" setting, and REW does not.
Attachments
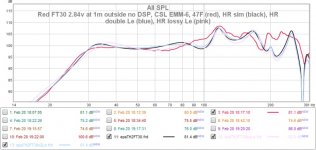
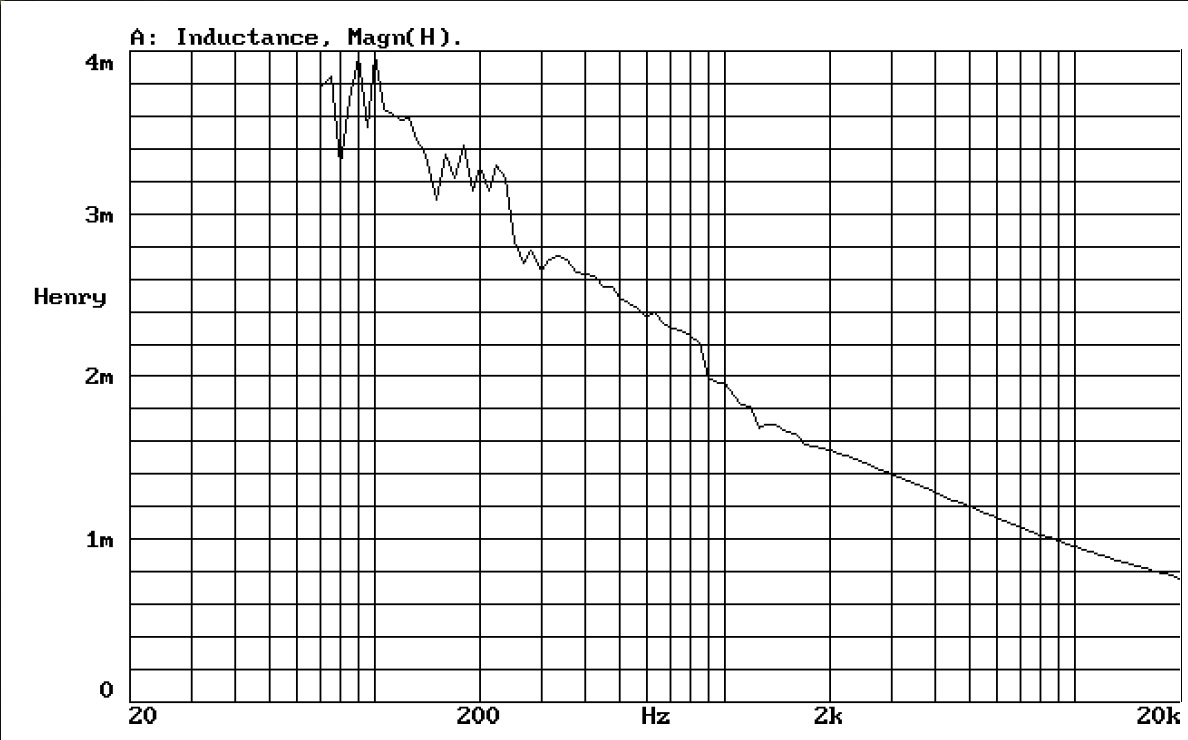
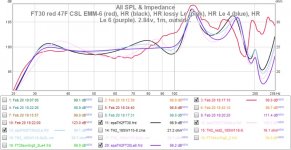
if you double the le value from specs,it match even better(dip @100).
le rizes below 100 hz.
with the lossy le feature enabled ,the sim seems furter away from measured.
i wonder why its about 3 db less then predicted.
le rizes below 100 hz.
with the lossy le feature enabled ,the sim seems furter away from measured.
Should I maybe consider purchasing a sound level calibrator? I calibrated SPL with slow, C-weighting in REW (to match the SPL meter settings), but the SPL meter also has a "Hi" and a "Low" setting, and REW does not.
i wonder why its about 3 db less then predicted.
I calibrated SPL with slow, C-weighting in REW (to match the SPL meter settings), but the SPL meter also has a "Hi" and a "Low" setting, and REW does not.
I'm not sure I follow that. REW has its own SPL calibration routine, to be used with the mic that you're using to measure FR. Once you've run through that routine, anything recorded by the mic should be displayed at the correct SPL level in REW.
Based on the measurements you've shown, does the lowest resonance frequency match the one that was predicted by the Hornresp sim? If not, you might need to adjust the sim a bit to be a more accurate reflection of the build. This will in turn impact the predicted SPL level, but I doubt that effect will be as much as 3dB.
EPA has made a good suggestion about adjusting Le as well, but I'd be tempted to go the whole way and do a t/s parameter measurement (REW can do this as well, but you'll have to put together an impedance measuring jig to do it).
I suggest exporting the impedance curve from Hornresp and from DATS, and importing those into REW for comparison purposes too. The Hornresp curve should show higher peaks (Hornresp does not include the impact of box losses in the sim), but the peaks should be in the same location (I suspect the lowest frequency peak will look slightly different, but that seems to be par for the course) and there should be any ripples or peaks in the measured impedance curve that don't show up also in the Hornresp sim'd impedance curve.
Note that Hornresp does not by default include the impedance of your speaker leads, so you've got to take into consideration their impact on the response curve as well. Measuring the impedance of your leads and adjusting the sim accordingly (Set Rg to the impedance of the speaker leads) could bring the sim into even closer correlation with the measurement.
Concerning the distortion measurements, I think these can be used as a guide to determine the best HP filter to be used with the TH, or dynamic EQ if that's available via DSP. If you set the goal of setting the distortion below the lowest resonance frequency to be the same or less than the distortion within the passband, then you can use the REW measurements to assist with this. I do suggest using shorter sine sweeps when testing at higher power levels though. Oh, and I normally just look at the 2nd and 3rd harmonics. If the box is well-built (no flapping or unglued parts) and the driver is working well, the higher-order harmonics should be pretty low in level and not worth worrying about for a bass speaker that's going to be part of a full-range system. BTW, that rise in distortion just above 100 Hz is a bit ...curious. Was the bottom of the TH sitting flat on your driveway's surface, or do you have any pads installed below the TH? That last time I saw something like that, I found a pebble trapped between the bottom of the TH and where it was sitting on the driveway - it totally screwed up the distortion measurements.
Finally, if you only use the THs up to 115 Hz, limiting the sweep to 250 Hz and below would likely be less annoying to your neighbours 🙂
Again, nice work. It's nice to see actual measurements of a DIY build. Can you provide a link to the final Hornresp and actual cut-sheet that you used for the build?
with the lossy le feature enabled ,the sim seems furter away from measured.
Now this is very interesting. More so to me than the difference between predicted and measured SPL, which can be caused by a number of factors. I do have my concerns about relying too much on the lossy Le model. But then again I try to avoid using high Le drivers in my builds so...
Fantastic! Thank you for the immediate assistance.
Here is a comparison with 2.85v 1m vs HR 2.85v vs 2.85v +12dB 2m.
Should I maybe consider purchasing a sound level calibrator? I calibrated SPL with slow, C-weighting in REW (to match the SPL meter settings), but the SPL meter also has a "Hi" and a "Low" setting, and REW does not.
Good job on the measurements.
If you are interested in an SPL calibrator I can recommend one from China called the ND9. Just do an Ebay search for ND9 calibrator. I have 2 and they have been issue free and reliable. They both matchup within 0.4dB of my big money ACO and GRAS units. Out of the reasonable cost units these are what I'd recommend over the Galaxy or other offerings. I have found that using mic sensitivity specs are ok for getting in the ballpark, but aren't always reliable.
The differences in your response shape vs the sim may be driver related (inductance or other) or not. It is possible that the HR inputs to sim the cabinet may not be ideal also. It may be both. I have just revisited the Skhorn HR sim. It has always been quite a ways off from the measurements and the Akabak sim. Turns out that by looking at the cab design and the HR sim I placed S3 and S4 in areas which did not most accurately reflect the cab design with the limited # of segments available. It's much closer now.
I measured all four FT30s separately yesterday to see how close they perform to one another. Each cab was standing upright on top of 1/2" thick foam "sheet" to minimize ground debris under cab from interfering with measurements. They all measured very close to one another (within 1dB up to the end of the measurement sweep, 200Hz). Note: I ended the process with measuring a different cab than the other day and that cab ("Red") is the subject under test for the following results.
This time I calibrated SPL at 100Hz, instead of 60Hz like last time (I prefer not to use the subwoofer calibration noise inside REW (band-limited pink noise, I assume), as the level fluctuates a lot, due to the dynamic range of the noise (sines provide a constant tone). Even though REW was set to C-weighting last time (like the SPL meter was), I figured there would be less chance of attenuation difference with the SPL meter at 100Hz. Looks like it proved to be more accurate. The handheld SPL meter seemed even less accurate at lower SPL (e.g. at my table, ~25' from the sub mouth when driving the system with 2.84v) - so, I calibrated SPL around 78dB at 1 meter distance. The handheld SPL meter was set to Slow, Hi (60-130dB), C-weighted. REW was set to Slow, C-weighted. Last time the SPL meter was set to Slow, *Low* (30-100dB), C-weighted and calibration was set in the low 70s. That Hi/Low setting seems to have cause some trouble last time.
It was a little chilly last night (started at 47*F) and ended a few degrees colder. Next time I'd like to get the driver(s) warmed up to actual performance temps (120-140F measured w/IR thermometer right next to VC port at hottest point) and take measurements again.
I've attached a 1m measurement at 2.84v (red) comparing it to the HR sim with published specs at 2.84v into 8 ohms (black), an HR sim with double+ Le (4mH) (blue) and an HR sim with lossy Le (pink).
Hi Brian - REW provides a calibration noise (band limited for sub or top speaker) for calibration -or- (as I recently discovered) you can run REW's Signal Generator at your desired output/frequency and select "calibration" from REW's SPL meter function. You are then instructed to enter an external SPL Meter's reading into REW. REW's SPL Meter has options for weighting (Z, C & A), Slow (1s) or Fast (125ms) and an on/off 8Hz HPF. The handheld SPL Meter I used also has a Hi/Low button. It suggests using "Hi" to measure 60-130dB and "Low" to measure 30-100dB. But, when a noise/tone is played at an amplitude in the area which both settings cover (60-100dB), both settings read differently - so, it's difficult to really know which is correct for calibrating around 78dB, if going off of the handheld SPL Meter's guide. And REW does not have the Hi/Low option.
HR shows impedance minima at 30.51Hz. DATS shows impedance minima at 29.6-7ishHz.
DATS impedance measurement, HR impedance sim w/standard driver & HR impedance sim w/Le=4mH attached below.
Second from the lowest HR peak is centered at ~39Hz; DATS measured ~38.3Hz.
I think that's supposed to read "shouldn't* be any ripples"^^
I do see rippling. DATS measurements also don't seem to replicate identical results again and again (with T/S or impedance), even when taken seconds from the last measurement. They're quite close, but not the same/exact. I also want to measure at a higher drive level than DATS allows. Maybe Scott's device is where I'll look to next.
Just measured the speaker lead resistance. Multimeter shows 0.2 ohms from Neutrik speakon connector to connector. 25' of 12AWG cable in between. I've included an image attachment of the HR sims, including standard Le and double (really 4mH) below.
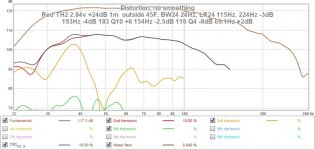
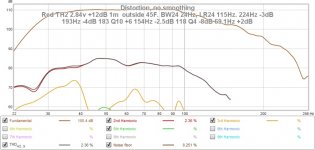
Thanks for the suggestions! It very well could have been a pebble/debris or even a loose rubber foot. I've set the sub on top of a sheet of foam about 1/2" thick this time. Distortion results for 2.84v, +12dB w/DSP and +24dB w/DSP are attached.
Cut sheet is in post #773. HR export record is attached below.
Hi Josh,
Thanks for the suggestion. I found your recommended calibrator on eBay. Looks like it'd take over a month to reach me. I found a supplier selling that model through Amazon with a 2-day delivery time for Prime members. It appears I may have found a way to calibrate the SPL quite a bit closer. However, the calibrator is still in my Amazon cart - just in case.
[Your Skhorn looks quite interesting. I have four new 21DS115-8 drivers that I wanted to make baffles for to install them in these cabs I'm measuring, as they model as if this cab was designed for them - response is quite flat and excursion is very much under control. I later found the Skhorn to be a possible home. I have some other ideas, but I haven't decided where exactly they'll go yet.]
Maybe tomorrow or the next day I'll have time to heat up the current drivers a bit and do various measurements after that.
This time I calibrated SPL at 100Hz, instead of 60Hz like last time (I prefer not to use the subwoofer calibration noise inside REW (band-limited pink noise, I assume), as the level fluctuates a lot, due to the dynamic range of the noise (sines provide a constant tone). Even though REW was set to C-weighting last time (like the SPL meter was), I figured there would be less chance of attenuation difference with the SPL meter at 100Hz. Looks like it proved to be more accurate. The handheld SPL meter seemed even less accurate at lower SPL (e.g. at my table, ~25' from the sub mouth when driving the system with 2.84v) - so, I calibrated SPL around 78dB at 1 meter distance. The handheld SPL meter was set to Slow, Hi (60-130dB), C-weighted. REW was set to Slow, C-weighted. Last time the SPL meter was set to Slow, *Low* (30-100dB), C-weighted and calibration was set in the low 70s. That Hi/Low setting seems to have cause some trouble last time.
It was a little chilly last night (started at 47*F) and ended a few degrees colder. Next time I'd like to get the driver(s) warmed up to actual performance temps (120-140F measured w/IR thermometer right next to VC port at hottest point) and take measurements again.
if you double the le value from specs,it match even better(dip @100).
le rizes below 100 hz.
with the lossy le feature enabled ,the sim seems furter away from measured.
i wonder why its about 3 db less then predicted.
I've attached a 1m measurement at 2.84v (red) comparing it to the HR sim with published specs at 2.84v into 8 ohms (black), an HR sim with double+ Le (4mH) (blue) and an HR sim with lossy Le (pink).
I'm not sure I follow that. REW has its own SPL calibration routine, to be used with the mic that you're using to measure FR. Once you've run through that routine, anything recorded by the mic should be displayed at the correct SPL level in REW.
Hi Brian - REW provides a calibration noise (band limited for sub or top speaker) for calibration -or- (as I recently discovered) you can run REW's Signal Generator at your desired output/frequency and select "calibration" from REW's SPL meter function. You are then instructed to enter an external SPL Meter's reading into REW. REW's SPL Meter has options for weighting (Z, C & A), Slow (1s) or Fast (125ms) and an on/off 8Hz HPF. The handheld SPL Meter I used also has a Hi/Low button. It suggests using "Hi" to measure 60-130dB and "Low" to measure 30-100dB. But, when a noise/tone is played at an amplitude in the area which both settings cover (60-100dB), both settings read differently - so, it's difficult to really know which is correct for calibrating around 78dB, if going off of the handheld SPL Meter's guide. And REW does not have the Hi/Low option.
Based on the measurements you've shown, does the lowest resonance frequency match the one that was predicted by the Hornresp sim? If not, you might need to adjust the sim a bit to be a more accurate reflection of the build. This will in turn impact the predicted SPL level, but I doubt that effect will be as much as 3dB.
HR shows impedance minima at 30.51Hz. DATS shows impedance minima at 29.6-7ishHz.
EPA has made a good suggestion about adjusting Le as well, but I'd be tempted to go the whole way and do a t/s parameter measurement (REW can do this as well, but you'll have to put together an impedance measuring jig to do it).
I suggest exporting the impedance curve from Hornresp and from DATS, and importing those into REW for comparison purposes too. The Hornresp curve should show higher peaks (Hornresp does not include the impact of box losses in the sim), but the peaks should be in the same location (I suspect the lowest frequency peak will look slightly different, but that seems to be par for the course) and there should be any ripples or peaks in the measured impedance curve that don't show up also in the Hornresp sim'd impedance curve.
DATS impedance measurement, HR impedance sim w/standard driver & HR impedance sim w/Le=4mH attached below.
Second from the lowest HR peak is centered at ~39Hz; DATS measured ~38.3Hz.
I think that's supposed to read "shouldn't* be any ripples"^^
I do see rippling. DATS measurements also don't seem to replicate identical results again and again (with T/S or impedance), even when taken seconds from the last measurement. They're quite close, but not the same/exact. I also want to measure at a higher drive level than DATS allows. Maybe Scott's device is where I'll look to next.
Note that Hornresp does not by default include the impedance of your speaker leads, so you've got to take into consideration their impact on the response curve as well. Measuring the impedance of your leads and adjusting the sim accordingly (Set Rg to the impedance of the speaker leads) could bring the sim into even closer correlation with the measurement.
Just measured the speaker lead resistance. Multimeter shows 0.2 ohms from Neutrik speakon connector to connector. 25' of 12AWG cable in between. I've included an image attachment of the HR sims, including standard Le and double (really 4mH) below.
Concerning the distortion measurements, I think these can be used as a guide to determine the best HP filter to be used with the TH, or dynamic EQ if that's available via DSP. If you set the goal of setting the distortion below the lowest resonance frequency to be the same or less than the distortion within the passband, then you can use the REW measurements to assist with this. I do suggest using shorter sine sweeps when testing at higher power levels though. Oh, and I normally just look at the 2nd and 3rd harmonics. If the box is well-built (no flapping or unglued parts) and the driver is working well, the higher-order harmonics should be pretty low in level and not worth worrying about for a bass speaker that's going to be part of a full-range system. BTW, that rise in distortion just above 100 Hz is a bit ...curious. Was the bottom of the TH sitting flat on your driveway's surface, or do you have any pads installed below the TH? That last time I saw something like that, I found a pebble trapped between the bottom of the TH and where it was sitting on the driveway - it totally screwed up the distortion measurements.
Thanks for the suggestions! It very well could have been a pebble/debris or even a loose rubber foot. I've set the sub on top of a sheet of foam about 1/2" thick this time. Distortion results for 2.84v, +12dB w/DSP and +24dB w/DSP are attached.
Finally, if you only use the THs up to 115 Hz, limiting the sweep to 250 Hz and below would likely be less annoying to your neighbours 🙂
Again, nice work. It's nice to see actual measurements of a DIY build. Can you provide a link to the final Hornresp and actual cut-sheet that you used for the build?
Cut sheet is in post #773. HR export record is attached below.
Good job on the measurements.
If you are interested in an SPL calibrator I can recommend one from China called the ND9. Just do an Ebay search for ND9 calibrator. I have 2 and they have been issue free and reliable. They both matchup within 0.4dB of my big money ACO and GRAS units. Out of the reasonable cost units these are what I'd recommend over the Galaxy or other offerings. I have found that using mic sensitivity specs are ok for getting in the ballpark, but aren't always reliable.
The differences in your response shape vs the sim may be driver related (inductance or other) or not. It is possible that the HR inputs to sim the cabinet may not be ideal also. It may be both. I have just revisited the Skhorn HR sim. It has always been quite a ways off from the measurements and the Akabak sim. Turns out that by looking at the cab design and the HR sim I placed S3 and S4 in areas which did not most accurately reflect the cab design with the limited # of segments available. It's much closer now.
Hi Josh,
Thanks for the suggestion. I found your recommended calibrator on eBay. Looks like it'd take over a month to reach me. I found a supplier selling that model through Amazon with a 2-day delivery time for Prime members. It appears I may have found a way to calibrate the SPL quite a bit closer. However, the calibrator is still in my Amazon cart - just in case.
[Your Skhorn looks quite interesting. I have four new 21DS115-8 drivers that I wanted to make baffles for to install them in these cabs I'm measuring, as they model as if this cab was designed for them - response is quite flat and excursion is very much under control. I later found the Skhorn to be a possible home. I have some other ideas, but I haven't decided where exactly they'll go yet.]
Maybe tomorrow or the next day I'll have time to heat up the current drivers a bit and do various measurements after that.
Attachments
-
epaTH2_FT30.txt1,007 bytes · Views: 103
-
 FT30 red distortion 2.84v +24dB 1m outside 45F. BW24 24Hz, LR24 115Hz. 224Hz -3dB 193Hz -4dB 18.jpg77.2 KB · Views: 164
 -
 FT30 red distortion 2.84v +12dB 1m outside 45F. BW24 24Hz, LR24 115Hz. 224Hz -3dB 193Hz -4dB 18.jpg73.2 KB · Views: 155
 -
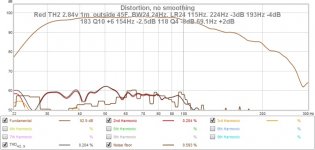 FT30 red distortion 2.84v 1m outside 45F. BW24 24Hz, LR24 115Hz. 224Hz -3dB 193Hz -4dB 183 Q10 .jpg72.9 KB · Views: 154
 -
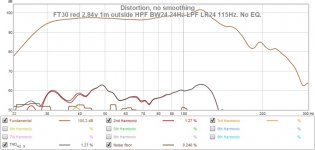 FT30 red distortion 2.84v 1m outside HPF BW24 24Hz LPF LR24 115Hz. No EQ..jpg66 KB · Views: 363
 -
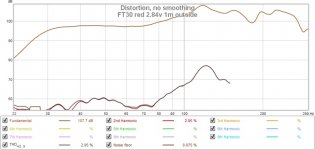 FT30 red distortion 2.84v 1m outside.jpg61.5 KB · Views: 388
 -
 FT30 response outside (red), HR (black), HR Rg=.2 (orange), HR Rg=.2 Le=4mH (green). 1m, 2.84v..jpg106.1 KB · Views: 407
 -
 TH2 Red FT30 2.84v at 1m outside no DSP, 47F CSL EMM-6 (red), HR sim (black), HR double Le (blue.jpg86.4 KB · Views: 169
HR shows impedance minima at 30.51Hz. DATS shows impedance minima at 29.6-7ishHz.
So about a 3% difference. Not too bad at all.
The SPL graph shows a difference of about 1db around the lowest resonance frequency - easily explained by the fact that the Hornresp sim does not include the impact of box losses. That loss of efficiency in the passband between 60Hz and 70Hz is curious, and I've noticed something similar with my POC3 build, which interestingly enough from the front looks a lot like your FT30 (smallish mouth). I'm speculating that this may be due to the impact of the driver's motor sitting in the mouth - something that's not accounted for in the sim. This might also explain the slightly lower resonance frequency too. Logic says that the larger the driver, the larger any effect it will have, if the size of the mouth is kept constant. The POC3 was my second attempt at designing a TH - for my few subsequent attempts, I used Hornresp to set a mouth size that causes the response to vary only slightly if it was decreased by several percent, with the hope that would reduce the impact of the driver's motor on the response.
At higher frequencies your measured results are higher than predicted by the sim. Theoretically that should not be. However I suspect that due to the size of the front panel, perhaps we're seeing the impact of some directivity changes there? Again, something not taken into consideration in the Hornresp sim.
Finally, you mentioned Scott (Hinson)'s box. That's the DIYRM EZI? I can recommend it. I have both DATS and the DEZI. The DATS is easier to use as it requires a much shorter setup time and it's fine for measuring the impedance of many systems, but the DEZI offers a lot more options, like driving the driver at a voltage more representative of actual use and deriving design parameters from that (via REW). The DEZI does take a little more effort to set up, and be very careful that you use a common-ground amp and hook it up correctly - I managed to stupidly release the magic smoke from mine with an incorrect hookup. Luckily it was an easy fix! But once the setup is done you can do impedance and FR measurements by just switching a switch in the DEZI and selecting a different input option in REW - no fiddling around with connections required. I readily recommend it. In fact, with all these cheap chip amps floating around, I wonder if Scott is considering a self-amplified version of it? It would make setup considerably easier... 🙂
excelent measurements.
played wiht the hr sim en found the if you raise le to 5 or 6 mh it wil match even beter.(not saying that is the right way to do it)
can you print an overlay comparison with 5 or 6mh to measured?
played wiht the hr sim en found the if you raise le to 5 or 6 mh it wil match even beter.(not saying that is the right way to do it)
can you print an overlay comparison with 5 or 6mh to measured?
Last edited:
That loss of efficiency in the passband between 60Hz and 70Hz is curious, and I've noticed something similar with my POC3 build, which interestingly enough from the front looks a lot like your FT30 (smallish mouth). I'm speculating that this may be due to the impact of the driver's motor sitting in the mouth - something that's not accounted for in the sim.
I reckon this was part of the design compromise to keep the overall size down, but something I've kept in mind to avoid happening with the next build. Thanks for bringing that up. With the right design, a larger mouth could also raise efficiency.
At higher frequencies your measured results are higher than predicted by the sim. Theoretically that should not be. However I suspect that due to the size of the front panel, perhaps we're seeing the impact of some directivity changes there? Again, something not taken into consideration in the Hornresp sim.
Yes, and one of the things I was aiming to avoid with my previous 2m measurements. I'm thinking I'll likely have to pull back on my subtractive EQ once I'm another meter or three further from the cab face.
Finally, you mentioned Scott (Hinson)'s box. That's the DIYRM EZI? I can recommend it. I have both DATS and the DEZI. The DATS is easier to use as it requires a much shorter setup time and it's fine for measuring the impedance of many systems, but the DEZI offers a lot more options, like driving the driver at a voltage more representative of actual use and deriving design parameters from that (via REW). The DEZI does take a little more effort to set up, and be very careful that you use a common-ground amp and hook it up correctly - I managed to stupidly release the magic smoke from mine with an incorrect hookup. Luckily it was an easy fix! But once the setup is done you can do impedance and FR measurements by just switching a switch in the DEZI and selecting a different input option in REW - no fiddling around with connections required. I readily recommend it. In fact, with all these cheap chip amps floating around, I wonder if Scott is considering a self-amplified version of it? It would make setup considerably easier... 🙂
Yep, that's the one. How hard can you drive the system while using the EZI?
excelent measurements.
played wiht the hr sim en found the if you raise le to 5 or 6 mh it wil match even beter.(not saying that is the right way to do it)
can you print an overlay comparison with 5 or 6mh to measured?
Attached 🙂
I see that it's a bit closer up to 100Hz, but it gets further from measured after ~150Hz.
Attachments
. How hard can you drive the system while using the EZI?
I believe Scott said up to 100W. You don't need to use it anywhere near that high though. I use my own with an amp rated to deliver 25W into 8 ohms.
Next time you're out measuring, try doing a close-miked measurement with the mic about one mouth's diameter or less away from the center of the mouth. Experiment a little with the distance. I'm curious to see if the measured FR at that point is closer to the Hornresp sim.
i see the "problem"Attached 🙂
I see that it's a bit closer up to 100Hz, but it gets further from measured after ~150Hz.
i used a different set of ts parameters.
also there i minor variations in our sims.
S1=422.00
S2=433.00
Par=23.00
S2=433.00
S3=2223.00
Par=322.40
S3=2223.00
S4=2806.00
Par=31.00
yes but minor.Was I maybe using an older version of the cab for comparisons this whole time?
it was the other ts witch messed me up

Hi crescendo & epa,
To me it looks like the response shows evidence of being choked around S2. This can happen when a full cone volume is used in combination with a 90 degree offset loading. You can check this by using the Vtc/Atc function for cone volume and use for S2 the value without the cone volume. In practice for a strong 18" driver like the 18SW115 it usually needs an increase of S2 by about 200 cm^2 to overcome this issue.
Regards,
Djim
hi jim
i am not sure if i interpid it wright.
so i put in another section @ s2 and i got this
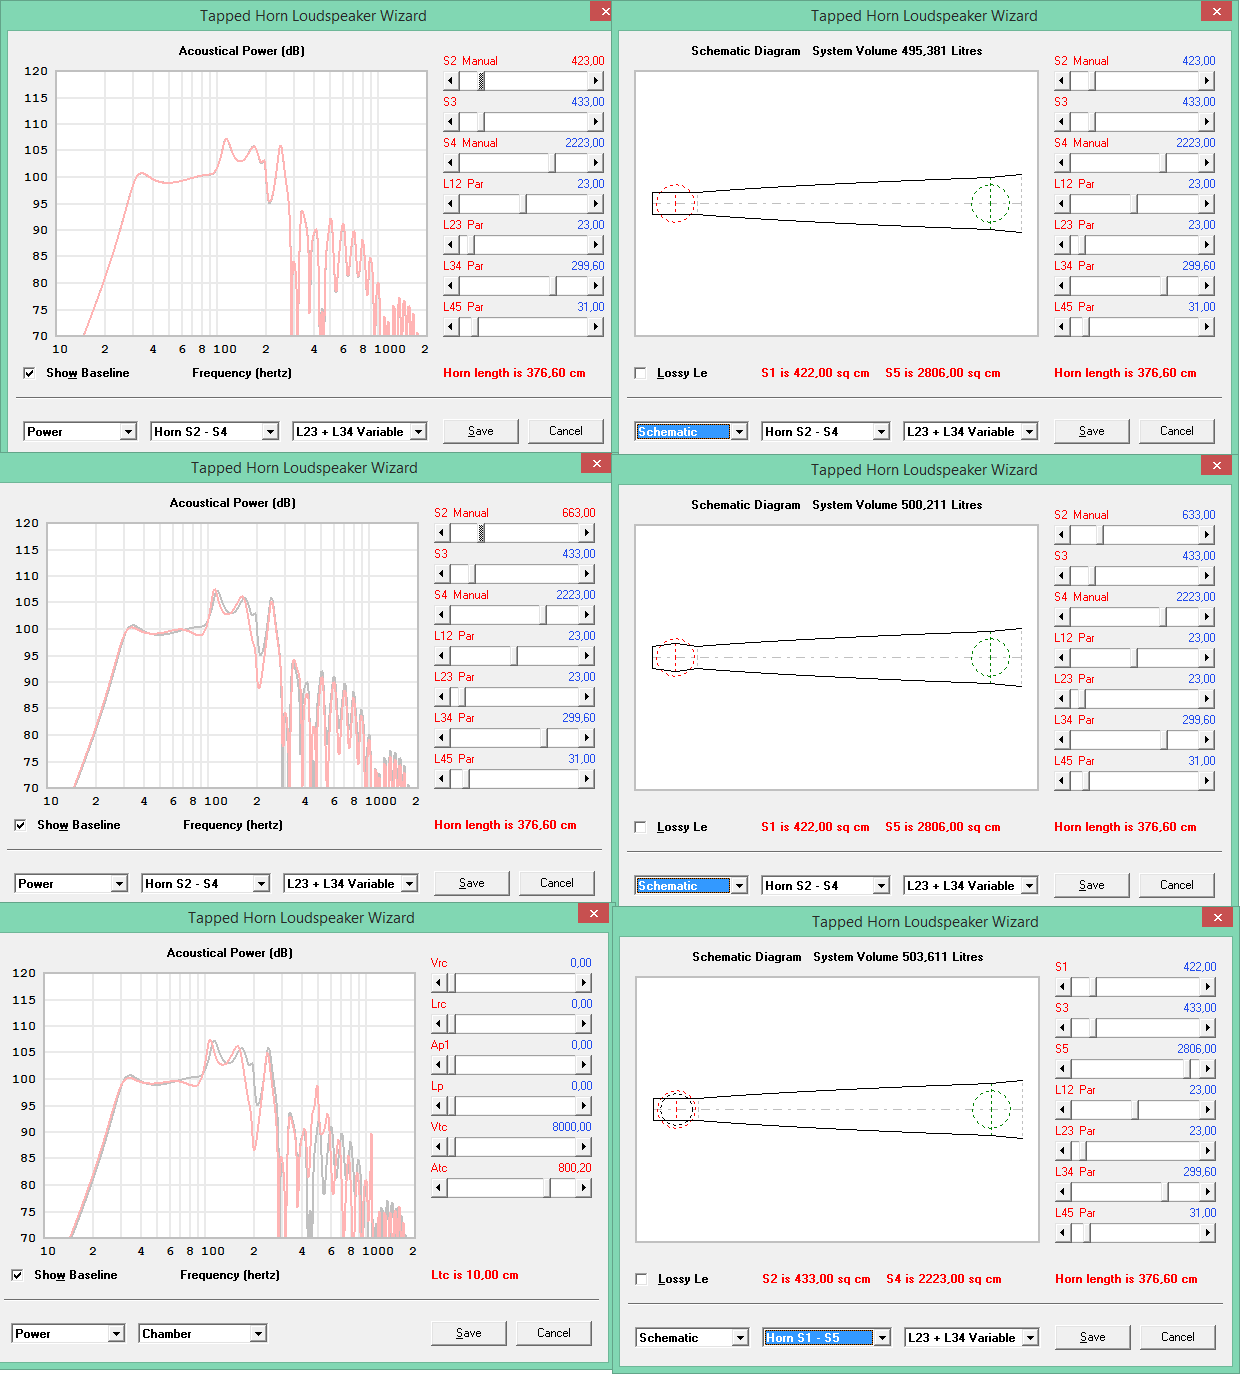
the horn expansion stays the same.le@3.8
normal expansion(in theory with cone corection)
adding cone volume in the horn s2
adding a chamber
i'm just glad there is no dip in real responce 🙂
i am not sure if i interpid it wright.
so i put in another section @ s2 and i got this
the horn expansion stays the same.le@3.8
normal expansion(in theory with cone corection)
adding cone volume in the horn s2
adding a chamber
i'm just glad there is no dip in real responce 🙂
Last edited:
Hi epa,
That's another way of doing it...although...it still seems like the model of post#978 has an opportunistic value in comparison with the measurement ;-)
While the 'filling' around 100Hz is a benefit at low power it remains the question at what costs?! Usually it means lower efficiency down low and a driver that runs sooner into non-linear behaviour. For a driver this strong something in between might be a the better solution...
Anyway, don't get me wrong, it still is a very nice ‘monster bass’ design Erik!
Btw have you heard from Oliver lately?
Regards,
Djim
you mean the 3db difference over the pasband?Hi epa,
That's another way of doing it...although...it still seems like the model of post#978 has an opportunistic value in comparison with the measurement ;-)
i asked the same question here a couple of weeks ago.Btw have you heard from Oliver lately?
Regards,
Djim
i hope he's alright
- Home
- Loudspeakers
- Subwoofers
- C/E/X PA Flat to 30 (FT30) PA TH Awesomeness