Re: Imd
No.
Both generators have well controlled 50ohm output impedances. Simply paralleling the outputs rendered the 19+20KHz test signal. The test signal had all kind of artifacts, mostly intermodulation products...
The 3562A is a dual channel analyzer, that is, it is able to synchronously measure over two channels. Ch1 is measuring the amp input signal and Ch2 is measuring the amp output signal. To avoid the limited dynamic range barrier (80dB) the spectrum is measured in the 10Khz-18KHz frequency span. The amp gain is measured in a separate step, so that the input and output signals can be normalized.
After normalization, the input FFT is substracted from the output FFT (Parseval theorem is at rescue here 🙂 and the result is the amp contribution. After 1024 averages, the noise floor was at around 130dB. Pretty good, given the circumstances.
Originally posted by Edmond Stuart
Hi Ovidiu,
So you didn't use a mixer, right?
No.
I'm not sure what you mean by "direct dual channel ... measurements".
I guess -at the risk of additional IMD inside the signal generators- that you mixed the signals by paralleling the generator outputs (probably via series resistors), right?
Both generators have well controlled 50ohm output impedances. Simply paralleling the outputs rendered the 19+20KHz test signal. The test signal had all kind of artifacts, mostly intermodulation products...
The 3562A is a dual channel analyzer, that is, it is able to synchronously measure over two channels. Ch1 is measuring the amp input signal and Ch2 is measuring the amp output signal. To avoid the limited dynamic range barrier (80dB) the spectrum is measured in the 10Khz-18KHz frequency span. The amp gain is measured in a separate step, so that the input and output signals can be normalized.
After normalization, the input FFT is substracted from the output FFT (Parseval theorem is at rescue here 🙂 and the result is the amp contribution. After 1024 averages, the noise floor was at around 130dB. Pretty good, given the circumstances.
Spectral subtraction technique
Is there any (online) literature about this spectral subtraction technique? I searched the web a little but did not find something more precise about it (or maybe I plainly missed it), except what you have already written here and/or on your website. I would like to implement it in my measurement setup (sound card based), with software (using the FFTW package). Is the main underlying assumption that IF both the inherent distortion of the setup (without DUT) and the DUT distortion is small enough THEN a simple (complex) subtraction of the harmonics in the normalized spectra with/without DUT yields valid results, because the newly generated products will fall below the resulution limit and thus only the main components need to be considered?
Maybe this is worth an extra "low-level distortion measurement" thread, in addition to the Geddes approach (time-domain averaging before FFTing), which works very well for me.
Regards, Klaus
Hi Ovidiu,syn08 said:Finally, direct dual channel (amp input/amp output) measurements and carefully calibrating the channels gains allows (after normalizing the signals) substracting the spectra and extracting the PGP amp contribution.
Is there any (online) literature about this spectral subtraction technique? I searched the web a little but did not find something more precise about it (or maybe I plainly missed it), except what you have already written here and/or on your website. I would like to implement it in my measurement setup (sound card based), with software (using the FFTW package). Is the main underlying assumption that IF both the inherent distortion of the setup (without DUT) and the DUT distortion is small enough THEN a simple (complex) subtraction of the harmonics in the normalized spectra with/without DUT yields valid results, because the newly generated products will fall below the resulution limit and thus only the main components need to be considered?
Maybe this is worth an extra "low-level distortion measurement" thread, in addition to the Geddes approach (time-domain averaging before FFTing), which works very well for me.
Regards, Klaus
Thanks Andy,
At a first look it seems to describe the classic Null test (cancelling the fundamental in the time domain), which is also very powerful... but IMHO not in any way related to the subtraction in the freq. domain which isolates, in the on-screen output, the DUT distortion from the test rig distortion.
- Klaus
Re: Spectral subtraction technique
I'm not aware of any specific resources, related to the audio distortion measurements. The spectral subtraction fundamentals (with application to noise reduction) are here:
http://dea.brunel.ac.uk/cmsp/Home_Esfandiar/Spectral Subtraction.htm
and here is a very good discussion on the error sources:
http://www.ee.bilkent.edu.tr/~signal/defevent/papers/cr1660.pdf
If you have access to the AES library, here's another very good article" "Increasing the Audio Measurement Capability of FFT Analyzers by Microcomputer Postprocessing" Lipshitz, Stanley P. Scott, Tony C. Vanderkooy, John, JAES Volume 33 Number 9 pp. 626-648; September 1985. Essentially, this is what the 3562A is doing internally, also check the 3562A documentation on the Agilent site www.agilent.com
You may find other online resources by googling "spectral subtraction".
KSTR said:
Is there any (online) literature about this spectral subtraction technique?
I'm not aware of any specific resources, related to the audio distortion measurements. The spectral subtraction fundamentals (with application to noise reduction) are here:
http://dea.brunel.ac.uk/cmsp/Home_Esfandiar/Spectral Subtraction.htm
and here is a very good discussion on the error sources:
http://www.ee.bilkent.edu.tr/~signal/defevent/papers/cr1660.pdf
If you have access to the AES library, here's another very good article" "Increasing the Audio Measurement Capability of FFT Analyzers by Microcomputer Postprocessing" Lipshitz, Stanley P. Scott, Tony C. Vanderkooy, John, JAES Volume 33 Number 9 pp. 626-648; September 1985. Essentially, this is what the 3562A is doing internally, also check the 3562A documentation on the Agilent site www.agilent.com
You may find other online resources by googling "spectral subtraction".
syn08 said:
Bob,
I took this opportunity and measured the PGP amp behaviour; no doubts, the PGP amp qualifies as "high feedback" 🙂
The 19KHz signal was generated by a PM5193 function generator, while the 20KHz signal was generated by the HP3562A analyzer. Both signals were 2.600 Vpeak-peak into 50ohm, the PGP gain is measured 28.94dB. Therefore, the output reference (0dB level) was 12.87Veff.
Pretty difficult task mainly because, as also mentioned on the PGP web site, the spectral purity of both test signals and the instruments output stages linearity is pretty poor, resulting in numerous artifacts. Mixing the signals in a AD797, LT1115 or LM4562 did help, but substracting the opamp distortion and noise contributions was very difficult so I gave up this path... Using the Amber 5500 signal (very low distortion) was not an option as well - the 50ohm output stage (I have the high output level option) has a very poor linearity.
Finally, direct dual channel (amp input/amp output) measurements and carefully calibrating the channels gains allows (after normalizing the signals) substracting the spectra and extracting the PGP amp contribution. Averaging was set to 1024 and triggering was always set on the amp input signal.
Here are the results:
F[KHz] Level [dB]
----------------------------------
13 -111.50
14 -105.02
15 -106.23
16 -104.81
17 -110.98
18 -111.42
Unfortunately, the HP3562A spectrum analyzer is limited to 100KHz BW with a frequency span of maximum 50KHz , so I canot measure independently the 19/20KHz single tone 5th harmonic and up. Because of this limitation, I have to admit I am not sure how to interpret the measured absolute values and to correlate them with other measurements. In particular I am not sure how to quatitatively correlate the 18KHz component with the 3rd harmonic single tone measurements (the single tone 20KHz 3rd harmonic measures under -120dB) but looking at the relative values they seem to confirm the hypothesis of creation of new, higher-order distortion products, or increasing those already present. The highest component seems to be related to the 7th harmonic.
Hi Ovidiu,
Interesting measurements, but I'm not sure to make of them. For one thing, it does not seem to compare a no-feedback amplifier with a feedback amplifier. Those distortions could easily be there as a result of the amplifier's output stage, even absent NFB (or in the test setup). Maybe I'm missing something here.
I'll be posting soon some results of simulations I have done with essentially the same complete power amplifier designed with about six different amounts of NFB in the best attempt I could make at some kind of an apples-apples comparison in the simulation world world.
Cheers,
Bob
Thanks, Ovidiu, for the references.
Unfortonately the interesting chapter (appendix E) in the 3562A manual is missing in the version on the agilent website. I'll try to get hold of the AES article which seems to be the essential ressource. Meanwhile, I might try to find my own way to the exact algorithm, using LTSpice (with its .WAV) output as "test rig / DUT" with known behavior.
Regards, Klaus
KSTR said:
Unfortonately the interesting chapter (appendix E) in the 3562A manual is missing in the version on the agilent website.
Here's a short form of Appendix E...
http://www.home.agilent.com/agilent...&lc=eng&ckey=626710&nid=-11143.0.00&id=626710
Bob Cordell said:
Interesting measurements, but I'm not sure to make of them.
Perhaps by adding another line to your graph?
http://www.diyaudio.com/forums/showthread.php?postid=1381560#post1381560
syn08 said:
Perhaps by adding another line to your graph?
http://www.diyaudio.com/forums/showthread.php?postid=1381560#post1381560
Yes, your line on my graph would be impressive, but might not make the point that is at issue.
Cheers,
Bob
Bob Cordell said:
Yes, your line on my graph would be impressive, but might not make the point that is at issue.
Care to explain why couldn't PGP (or any other amp?) be added to the graph? I guess I'm missing something here...
Re: Re: Imd
Hi Ovidiu,
Okay, now I see what you mean by "direct dual channel ... measurements". That wasn't obvious to me, as for distortion measurements down to -120dB and lower, I prefer a sequential procedure (with averaging of course):
1. Measuring the gain and phase of the DUT
2. Measuring the distortion spectrum of the signal generators and analyzer without DUT.
3. Measuring the distortion with DUT, using the same channel of the analyzer and using it at under exactly the same conditions (i.e. the same input voltage to the analyzer, or at least the same voltage applied to the active elements in the analyzer, like amplifying stages, ADC etc. and at the same temperature)
4. Correct the reference spectrum from step 2 for gain and phase of the DUT.
5. And finally, subtracting the result from the spectrum obtained in step 3.
It would be interesting to compare the results of these two procedures, including the levels of the measurement floor.
Cheers, Edmond.
PS: To all, my apologies for posting my comment in not the most appropriate thread.
edit: with subtracting the spectra, I mean subtracting the residuals from each other, not to be confused with "spectral subtraction".
syn08 said:Both generators have well controlled 50ohm output impedances. Simply paralleling the outputs rendered the 19+20KHz test signal. The test signal had all kind of artifacts, mostly intermodulation products...
The 3562A is a dual channel analyzer, that is, it is able to synchronously measure over two channels. Ch1 is measuring the amp input signal and Ch2 is measuring the amp output signal. To avoid the limited dynamic range barrier (80dB) the spectrum is measured in the 10Khz-18KHz frequency span. The amp gain is measured in a separate step, so that the input and output signals can be normalized.
After normalization, the input FFT is substracted from the output FFT (Parseval theorem is at rescue here 🙂 and the result is the amp contribution. After 1024 averages, the noise floor was at around 130dB. Pretty good, given the circumstances.
Hi Ovidiu,
Okay, now I see what you mean by "direct dual channel ... measurements". That wasn't obvious to me, as for distortion measurements down to -120dB and lower, I prefer a sequential procedure (with averaging of course):
1. Measuring the gain and phase of the DUT
2. Measuring the distortion spectrum of the signal generators and analyzer without DUT.
3. Measuring the distortion with DUT, using the same channel of the analyzer and using it at under exactly the same conditions (i.e. the same input voltage to the analyzer, or at least the same voltage applied to the active elements in the analyzer, like amplifying stages, ADC etc. and at the same temperature)
4. Correct the reference spectrum from step 2 for gain and phase of the DUT.
5. And finally, subtracting the result from the spectrum obtained in step 3.
It would be interesting to compare the results of these two procedures, including the levels of the measurement floor.
Cheers, Edmond.
PS: To all, my apologies for posting my comment in not the most appropriate thread.
edit: with subtracting the spectra, I mean subtracting the residuals from each other, not to be confused with "spectral subtraction".
Power Amplifier Distortion vs NFB
There have been claims made that the introduction of negative feedback introduces or exacerbates high-order distortions. Previously in earlier posts it has been shown that for single-stage BJT and FET amplifiers this can be so under a limited set of conditions, usually starting with the introduction of low amounts of NFB on the order of 6-10 dB. These results tracked those of Baxandall. It was also shown that the introduction of NFB via emitter degeneration also had this same property illustrated by Baxandall. Moreover, at higher levels of total negative feedback around a stage, a further increase in NFB would cause a monotonic decrease in distortions of pretty much all orders. The introduction of global NFB around a typically degenerated BJT stage was shown to exhibit the monotonic decrease in all orders of distortion.
Here we make an attempt to show the results for such an experiment for a complete typical power amplifier, including its Class-AB output stage. The details of the amplifier are shown in a later post, but suffice it to say that it uses a dual complementary differential input stage with no current mirrors and employs Darlington VAS stages. The output stage is a Triple using two pairs of ThermalTrak RET transistors in a Class-AB arrangement with 150 mA per pair and looking into a 4 ohm load at a power level of 200W @ 4 ohms.
Using the same topology and transistors, seven versions of this amplifier were designed with amounts of NFB loop gain equal to none, 6dB, 10 dB, 20 dB, 30 dB, 40 dB and 60 dB. In all cases closed loop gain of the amplifier was 30. In all cases with NFB, the amplifier was compensated to have a closed loop bandwidth of 1 MHz.
The results of 20 kHz harmonic distortion simulations are shown in the graph below. Only odd-order distortions of 3rd, 5th, 7th and 9th are shown for clarity. All even order distortions were generally lower and similarly behaved.
Notice that the distortions generally decrease monotonically with the application of increasing negative feedback (an exception is a dip in 7th harmonic distortion between 6 dB and 30 dB NFB that may be due to some cancellation effects).
Also, notice that the decrease in distortion with increasing NFB tends to flatten out above about 40 dB NFB. This is because the closed-loop bandwidth is being held constant, so that, while LF NFB is increasing, the amount of NFB at 20 kHz and above is already at its maximum value (about 34 dB) and being held constant by the feedback compensation.
Cheers,
Bob
Attachments

Power Amp Distortion vs NFB
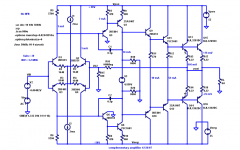
The LTSpice schematic of the amplifier used for the above simulations is shown below. It is a decent amplifier, but nothing special. The version shown is the zero-feedback version. It uses complementary BJT input differential pairs with each tail biased at 2 mA and with simple resistive loads. Emitter degeneration is selected in accordance with the amount of NFB for the particular design version.
The complementary VAS stages are each in a Darlington configuration. VAS emitter resistors R9 and R10, and VAS load resistors R19 and R20, are selected in accordance with the amount of NFB for the particular design version. These resistors, in combination with the input stage degeneration resistors, are selected to achieve a reasonable gain distribution between the first and second stages for each NFB case.
In every case, input stage load resistors R5 and R6 were adjusted so as to achieve a VAS quiescent current of 10 mA.
Conventional Miller compensation capacitors C1 and C2 are selected for each case so as to set the closed loop gain to 1 MHz. They are set essentially to zero for the no-feedback case.
The output stage is a Triple with a healthy 52 mA idle bias in the driver transistors. Two pairs of RET ThermalTrak NJL3281D and NJL1302D power devices are employed. Each pair is biased with an idle current of 116 mA through 0.22 ohm emitter resistors so as to drop 26 mV across each emitter resistor. The amplifier was simulated while putting 40 V p-p at 20 kHz into a 4-ohm load (200W). In all cases the feedback resistor R16 was set to achieve a closed loop gain of 30. The applied dc input offset voltage was adjusted to achieve an output dc offset of less than 1 mV for each case.
Cheers,
Bob
Attachments
Re: Power Amp Distortion vs NFB
Hi Bob,
The value for R7 is wrong for 2ma. Maybe something around 2.4K?
Regards, Mike.
Hi Bob,
The value for R7 is wrong for 2ma. Maybe something around 2.4K?
Regards, Mike.
Re: Re: Power Amp Distortion vs NFB
Good catch, Mike. You're right, those Darlington transistors are actually running at a little over 6 mA. That's not what I intended, must have been a brain lapse. I don't think it invalidates the results, though.
Thanks,
Bob
MikeBettinger said:Hi Bob,
The value for R7 is wrong for 2ma. Maybe something around 2.4K?
Regards, Mike.
Good catch, Mike. You're right, those Darlington transistors are actually running at a little over 6 mA. That's not what I intended, must have been a brain lapse. I don't think it invalidates the results, though.
Thanks,
Bob
Re: Re: Re: Power Amp Distortion vs NFB
I don't think so either. I was just looking at what you were doing and it didn't look right.
Mike.
Bob Cordell said:
Good catch, Mike. You're right, those Darlington transistors are actually running at a little over 6 mA. That's not what I intended, must have been a brain lapse. I don't think it invalidates the results, though.
Thanks,
Bob
I don't think so either. I was just looking at what you were doing and it didn't look right.
Mike.
Re: Re: Re: Re: Power Amp Distortion vs NFB
Thanks again, Mike, for spotting that. Indeed, the current through that Darlinton transistor changes with each version of the amplifier for different values of NFB, since the drop across the emitter resistor of the VAS transistor changes with amount of degeneration (and considerable degeneration is needed for the low-NFB cases). If I had it to do over again, I should have not kept that 470 ohm resistor constant, but rather adjust it for each design.
Cheers,
Bob
MikeBettinger said:
I don't think so either. I was just looking at what you were doing and it didn't look right.
Mike.
Thanks again, Mike, for spotting that. Indeed, the current through that Darlinton transistor changes with each version of the amplifier for different values of NFB, since the drop across the emitter resistor of the VAS transistor changes with amount of degeneration (and considerable degeneration is needed for the low-NFB cases). If I had it to do over again, I should have not kept that 470 ohm resistor constant, but rather adjust it for each design.
Cheers,
Bob
My thought is, I wonder what the differences would be, sonically/measurements, between the various versions?
If one was to layout the basic design with a plug in input stage, each sporting the various FB levels/biasing etc. Would it work and be a fair comparison (measurement and listening)? What am I missing here?
Regards, Mike.
If one was to layout the basic design with a plug in input stage, each sporting the various FB levels/biasing etc. Would it work and be a fair comparison (measurement and listening)? What am I missing here?
Regards, Mike.
MikeBettinger said:My thought is, I wonder what the differences would be, sonically/measurements, between the various versions?
If one was to layout the basic design with a plug in input stage, each sporting the various FB levels/biasing etc. Would it work and be a fair comparison (measurement and listening)? What am I missing here?
Regards, Mike.
Hi Mike,
Good question. I don't think you are missing anything.
In practice, it might be a bit of a challenge to arrange how to plug in the different parts to achieve the different amounts of NFB, since scattered parts in the input stage, VAS, and feedback network are all involved. One might end up by just plugging in a completely different input stage/VAS module. The results would be still intreresting, especially sonically.
It might be even more interesting if the A-B comparisons were done in such a way that the NFB versions had their output impedance padded appropriately so as to maintain the same mid-band damping factor for all the designs (the fact that damping factor can be a function of frequency makes this an approximation at best, of course).
Cheers,
Bob
- Home
- Amplifiers
- Solid State
- Bob Cordell Interview: Negative Feedback