Sorry misunderstood and edited the answer.
Did you delete the answer while editing?
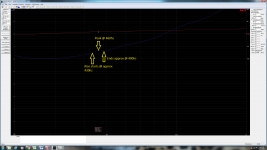
^^Positive DC voltage offset in the input. Or output if loopback.
Kimmosto,
Apologies - but I'm not very technical, so your response above didn't make any sense to me. Will Google it.
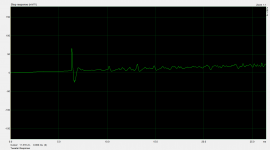
If it helps, I'm using Focusrite Scarlet2i2(Gen1) pre. Input one is connected to Behringer Mic, and input two is a loopback from rear left output (using an RCA/TS 1/4" cable), and the rear right output to a Dayton Audio APA150 amplifier.
Both inputs in the Pre set to "Line" Position, and Direct Monitoring is "Off"
Also - this tilt happens in Single-channel mode as well, though the divergence is in the opposite direction (tilts down)
Last edited:
I thought you were asking why your step response was inverted and wrote my reply before I looked at your graph. Once I saw it wasn't inverted...I assumed you were asking why the tail rose. I didn't know the answer and couldn't delete the post. DC offset makes sense and correct me if I'm wrong but it's more or less just noise. Generally I haven't seen the step used except to show the initial rise and fall of the speakers time coherence. The tail is not generally something I have seen much attention paid to.
Kimmosto,
Apologies - but I'm not very technical, so your response above didn't make any sense to me. Will Google it.
If it helps, I'm using Focusrite Scarlet2i2(Gen1) pre. Input one is connected to Behringer Mic, and input two is a loopback from rear left output (using an RCA/TS 1/4" cable), and the rear right output to a Dayton Audio APA150 amplifier.
Both inputs in the Pre set to "Line" Position, and Direct Monitoring is "Off"
Also - this tilt happens in Single-channel mode as well, though the divergence is in the opposite direction (tilts down)
Kimmo was hinting at a problem related to DC or very-low frequency signal in your measurement setup. You could try to insert a capacitor in the signal line(s) to block the DC (and very-low frequency stuff). However, it might be easier to just tell the software to remove the trend from your data; at least that's what I do what I run into such issues. I don't know if / how this is possible with ARTA.
Another question.
Thanks, Erik. Like you, I never really focus on the tail of the Step response - however, I still thought I post the question just in case it impacts my data in ways that I may not be aware of.
Thanks mbrennwa for also responding.
I do have one more question though. When taking frequency response measurements, will the impulse response of a driver always decay in magnitude until the first reflection is picked up by the mic?
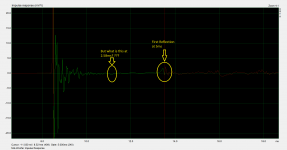
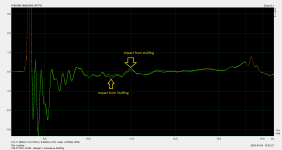
I'm probably not explaining it well so I've attached the image of the impulse response of a mid-woofer (SB17NRXC35-8 on 35cm x 24cm baffle). The mic was placed approximately 73cm from the baffle, and the nearest boundary (ceiling & floor) was 117cm away. These measurement distances compute to a first reflection at 5ms (per VituixCAD) - and that matches perfectly to what I measured. However, I have this small bump at 2.58ms and I have no idea what may be causing that. It's not of the same magnitude as the first reflection, but including it in the gated window does introduce some waviness in the measured response.
Thanks, Erik. Like you, I never really focus on the tail of the Step response - however, I still thought I post the question just in case it impacts my data in ways that I may not be aware of.
Thanks mbrennwa for also responding.
I do have one more question though. When taking frequency response measurements, will the impulse response of a driver always decay in magnitude until the first reflection is picked up by the mic?
I'm probably not explaining it well so I've attached the image of the impulse response of a mid-woofer (SB17NRXC35-8 on 35cm x 24cm baffle). The mic was placed approximately 73cm from the baffle, and the nearest boundary (ceiling & floor) was 117cm away. These measurement distances compute to a first reflection at 5ms (per VituixCAD) - and that matches perfectly to what I measured. However, I have this small bump at 2.58ms and I have no idea what may be causing that. It's not of the same magnitude as the first reflection, but including it in the gated window does introduce some waviness in the measured response.
Attachments
Last edited:
2.58ms correspond to a length of 2.58 ms * 340 m/s = 0.877m.
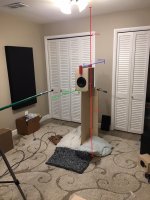
Considering that the pulse travels back and then it is reflected towards the microphone, my guess is that it is reflected to the back panel of the base that supports the enclosure which seems to have a large area. Anyway, look for an object that it is around 0.44m back from the front of the enclosure.
Considering that the pulse travels back and then it is reflected towards the microphone, my guess is that it is reflected to the back panel of the base that supports the enclosure which seems to have a large area. Anyway, look for an object that it is around 0.44m back from the front of the enclosure.
I have this small bump at 2.58ms and I have no idea what may be causing that. It's not of the same magnitude as the first reflection, but including it in the gated window does introduce some waviness in the measured response.
Back panel of the box/enclosure? Baffle edge? Try moving around the speaker+stand (or the microphone) in do different positions in the room. Does the timing of the small bump change? If it does, it's something in the room. If it stays, it's something at/in the speaker itself.
If it's at/in the speaker, try rotating the speaker horizontally or vertically.
I agree with gdan, the support's back panel is likely the culprit.
For comparison measurements, let's try the golden ratio. This in relation to the height (117 cm)
- either move the speaker closer to the wall (72 cm), or further away (189 cm)
-the next number up is 306 cm. This is probably too long. Is the room really wide in one direction?
For comparison measurements, let's try the golden ratio. This in relation to the height (117 cm)
- either move the speaker closer to the wall (72 cm), or further away (189 cm)
-the next number up is 306 cm. This is probably too long. Is the room really wide in one direction?
What's next
So - I tried the following:
1) Changing the amp I'm using
2) Changing the mic-preamp I'm using (Focusrite 2i2 to Solo)
3) Changing to Mic setup I'm using (Behringer ECM8000w/2i2 in ARTA vs. MiniDSP Umik w/Focusrite Solo in REW)
4) Chopping of the width of the rear support from 40cm width to 18cm width
5) Changing mic height
6) Changing mic distance
7) Switching drivers (same enclosure)
None of the above helped. Next, I can try moving the setup to another room.
Didn't help with the sloping trend or with the 2.58 ms bump?
Sloping trend: let's say you don't have an electronics issue, since you swapped out the microphone and the mic pre. Is it possible you have some low-frequency noise in your measurement room? Washing machines or air conditioning may be a problem.
As I wrote before, the easiest fix would be to remove the sloping trend in the software.
2.58 ms bump: if changing the geometry of the measurement setup does not change the bump, then the bump is coming from your speaker. From looking at your photo, I'd guess the height of the box is approximately 40 cm, which might match the estimate given by gdan in post 950. The bump might show a reflection of the impulse between the top and the bottom of the enclosure. Try stuffing the box with (a lot) of wool or polyfil and see if this changes the bump.
Also, you could measure the impedance curve of the speaker. Do you see a bump at 1/2.58ms = 387 Hz?
New measurement - new driver/cabinet
Thanks, mbrewnnwa.
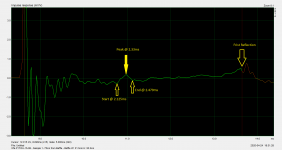
Here are the measurements of another speaker. This one seems to have a peak at 2.33ms.
The driver is a Vifa P17WJ-15-08 (a craigslist purchase) mounted on a 21.5cm wide by 35.3cm tall baff, with the vertical edges rounded 18mm radius.
Mic placed 75cm from baffle - directly centered on the driver under measurement.
I've also included the measured impedance, which indicated a slight "bump" centered around 460hz (starting at 430hz, ending at 490hz). I'm not sure if this has to do with an air leak since it was a quick build to see driver performance given the baffle dimensions.
Excessively stuffing the enclosure does seem to impact the area under question - see attached pictures.
Any additional thoughts? Thanks for helping
Thanks, mbrewnnwa.
Here are the measurements of another speaker. This one seems to have a peak at 2.33ms.
The driver is a Vifa P17WJ-15-08 (a craigslist purchase) mounted on a 21.5cm wide by 35.3cm tall baff, with the vertical edges rounded 18mm radius.
Mic placed 75cm from baffle - directly centered on the driver under measurement.
I've also included the measured impedance, which indicated a slight "bump" centered around 460hz (starting at 430hz, ending at 490hz). I'm not sure if this has to do with an air leak since it was a quick build to see driver performance given the baffle dimensions.
Excessively stuffing the enclosure does seem to impact the area under question - see attached pictures.
Any additional thoughts? Thanks for helping
Attachments
Also, you could measure the impedance curve of the speaker. Do you see a bump at 1/2.58ms = 387 Hz?
mbrennwa,
I just measured another small speaker cabinet with an Aura NS3.
The measured impulse had a small bump around 2.354ms.
When I measured the impedance, there was a bump at 424hz.
If I take 1/2.354ms ---that calculates out to be exactly 424.8hz.
That is right on the money with the impedance bump. That is very interesting.
What does that mean? I guess I'm asking how did you know to ask about the 1/(bump timing) and then checking the impedance curve to see if there is a corresponding bump at that frequency. What were you suspecting?
Lastly - I just measured a pair of Dennis Murphy - Philharmonica Affordable Accuracy Monitors - I found no odd bump in the Impulse Response (at least I wasn't able to pick it out if it was in there somewhere). Coincidently, I measured the impedance and there were no anomalies (i.e. bumps) observed.
Last edited:
mbrennwa,
I just measured another small speaker cabinet with an Aura NS3.
The measured impulse had a small bump around 2.354ms.
When I measured the impedance, there was a bump at 424hz.
If I take 1/2.354ms ---that calculates out to be exactly 424.8hz.
That is right on the money with the impedance bump. That is very interesting.
What does that mean? I guess I'm asking how did you know to ask about the 1/(bump timing) and then checking the impedance curve to see if there is a corresponding bump at that frequency. What were you suspecting?
Lastly - I just measured a pair of Dennis Murphy - Philharmonica Affordable Accuracy Monitors - I found no odd bump in the Impulse Response (at least I wasn't able to pick it out if it was in there somewhere). Coincidently, I measured the impedance and there were no anomalies (i.e. bumps) observed.
Since the bump did not change when you changed the positions of the microphone and the speaker relative to each other and relative to the room, it's clear that the bump is related to something happening in the speaker itself.
The bump looks like a reflection of the main impulse, and it arrives with a delay of 2.58 ms (in your first example). If you apply a periodic signal with a frequency of f = 1/2.58 ms = 387 Hz, you will get a resonance. This is why you see a bump in the impedance curve at this frequency.
Since the additional stuffing material reduced the bump (both in the impulse response and in the impedance curve) we know that the resonance is happening inside the enclosure. I am pretty sure it's either a standing wave between the top and the bottom of the box, or a reflection at the rear wall of the enclosure. What are the internal dimensions of your box (in the first example with the 2.58 ms delay)?
Last edited:
Internal Dimensions
The Speaker's internal dimensions are roughly 31.8cm tall, 16.8cm wide and 26.5cm deep.
I am pretty sure it's either a standing wave between the top and the bottom of the box, or a reflection at the rear wall of the enclosure. What are the internal dimensions of your box (in the first example with the 2.58 ms delay)?
The Speaker's internal dimensions are roughly 31.8cm tall, 16.8cm wide and 26.5cm deep.
0.318m / 2.58 ms / 2 = 247 m/s
Hmmm, this is rather low. I would not be surprised to find a value slightly less than the speed of sound in free air (340 m/s) due to the stuffing. But so low?
Hmmm, this is rather low. I would not be surprised to find a value slightly less than the speed of sound in free air (340 m/s) due to the stuffing. But so low?
Hello. There are several measurement questions in ARTA. I am making IR measurements of several speakers in a speaker enclosure. Then to upload to VituixCAD for analysis.
1. To measure the impulse response of the speakers in the speaker housing, at what distance should the microphone be?
I put on the axis of the tweeter at a distance of 1 m from the tweeter.
2. To measure the IR of each speaker, the microphone must remain in one position? That is, on the axis of the tweeter 1m from him.
3. How to get the window on the IR chart?
I do this, but not sure what is right.
4. If you take measurements from 3 m - this is the listening point, I will get a lot of reflections. But they can not be included in the window. So maybe it’s more accurate to take measurements with 3 meters?