Should be not problem in XP. Do you have file extentions turned on? If not, try this:It is easy to do with anything beyond Windows XP but not so easy with Windows XP.
- Open any folder (like My Documents).
- At the top click on Tools
- Click on Folder Options
- Go to the View tab
- Uncheck Hide extensions for known file types
- Click OK
Now you should be able to see and change all file extensions.
Ivo,
I like ARTA very much. I especially like its CSDs and FR Magnitude graphs that include Distortion measurements. I've used REW for the past 3 years and like it, too, but its waterfalls cannot compete with ARTA's. In addition, REW distortion measurements are very difficult to generate.
Functions in REW that I miss in ARTA:
1. REW's ability to save from 1 to 30 measurements during a measurement session. Each measurement can make use of all REW graphing functions such as FR, Waterfall, Spectrogram, GD, IR, etc. This makes it easy to make rapid "head-to-head" comparisons. Equally valuable, the entire set of up to 30 measurements can be named as a group and their .mdat data files saved for later loading and re-analysis. Furthermore, REW will Average and Graph a series of FR measurements which can be important to control for measurement variance.
2. REW 'Preferences' make adjusting the FR Magnitude graph to 0 dB (or wherever you want it set) much easier than in ARTA. In REW, all you have to do is Select the Gear preferences icon, enter the desired Offset, and press 'Add to data.'
3. Changing the SPL resolution is also made very easy in REW. Simply clicking the + or the - buttons at the top left of the graph adjusts the resolution from 20 dB increments to 10, 5, 1, and fractions of 1 dB.
4. Graph parameters are easily made by selecting the graph parameters and limits tabs at the top of each graph.
5. "Check Levels" function carried out before making a measurement. This makes it easy to "dial in" the SPL needed for reliable and standardized measurements of speakers (in my case, headphones) with different impedances.
6. REW makes it very easy to "Capture," name, and save any graph by pressing the "capture" button at the top left of each graph. There's no need to paste it since you can directly name and save to file on your PC.
Adding these functions to ARTA would make your great program even better, IMO.
Thank you for your consideration.
Last edited:
Great product, thanks.
What I miss is pseudo-3D directivity pattern diagrams. For example, I would take multiple round-table measurements placing mic at different heights in respect to loudspeaker. Then specify these heights relative to ear-height (null) while performing multiple import batches. Then to get 3D view of the dispersion as a function of frequency as cut-through 3Dfigures of polar plots or even multi-colored sonogram visualized within cylinder-shaped frame.
The purpose? IMO vertical dispersion (often neglected) matters as much as horizontal.
Sure, I can measure loudspeaker vertical directivity by placing it on its side, still much of the information is lost (especially oblique dispersion away from loudspeaker corners). Overall dispersion pattern would be hard to visualize this way as two transverse 2D visualizations must be imagined forming one that is 3D.
Jānis
Should be not problem in XP. Do you have file extentions turned on? If not, try this:
- Open any folder (like My Documents).
- At the top click on Tools
- Click on Folder Options
- Go to the View tab
- Uncheck Hide extensions for known file types
- Click OK
Now you should be able to see and change all file extensions.
Thanks, Pano. Worked like a charm.
Jay
ARTA features requests and forum discussion
Thanks to all that gives me suggestion for new features.
I shall take all suggestion into the consideration, but I prefer that you send me requests by mail.
Forum is not good place for such kind of discussion.
Simply, there are many factors - functional and programming, that I can not predict in fast reply.
Also, I don't want to discuss solution from other programs - especially those that I have not tried.
Best,
Ivo
OK if you want, Ivo. But I think you are missing a goldmine here. Many people have tried other programs and found features that work well (or do not). Although you can't chase down every one of these, you can learn a lot from what people find useful in other software. We can be your eyes and ears. 😉
 Glad to help.
OK if you want, Ivo. But I think you are missing a goldmine here. Many people have tried other programs and found features that work well (or do not). Although you can't chase down every one of these, you can learn a lot from what people find useful in other software. We can be your eyes and ears. 😉
I said that I will not discuss suggestions for future features of ARTA on forum, but I am open to receive all suggestions, as I was all these years on Visaton forum, and many of ARTA features have come from Visaton forum requests.
I am not engaged full time on ARTA development - and I am not always prepared for thorough discussion. I like to have more time when I work on new features.
Best,
Ivo
New Features in ARTA
I can confirm Ivo's statement regarding the Visaton forum 1:1.
With appropriate arguments, patience and tenacity a lot has already been realized.
Regards
Heinrich
Btw: Fabian ..... 😉
I can confirm Ivo's statement regarding the Visaton forum 1:1.
With appropriate arguments, patience and tenacity a lot has already been realized.
Regards
Heinrich
Btw: Fabian ..... 😉
One more to add to my ARTA "wish list."
Click anywhere on the CSD (a peak or a null) and ARTA will "mark" the frequency and display its dB; i.e. a yellow line extends from 0.0 ms at the top of the Z axis to the windowed time limit and then drops vertically to the X axis.
Click anywhere on the CSD (a peak or a null) and ARTA will "mark" the frequency and display its dB; i.e. a yellow line extends from 0.0 ms at the top of the Z axis to the windowed time limit and then drops vertically to the X axis.
hi ivo
what is the calculation of the voltage probe.?
i have an input impendance of 16 k.ohm
with my limited knowldge i calculated 15.5 kohm and 522 ohm for -30 db att?
tnx
what is the calculation of the voltage probe.?
i have an input impendance of 16 k.ohm
with my limited knowldge i calculated 15.5 kohm and 522 ohm for -30 db att?
tnx
Last edited:
Your calculation is correct. If the shunt resistor (in your case 522 ohms) is much smaller than your soundcard input resistance, then the soundcard input resistance doesn't really alter the attenuation pad value.
Dave.
Dave.
Jitter rms value
Hi Ivo,
I had a look at Audio Precision Technote 23.
On page 10 the relationship between double jitter sidebands and rms jitter in ns is given by Julian Dunn:
"For convenience, the formula can be modified by
summing the levels in both sidebands to give a total error,
and using rms jitter levels, Jn , in nanoseconds and
frequency, fi, in kHz:
Rdsb = 20 log10 (Jn * fi) - 104 dB. (9)"
As I understand it e.g. for a jitter frequency of 10khz with an rms jitter of 1ns, the summing of both sidebands gives a level of -84dB.
But this is only for the two side bands.
I am asking myself how I get the the total jitter if I record a noise spectrum of the DUT with a J-Test excitation (I know the spectrum contains also normal noise of the DUT, noise of the sound card, ADC jitter of the soundcard,.... But it is an upper limit.)
If I want to have the total jitter would be an appropriate procedure to do the following?
1. Use e.g. J-test 24-44.1 test signal for the DUT. (The side bands corresponding to a 24bit J-test signal are so low that they are buried in the noise floor and can be neglected.)
2. Record the result in Spectrum Mode (Kaiser7).
3. Export the result as file, e.g. as csv into Excel.
4. Normalize the data in Excel such that the excitation is at 0dB.
5. Remove the data at 11025Hz (and maybe a few Hz below, to get rid of the excitation signal) and remove the data above 11025 Hz from the Excel file (because the formula above cares for 2 sidebands).
6. Replace for each frequency the db values in the Excel file by rms jitter level (by rearringing the formula above to calculate Jn).
6. Integrate this over the range 0 to a bit less than 11025 (by Excel operation).
7. The integral corresponds to the total jitter in rms (relative to the band 0 Hz to 22050 Hz).
Does this make sense?
Best regards,
Uwe
Uwe,
please download Audio precision application note AN-23.
To find it just google: julian dunn jitter theory
Ivo
Hi Ivo,
I had a look at Audio Precision Technote 23.
On page 10 the relationship between double jitter sidebands and rms jitter in ns is given by Julian Dunn:
"For convenience, the formula can be modified by
summing the levels in both sidebands to give a total error,
and using rms jitter levels, Jn , in nanoseconds and
frequency, fi, in kHz:
Rdsb = 20 log10 (Jn * fi) - 104 dB. (9)"
As I understand it e.g. for a jitter frequency of 10khz with an rms jitter of 1ns, the summing of both sidebands gives a level of -84dB.
But this is only for the two side bands.
I am asking myself how I get the the total jitter if I record a noise spectrum of the DUT with a J-Test excitation (I know the spectrum contains also normal noise of the DUT, noise of the sound card, ADC jitter of the soundcard,.... But it is an upper limit.)
If I want to have the total jitter would be an appropriate procedure to do the following?
1. Use e.g. J-test 24-44.1 test signal for the DUT. (The side bands corresponding to a 24bit J-test signal are so low that they are buried in the noise floor and can be neglected.)
2. Record the result in Spectrum Mode (Kaiser7).
3. Export the result as file, e.g. as csv into Excel.
4. Normalize the data in Excel such that the excitation is at 0dB.
5. Remove the data at 11025Hz (and maybe a few Hz below, to get rid of the excitation signal) and remove the data above 11025 Hz from the Excel file (because the formula above cares for 2 sidebands).
6. Replace for each frequency the db values in the Excel file by rms jitter level (by rearringing the formula above to calculate Jn).
6. Integrate this over the range 0 to a bit less than 11025 (by Excel operation).
7. The integral corresponds to the total jitter in rms (relative to the band 0 Hz to 22050 Hz).
Does this make sense?
Best regards,
Uwe
on Jitter
Hi Uwe,
It is not good to sum all spectrum components, as they do not came from jitter.
A Dunn simple example on last page of TN23 is enough.
- Record Jtest response with large sequence and averaging
- Find largest sideband, increase by 3dB and apply formula.
Ivo
Hi Uwe,
It is not good to sum all spectrum components, as they do not came from jitter.
A Dunn simple example on last page of TN23 is enough.
- Record Jtest response with large sequence and averaging
- Find largest sideband, increase by 3dB and apply formula.
Ivo
Hi Ivo
that is very pragmatic. And I believe for "typical jitter spectra" it will work well.
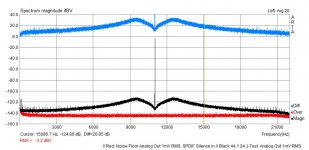
But how would I deal with a jitter spectrum as in the picture?
Red = Spectrum with "silence" SPDIF input; Black = Spectrum with J-Test 24-44.1 SPDIF input; Blue = Difference
Best regards,
Uwe
that is very pragmatic. And I believe for "typical jitter spectra" it will work well.
But how would I deal with a jitter spectrum as in the picture?
Red = Spectrum with "silence" SPDIF input; Black = Spectrum with J-Test 24-44.1 SPDIF input; Blue = Difference
Best regards,
Uwe
Attachments
Hi Ivo
that is very pragmatic. And I believe for "typical jitter spectra" it will work well.
But how would I deal with a jitter spectrum as in the picture?
Red = Spectrum with "silence" SPDIF input; Black = Spectrum with J-Test 24-44.1 SPDIF input; Blue = Difference
Best regards,
Uwe
The point is that J-test signal is not signal for measurement of jitter. It is the signal that shows maximal sensitivity to jitter and we can use it just to see the effect of jitter on spectrum of sine wave.
You can make estimation of spectrum degradation but it is not the measure of jitter in second.
Ivo
jitter calculation reference
If you want use more calculation here is report:
http://www.iet.ntnu.no/courses/fe8114/files/Report_audiodac.pdf
that refer to simple calculation of jitter if we assume wideband jitter excitation (not single sine as in Dunn paper).
For time being I do not intend to apply it in ARTA.
Ivo
Hi Ivo
that is very pragmatic. And I believe for "typical jitter spectra" it will work well.
But how would I deal with a jitter spectrum as in the picture?
Red = Spectrum with "silence" SPDIF input; Black = Spectrum with J-Test 24-44.1 SPDIF input; Blue = Difference
Best regards,
Uwe
If you want use more calculation here is report:
http://www.iet.ntnu.no/courses/fe8114/files/Report_audiodac.pdf
that refer to simple calculation of jitter if we assume wideband jitter excitation (not single sine as in Dunn paper).
For time being I do not intend to apply it in ARTA.
Ivo
Hi Ivo
Thanks for the Link!. The report seems to be very thorough and will take some
time to digest.
Uwe
Thanks for the Link!. The report seems to be very thorough and will take some
time to digest.
Uwe
Hi Ivo
Thanks for the Link!. The report seems to be very thorough and will take some
time to digest.
Uwe
You will get it fast, as procedure on page 8 is similar to yours - with important change that you must sum squared rms jitter value and at the end get square root of that value. Do not integrate values that are close to normal noise level.
Ivo