Inspired by tsardoz a few weeks ago, I've been making a lot of use of "tap" testing to identify the natural frequencies of my DML panels. It turns out to be quite informative. By "tap" testing, I mean simply striking the panel and measuring the response using the RTA feature of REW, with the microphone placed very close to the panel. This method is more correctly referred to as impulse excitation. Tsardoz called it "bash" testing! Curiously, I don't think I've ever seen anyone else share tap testing results on this or other forums concerning DMLs.
The most basic use of this technique is (as I mentioned above), simply to identify the natural frequencies of a panel. The frequency response of a DML is highly dependent on its natural frequencies. For example, the panels lowest natural frequency (i.e the fundamental), is approximately the lowest frequency at which can you can expect any significant output. Further, knowledge of the natural frequencies, along with the associated mode shapes (and hence the location of their nodes and antinodes), can help in exciter placement, since it can tell you where to place the exciter in order to excite (or not!) particular modes.
As an example, I will share some tap test results for a 14" by 48" plywood panel I've been working with lately, which was attached to a stiff frame using double sided foam tape around virtually the entire perimeter. In this case the lowest natural frequencies all look like the images below, which show the lowest three modes, that is, the fundamental (or 1,1) and the 1,2 and 1,3 modes, as well as one higher order (1.7) mode.


In these images, the red areas are the locations that exhibit the greatest displacement, and are called antinodes. When you tap a panel, the location where you tap determines which modes get excited (i.e. activated), and which do not. If you tap a red (antinode) location for a particular mode, that mode will be excited, while if you tap a blue location (node), that mode will not be excited. So, for example, tapping center of the panel will excite the 1,1 and 1,3 and 1,5 modes etc, since those modes all have an antinode (red) there at the center. On the other hand, tapping the center will not excite the 1,2 (or 1,4 and 1,6 modes etc) since it has a node at the center.
Likewise, the place where you position the microphone determines which modes you will detect. A mic will most easily detect the frequencies which have an antinode at or near the location of the mic.
For these reasons, finding the natural frequencies of a panel usually involves several measurements, made by tapping and mic-ing at a series of different locations.
In the case of my 14x48 panel attached to the frame around the perimeter, only two are needed to get most of the lower frequencies of interest. The first is tapping 2 or 3 inches from one one end of the panel, with the mic the same distance from the opposite end (and within about a 1/2" from the panel face). The other is simply tapping the center of the panel, with the mic also located at the center of the panel.
Here are the RTA measurements for the two tests:


The first (end tap) shows a series of peaks which each correspond to a natural frequency of the panel. In fact, this captures all (or virtually all) of the natural frequencies of this panel below about 500 Hz, starting with the 1,2 mode at about 85 Hz, up to the 1,9 mode at about 500 Hz. Tapping close to the end, the fundamental was not detected in this first test. However, in the next test (center tap), the fundamental is detected at about 72 Hz. The center tap clearly excites fewer modes (half as many), since it only excites the odd,odd modes (1,1 1,3 1,5 1,7 etc).
Finally, it's interesting to overlay the tap test results with the REW frequency sweep frequency response measured at one meter from the panel. In this case, with a Dayton DAEX25fhe exciter. I placed the exciter about 13 inches from the center in the long direction of the panel, and about 1.375" from the center in the other direction. This was the location that provided the best (flattest) overall frequency response for this particular panel and mounting.

One thing I found particularly interesting is how the strongest peaks in the overall frequency response correspond exactly to the odd,odd natural frequencies that occur at 72 Hz (1,1), 107 Hz (1,3) and 188 Hz (1,5). And on the other hand, the overall frequency response shows no peaks at the odd,even natural frequencies such as 85 Hz (1,2) and 140 Hz (1,4).
We can learn a lot about how these panels actually work by doing testing of this sort.
Eric
The most basic use of this technique is (as I mentioned above), simply to identify the natural frequencies of a panel. The frequency response of a DML is highly dependent on its natural frequencies. For example, the panels lowest natural frequency (i.e the fundamental), is approximately the lowest frequency at which can you can expect any significant output. Further, knowledge of the natural frequencies, along with the associated mode shapes (and hence the location of their nodes and antinodes), can help in exciter placement, since it can tell you where to place the exciter in order to excite (or not!) particular modes.
As an example, I will share some tap test results for a 14" by 48" plywood panel I've been working with lately, which was attached to a stiff frame using double sided foam tape around virtually the entire perimeter. In this case the lowest natural frequencies all look like the images below, which show the lowest three modes, that is, the fundamental (or 1,1) and the 1,2 and 1,3 modes, as well as one higher order (1.7) mode.
In these images, the red areas are the locations that exhibit the greatest displacement, and are called antinodes. When you tap a panel, the location where you tap determines which modes get excited (i.e. activated), and which do not. If you tap a red (antinode) location for a particular mode, that mode will be excited, while if you tap a blue location (node), that mode will not be excited. So, for example, tapping center of the panel will excite the 1,1 and 1,3 and 1,5 modes etc, since those modes all have an antinode (red) there at the center. On the other hand, tapping the center will not excite the 1,2 (or 1,4 and 1,6 modes etc) since it has a node at the center.
Likewise, the place where you position the microphone determines which modes you will detect. A mic will most easily detect the frequencies which have an antinode at or near the location of the mic.
For these reasons, finding the natural frequencies of a panel usually involves several measurements, made by tapping and mic-ing at a series of different locations.
In the case of my 14x48 panel attached to the frame around the perimeter, only two are needed to get most of the lower frequencies of interest. The first is tapping 2 or 3 inches from one one end of the panel, with the mic the same distance from the opposite end (and within about a 1/2" from the panel face). The other is simply tapping the center of the panel, with the mic also located at the center of the panel.
Here are the RTA measurements for the two tests:
The first (end tap) shows a series of peaks which each correspond to a natural frequency of the panel. In fact, this captures all (or virtually all) of the natural frequencies of this panel below about 500 Hz, starting with the 1,2 mode at about 85 Hz, up to the 1,9 mode at about 500 Hz. Tapping close to the end, the fundamental was not detected in this first test. However, in the next test (center tap), the fundamental is detected at about 72 Hz. The center tap clearly excites fewer modes (half as many), since it only excites the odd,odd modes (1,1 1,3 1,5 1,7 etc).
Finally, it's interesting to overlay the tap test results with the REW frequency sweep frequency response measured at one meter from the panel. In this case, with a Dayton DAEX25fhe exciter. I placed the exciter about 13 inches from the center in the long direction of the panel, and about 1.375" from the center in the other direction. This was the location that provided the best (flattest) overall frequency response for this particular panel and mounting.
One thing I found particularly interesting is how the strongest peaks in the overall frequency response correspond exactly to the odd,odd natural frequencies that occur at 72 Hz (1,1), 107 Hz (1,3) and 188 Hz (1,5). And on the other hand, the overall frequency response shows no peaks at the odd,even natural frequencies such as 85 Hz (1,2) and 140 Hz (1,4).
We can learn a lot about how these panels actually work by doing testing of this sort.
Eric

Eric,
This is the experimental proof of what you mentioned in other posts : some modes don't produce sound. Very good. This is typically among the experiments that help to understand DML mechanism.
Some time ago (see 4430 p217, A Study of DML's as a Full Range Speaker) I tried to record the resonance frequency of my canvas panel to try explaining how was its tension but it was not as clean as what you did.
When I did that, I wonder which hammer to use... The sound was different depending on the "hammer" (wood spoon, pencil...). It has perhaps no influence on the low frequency modes. What do you use as a "hammer"?
For the spectrum I used Audacity... What is the setting of REW you use?
Can this method be used to find the best exciter position?
Christian
Christian,Eric,
This is the experimental proof of what you mentioned in other posts : some modes don't produce sound. Very good. This is typically among the experiments that help to understand DML mechanism.
Some time ago (see 4430 p217, A Study of DML's as a Full Range Speaker) I tried to record the resonance frequency of my canvas panel to try explaining how was its tension but it was not as clean as what you did.
When I did that, I wonder which hammer to use... The sound was different depending on the "hammer" (wood spoon, pencil...). It has perhaps no influence on the low frequency modes. What do you use as a "hammer"?
For the spectrum I used Audacity... What is the setting of REW you use?
Can this method be used to find the best exciter position?
Christian
Concerning the "hammer", I use a stick with a rubber ball on the end. That seems to work well. Formerly I used the same technique to study the natural frequencies of wind chimes, so it was an obvious thing to try and I did not bother trying anything else. But I know from the my previous work with wind chimes that harder materials for the hammer tend to excite higher modes more and lower modes less. But the natural frequencies don't change or shift depending on the hammer, it just sounds different because you excite some modes more with one hammer, and other modes more with a different hammer.
I measured the impulse peaks using the RTA function of REW. I chose Spectrum mode with no smoothing. I set averages to 4 or 8, either of which allow me time to stop the recording before it decays and disappears.
As far as finding the best exciter position, I do think it can help, but probably not the way you were thinking. That is, I don't think you can strike various places and tell the best place for the exciter by directly comparing those responses directly. But this method (combined with FEA) can help you understand which modes you may want to excite to fill in a gap, or which mode you might want to avoid exciting to eliminate a spike, and help you figure out where you might be able to place the exciter to achieve that.
Eric
Nice work! I think you can mount exciters temporarily with blue tack putty etc and use the conventional sweep vs a manual hammer. Would that not also give the same info? You could also apply a square wave single pulse to the exciter as a pulse.
xrk,Nice work! I think you can mount exciters temporarily with blue tack putty etc and use the conventional sweep vs a manual hammer. Would that not also give the same info? You could also apply a square wave single pulse to the exciter as a pulse.
Yes, indeed you can get the same results with an exciter. I wondered if the exciter mass and stiffness wouldn't shift the peaks, but at least for these particular panels, it does not. I get similar results with an exciter and a sweep (or pink periodic noise), as with the manual hammer. The advantage of the hammer is that it's easier, as you don't need to bother mounting an exciter. But I think the exciter method has advantages too. With the hammer, you have to stop the data recording at an arbitrary time to capture the peaks, so some aspect of the curve are imprecise. But the sweep method removes that variability. I'll post some comparisons later.
Eric
Hello Eric,xrk,
Yes, indeed you can get the same results with an exciter. I wondered if the exciter mass and stiffness wouldn't shift the peaks, but at least for these particular panels, it does not. I get similar results with an exciter and a sweep (or pink periodic noise), as with the manual hammer. The advantage of the hammer is that it's easier, as you don't need to bother mounting an exciter. But I think the exciter method has advantages too. With the hammer, you have to stop the data recording at an arbitrary time to capture the peaks, so some aspect of the curve are imprecise. But the sweep method removes that variability. I'll post some comparisons later.
Eric
Here is a feedback from my first attempt with this technique.
I tried to follow the indications you gave on 4912 & 4913 in the DML thread.
I made tests with 2 small panels :
- plywood 2mm (175x270mm), density = 612kg/m³
- XPS (depron?) 9mm (200x300mm), density = 33kg/m³
The noise while tapping was analysed with REW RTA (setup below also).
I got the following frequencies for the 1st modes :
- plywood : flexion = 148.4Hz, torsion = 79.5Hz
- XPS : flexion = 100Hz, torsion = 99.8Hz
Inputting that in the IET (see Wiki Impulse Excitation Technique you linked) formulas :
- plywood : E = 17GPa, G=2.2GPa
- XPS : E = 31MPa, G=14MPa
The curious point is when I compute the Poisson Coefficient which are far from the standard 0.2..0.4 range. My material courses are far in the past and it was mainly for homogeneous materials not to say metals...
Do those values make sense for you?
Let me know if you think something is wrong.
Christian
Christian,
I'm looking it over now. I think 17 GPa is too high for plywood, but we will figure it out! Can you just tell me: how many layers are in your plywood, and what is the direction of the grain on the face and back layers? Is it parallel to the long or short direction of the panel?
Also, you need to do another measurement, for the plywood for sure, and maybe for the foam too. This is for flexure in the other direction. That is, turn the board 90 degrees and repeat the flexure measurement.
Eric
For a 3mm poplar plywood I have in my notes 9 GPa.Christian,
I'm looking it over now. I think 17 GPa is too high for plywood, but we will figure it out! Can you just tell me: how many layers are in your plywood, and what is the direction of the grain on the face and back layers? Is it parallel to the long or short direction of the panel?
Also, you need to do another measurement, for the plywood for sure, and maybe for the foam too. This is for flexure in the other direction. That is, turn the board 90 degrees and repeat the flexure measurement.
Eric
The plywood of the test is a 3 layer one. A little bit more dense than poplar. The internal layer seems not very dense. It is in fact the cover of a box of potatoes!
The direction of the grain is parallel to the long side.
As it is evening here now, I will make the additional measure tomorrow.
Christian
Christian,For a 3mm poplar plywood I have in my notes 9 GPa.
The plywood of the test is a 3 layer one. A little bit more dense than poplar. The internal layer seems not very dense. It is in fact the cover of a box of potatoes!
The direction of the grain is parallel to the long side.
As it is evening here now, I will make the additional measure tomorrow.
Christian
Did either of the panels have the exciter on it when you did the tap tests?
I think you are doing the calculations correctly. The only question is if we are interpreting the resonance frequencies correctly. That is, "have we correctly identified the modes?" It may be more complicated, as you have suggested, if the exciter mass and compliance is having an influence.
The plywood results make the most sense to me. Using the LISA FEM and the properties you calculated explains virtually every resonance peak I see. But the peak at about 150 in the torsion results has me a bit baffled. One possibility is that you have accidently made something close to a Poisson plate (as shown in the Wiki article). The 3 ply plywood is very anisotropic, as you can verify by bending it in your hands. For most plates with an aspect ratio of 270/175, the first flexural mode in the two directions would be quite far apart from each other. But in this very special case, they converge and the mode shapes for those two modes become much different from a more typical condition when the those two resonances are far apart.
If you do not have an exciter on the plywood panel, I suspect the effect I just described is what is confusing the interpretation.
Still, the first thing to do (for both panels) is to try to measure the resonance of the first flexural mode in the second direction.
Do you have more of the same plywood to play with? If the perpendicular measurements don't clarify things, I'd be tempted to try cutting a panel close to square and repeating the tap test. For this very anisotropic plywood, a square would be far from a Poisson plate and might help clarify things.
Eric
Last edited:
Hi EricChristian,
Did either of the panels have the exciter on it when you did the tap tests?
I think you are doing the calculations correctly. The only question is if we are interpreting the resonance frequencies correctly. That is, "have we correctly identified the modes?" It may be more complicated, as you have suggested, if the exciter mass and compliance is having an influence.
The plywood results make the most sense to me. Using the LISA FEM and the properties you calculated explains virtually every resonance peak I see. But the peak at about 150 in the torsion results has me a bit baffled. One possibility is that you have accidently made something close to a Poisson plate (as shown in the Wiki article). The 3 ply plywood is very anisotropic, as you can verify by bending it in your hands. For most plates with an aspect ratio of 270/175, the first flexural mode in the two directions would be quite far apart from each other. But in this very special case, they converge and the mode shapes for those two modes become much different from a more typical condition when the those two resonances are far apart.
If you do not have an exciter on the plywood panel, I suspect the effect I just described is what is confusing the interpretation.
Still, the first thing to do (for both panels) is to try to measure the resonance of the first flexural mode in the second direction.
Do you have more of the same plywood to play with? If the perpendicular measurements don't clarify things, I'd be tempted to try cutting a panel close to square and repeating the tap test. For this very anisotropic plywood, a square would be far from a Poisson plate and might help clarify things.
Eric
Those plates are for experimenting the tapping technique. No exciter on them. No problem to cut in a new shape.
The fact my calculations seems ok is a good point.
I was also wondering about a possible confusion of the origin of the modes and I discovered also while browsing around IET those Poisson panels.
2 questions :
- most of the pictures of equipment for IET are horizontal. The panel is horizontal on blades. Is the technique in suspension with 2 points as efficient to select the modes?
- about the Poisson coefficient, does it has a meaning with such materials?
Christian
Christian,Hi Eric
Those plates are for experimenting the tapping technique. No exciter on them. No problem to cut in a new shape.
The fact my calculations seems ok is a good point.
I was also wondering about a possible confusion of the origin of the modes and I discovered also while browsing around IET those Poisson panels.
2 questions :
For now, it is time for cooking... more experiment probably for this afternoon.
- most of the pictures of equipment for IET are horizontal. The panel is horizontal on blades. Is the technique in suspension with 2 points as efficient to select the modes?
- about the Poisson coefficient, does it has a meaning with such materials?
Christian
Okay, good to know there is no exciter on those plates, so I don't have to worry about that.
If you do more tap tests, for the flexural tests, also try tapping and mic-ing the exact center of the plates (in addition to the edge). The edge tap excites more modes, which can be helpful, but may also add to the confusion. But tapping either should excite the primary flexural mode. Also, tapping the center is a bit easier in a practical sense. The panel doesn't swing around as much and bump the microphone.
I'm going to concentrate on your plywood panel first. I have a similar 3-ply plywood, but it's 3mm and all birch. I think it will give similar results, so I may try it and see how it compares to yours. It may help me advise you better if the second flexural tests doesn't clear things up.
Regarding your questions. Mainly, horizontal or by suspension should not matter, if done well. The main problem with either one is to avoid that the supports influence the result. So the idea is to support the plate at the nodes of the mode you seek. Nodes of course are areas that have no displacement in a particular mode. By supporting at the nodes, since there is no motion of the plate there, there is no reaction force from the support to influence the result. But one challenge is that for some modes, you don't know for sure exactly where the nodes are. You will have a pretty good idea (from theory or from FEM), but you don't know for certain exactly where they are. I think the suspension method usually has the advantage in this regard, because it is "soft". So even if your choice of support points is off a bit, the effect will be minimal.
About the Poisson ratio and shear modulus. I think it is reasonable to say that the shear modulus is more important than the Poisson ratio. The shear modulus is effectively the stiffness in twisting, so it effects any mode that involves twisting (like the fundamental torsion mode, for example). The Poisson ratio itself is not really a direct measure of twisting stiffness, so you can say it is not important. The trick however, is that for isotropic materials, the Poisson ratio and shear modulus are directly linked. That is G=E/((2*(1+nu)). So, you could argue that since Poisson's ratio determines G, is equally as important as G!
Most of (probably all, in fact) our plates are orthotropic. For orthotropic materials, the situation is different. In fact, there are nine elastic constants instead of just 3. But for plate bending we don't care about z-direction strains in the plate. So then we care only about 4 of the elastic constants. E1, E2, G12, and nu12. There is also a nu21, but it is fixed by E1, E1, and nu12 so it does not need to be determined separately. But the important thing is that in this case, G12 and nu12 are decoupled. That is, nu12 and G are independent, unlike the isotropic case.
So a truly complete characterization of an orthotropic plate should, in principle, include determination of all four constants. E1, E2, G12 and nu12. As it turns out, however, the influence of nu12 (being unrelated to the shear modulus), is very, very small on the resonant frequencies of a plate. I have verified this many times using the LISA FEM program. For this reason, I make no attempt to determine it.
Eric
Here are the response in flexion the plate suspended by the short sideChristian,
Okay, good to know there is no exciter on those plates, so I don't have to worry about that.
If you do more tap tests, for the flexural tests, also try tapping and mic-ing the exact center of the plates (in addition to the edge). The edge tap excites more modes, which can be helpful, but may also add to the confusion. But tapping either should excite the primary flexural mode. Also, tapping the center is a bit easier in a practical sense. The panel doesn't swing around as much and bump the microphone.
I'm going to concentrate on your plywood panel first. I have a similar 3-ply plywood, but it's 3mm and all birch. I think it will give similar results, so I may try it and see how it compares to yours. It may help me advise you better if the second flexural tests doesn't clear things up.
Regarding your questions. Mainly, horizontal or by suspension should not matter, if done well. The main problem with either one is to avoid that the supports influence the result. So the idea is to support the plate at the nodes of the mode you seek. Nodes of course are areas that have no displacement in a particular mode. By supporting at the nodes, since there is no motion of the plate there, there is no reaction force from the support to influence the result. But one challenge is that for some modes, you don't know for sure exactly where the nodes are. You will have a pretty good idea (from theory or from FEM), but you don't know for certain exactly where they are. I think the suspension method usually has the advantage in this regard, because it is "soft". So even if your choice of support points is off a bit, the effect will be minimal.
About the Poisson ratio and shear modulus. I think it is reasonable to say that the shear modulus is more important than the Poisson ratio. The shear modulus is effectively the stiffness in twisting, so it effects any mode that involves twisting (like the fundamental torsion mode, for example). The Poisson ratio itself is not really a direct measure of twisting stiffness, so you can say it is not important. The trick however, is that for isotropic materials, the Poisson ratio and shear modulus are directly linked. That is G=E/((2*(1+nu)). So, you could argue that since Poisson's ratio determines G, is equally as important as G!
Most of (probably all, in fact) our plates are orthotropic. For orthotropic materials, the situation is different. In fact, there are nine elastic constants instead of just 3. But for plate bending we don't care about z-direction strains in the plate. So then we care only about 4 of the elastic constants. E1, E2, G12, and nu12. There is also a nu21, but it is fixed by E1, E1, and nu12 so it does not need to be determined separately. But the important thing is that in this case, G12 and nu12 are decoupled. That is, nu12 and G are independent, unlike the isotropic case.
So a truly complete characterization of an orthotropic plate should, in principle, include determination of all four constants. E1, E2, G12 and nu12. As it turns out, however, the influence of nu12 (being unrelated to the shear modulus), is very, very small on the resonant frequencies of a plate. I have verified this many times using the LISA FEM program. For this reason, I make no attempt to determine it.
Eric
- plywood ff short side = 152.3Hz
- XPS9 ff short side = 101Hz
Plywood :
XPS9:
So now here is the comparison for a flexion on the short side edge tapping (shown in #12) and central tapping.
Each time, the mic is facing the tapping point one or two centimeters on the 2nd face of the plate.
For the plywood there is a slight up shift from 152.3Hz previously to 160.6Hz. Some peaks also disappear.
For the XPS, no shift on the first peak but one on the second. Does that mean the flexural mode is not 100Hz?
Plywood : green is edge tapping, purple is central

XPS9: brown is edge tapping, green is central

Each time, the mic is facing the tapping point one or two centimeters on the 2nd face of the plate.
For the plywood there is a slight up shift from 152.3Hz previously to 160.6Hz. Some peaks also disappear.
For the XPS, no shift on the first peak but one on the second. Does that mean the flexural mode is not 100Hz?
Plywood : green is edge tapping, purple is central
XPS9: brown is edge tapping, green is central
Eric,
I made so other tapping tests with those 2 samples.
For the plywood, I think the modes are correctly identified. This gives E1=17MPa, E2=3.1GPa so E=(E1.E2)^0.5=7.3GPa. So following the wiki page (E1/E2)^.25=0.65 which is the plate ratio. So it seems it is a Poisson plate. My understanding is that under this property, the torsion mode has a lower frequency compare to the flexural mode.
For the XPS, it is a bit more tricky for me... In a first look, all the modes seem close to 100Hz but then E1 and E2 are very different which is not consistent. The XPS panel is not like the plywood; the XPS is stiffer when I try to bend it according to the short side compare to the long one.
In an other hand, if I suppose E1=E2 then the frequencies in flexion long and short side should be in the plate ratio which is 1.5 but I haven't found them...
An hypothesis would be that the torsion mode is excited in all the tests and the flexural mode changes from about 100Hz in the long side test to 220Hz in the short side test... Then E1=31MPa, E2=25MPa
A test with a different plate ratio might be more relevant. For other reasons, I think to cut a sample with a higher length to width ratio
Christian
XPS : long side flex in blue, short side flex in green.
Christian,
I think you are exactly right about the plywood panel. You have made a Poisson plate (PP) by accident! Even so, I think your estimates of the Elastic moduli are basically correct.
But don't cut that plate yet. Since it seems to be a Poisson plate, we may be able to get the Poisson ratio from tap tests too, which we would not be able to determine from any other aspect ratio.
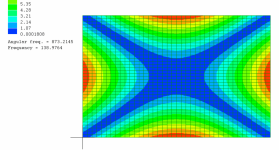
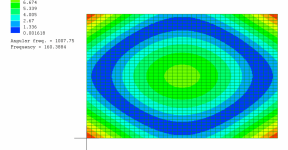
Consider that since your plate is a PP (or very close), the primary flexural modes have "evolved" into the modes in the images below. So what that means is that the hanging and tapping locations we used to try and excite those two modes where not ideal. They were correct for a typical plate, but not a PP.
Try two more tests. First, try exciting the first mode shown below by hanging from the corners and tapping/mic-ing the middle of the top edge. I think this may be the mode you have not yet excited/measured. While you are at it, go ahead and tap/mic the center. The mode you saw with the first tap should disappear when you tap the center (but may replaced by something close to the one you get from the next tap.
Then try exciting the second mode below by hanging from the centers of two edges (like the torsion tap) but tap/mic the center this time. The difference between the frequency you get here, compared to the the frequency for the previous tap (the first one, on the middle of the top edge, will let us estimate the Poisson ratio.
Finally, I know the answer but I must ask anyway. Is your plywood plate really 2.0 mm, and not a bit thicker actually? I ask only (as probably you imagine) because I am still surprised by the 17 GPa elastic modulus. My wood tables don't include any species with a modulus higher than about 15 GPa, and that is for solid wood. Plywood would be expected to be at least a bit lower than that. I know you are detail oriented, so probably it really is 2.0 mm, but I had to ask!
I still have to look harder at the PS foam.
Eric
I think you are exactly right about the plywood panel. You have made a Poisson plate (PP) by accident! Even so, I think your estimates of the Elastic moduli are basically correct.
But don't cut that plate yet. Since it seems to be a Poisson plate, we may be able to get the Poisson ratio from tap tests too, which we would not be able to determine from any other aspect ratio.
Consider that since your plate is a PP (or very close), the primary flexural modes have "evolved" into the modes in the images below. So what that means is that the hanging and tapping locations we used to try and excite those two modes where not ideal. They were correct for a typical plate, but not a PP.
Try two more tests. First, try exciting the first mode shown below by hanging from the corners and tapping/mic-ing the middle of the top edge. I think this may be the mode you have not yet excited/measured. While you are at it, go ahead and tap/mic the center. The mode you saw with the first tap should disappear when you tap the center (but may replaced by something close to the one you get from the next tap.
Then try exciting the second mode below by hanging from the centers of two edges (like the torsion tap) but tap/mic the center this time. The difference between the frequency you get here, compared to the the frequency for the previous tap (the first one, on the middle of the top edge, will let us estimate the Poisson ratio.
Finally, I know the answer but I must ask anyway. Is your plywood plate really 2.0 mm, and not a bit thicker actually? I ask only (as probably you imagine) because I am still surprised by the 17 GPa elastic modulus. My wood tables don't include any species with a modulus higher than about 15 GPa, and that is for solid wood. Plywood would be expected to be at least a bit lower than that. I know you are detail oriented, so probably it really is 2.0 mm, but I had to ask!
I still have to look harder at the PS foam.
Eric
Attachments
Hi Eric,Christian,
I think you are exactly right about the plywood panel. You have made a Poisson plate (PP) by accident! Even so, I think your estimates of the Elastic moduli are basically correct.
But don't cut that plate yet. Since it seems to be a Poisson plate, we may be able to get the Poisson ratio from tap tests too, which we would not be able to determine from any other aspect ratio.
Consider that since your plate is a PP (or very close), the primary flexural modes have "evolved" into the modes in the images below. So what that means is that the hanging and tapping locations we used to try and excite those two modes where not ideal. They were correct for a typical plate, but not a PP.
Try two more tests. First, try exciting the first mode shown below by hanging from the corners and tapping/mic-ing the middle of the top edge. I think this may be the mode you have not yet excited/measured. While you are at it, go ahead and tap/mic the center. The mode you saw with the first tap should disappear when you tap the center (but may replaced by something close to the one you get from the next tap.
Then try exciting the second mode below by hanging from the centers of two edges (like the torsion tap) but tap/mic the center this time. The difference between the frequency you get here, compared to the the frequency for the previous tap (the first one, on the middle of the top edge, will let us estimate the Poisson ratio.
Finally, I know the answer but I must ask anyway. Is your plywood plate really 2.0 mm, and not a bit thicker actually? I ask only (as probably you imagine) because I am still surprised by the 17 GPa elastic modulus. My wood tables don't include any species with a modulus higher than about 15 GPa, and that is for solid wood. Plywood would be expected to be at least a bit lower than that. I know you are detail oriented, so probably it really is 2.0 mm, but I had to ask!
I still have to look harder at the PS foam.
Eric
I must apologize and return my diploma of "detail oriented person" to you! Your assumption is right, the plywood thickness is 2.8mm which makes a big difference. Long time I haven't use my caliper! And you were right to ask.
This makes sense because the density is now evaluated at 440kg/m³ which is lower than the poplar plywood at 530kg/m³. This piece of plywood was the top a box so no reason to have high quality wood.
With that E1 = 6.2GPa, E2 = 1.15GPa, E = (E1.E2)^.5 = 1.7GPa
Good news, the plywood is not yet cut. I will post I hope tomorrow the additional tests.
Christian
Eric
About the XPS sample, I made some additional tests.
First : the thickness is 9.4mm (not twice the same error?). Easy to measure when the caliper is out.
Second : I cut a piece 20x60cm
Now the frequencies are easier to extract :
In torsion ft = 45.5Hz, in flexion (along the long side) = 22.6Hz (1st picture below)
So E = 23MPa it was 21MPa in my notes previously), G = 11.5MPa
In addition what I learnt from this sample :
Another one is to measure with precision the thickness!
All of that make me considering how a panel is suspended with a new eye... and how it modifies the modes. From memory I would list 5 types of suspensions (probably more if I go back to all the panels listed at least in the history file)
For now, I am not able to make a link between the modes from simulation you show and the naming of the modes with the 2 integers (m,n). Torsion, flexure, saddle... many names. Do all occur in a DML?
Then we can imagine different criteria to classify the suspension solution :
Christian


About the XPS sample, I made some additional tests.
First : the thickness is 9.4mm (not twice the same error?). Easy to measure when the caliper is out.
Second : I cut a piece 20x60cm
Now the frequencies are easier to extract :
In torsion ft = 45.5Hz, in flexion (along the long side) = 22.6Hz (1st picture below)
So E = 23MPa it was 21MPa in my notes previously), G = 11.5MPa
In addition what I learnt from this sample :
- in flexion : no big difference between tapping at the center of the plate or at the center of the short side almost at the edge.
- in torsion : the flexure mode is almost not visible while tapping at the "0.22" point from the corner compare to at the corner itself. (see second picture : red is at the 0.22 point, blue the corner + the picture as illustration)
Another one is to measure with precision the thickness!
All of that make me considering how a panel is suspended with a new eye... and how it modifies the modes. From memory I would list 5 types of suspensions (probably more if I go back to all the panels listed at least in the history file)
- strings at the corner
- strings some where near the corner on the short side (0.22 point)
- foam all around
- foam located in the 0.22 point area on the vertical long side
- 1 central point at the top short side, 2 points at the bottom short side
For now, I am not able to make a link between the modes from simulation you show and the naming of the modes with the 2 integers (m,n). Torsion, flexure, saddle... many names. Do all occur in a DML?
Then we can imagine different criteria to classify the suspension solution :
- the lowest fundamental
- the best modes density
- the capacity to keep the membrane flat... it was the one that leads me for the plywood panel seeing how it warps after a varnish layer.
Christian
Just seeing the previous picture... my wife was doubtful when I explained to her that the device with a piece of wood, string and clothespins and tapping on it with an other piece of wood in front of a mic was engineering! Fortunately there is the microphone to give some seriousness.
When it's simple is how you know it's the best engineering.Just seeing the previous picture... my wife was doubtful when I explained to her that the device with a piece of wood, string and clothespins and tapping on it with an other piece of wood in front of a mic was engineering! Fortunately there is the microphone to give some seriousness.
Hello Eric,Christian,
I think you are exactly right about the plywood panel. You have made a Poisson plate (PP) by accident! Even so, I think your estimates of the Elastic moduli are basically correct.
But don't cut that plate yet. Since it seems to be a Poisson plate, we may be able to get the Poisson ratio from tap tests too, which we would not be able to determine from any other aspect ratio.
Consider that since your plate is a PP (or very close), the primary flexural modes have "evolved" into the modes in the images below. So what that means is that the hanging and tapping locations we used to try and excite those two modes where not ideal. They were correct for a typical plate, but not a PP.
Try two more tests. First, try exciting the first mode shown below by hanging from the corners and tapping/mic-ing the middle of the top edge. I think this may be the mode you have not yet excited/measured. While you are at it, go ahead and tap/mic the center. The mode you saw with the first tap should disappear when you tap the center (but may replaced by something close to the one you get from the next tap.
Then try exciting the second mode below by hanging from the centers of two edges (like the torsion tap) but tap/mic the center this time. The difference between the frequency you get here, compared to the the frequency for the previous tap (the first one, on the middle of the top edge, will let us estimate the Poisson ratio.
Finally, I know the answer but I must ask anyway. Is your plywood plate really 2.0 mm, and not a bit thicker actually? I ask only (as probably you imagine) because I am still surprised by the 17 GPa elastic modulus. My wood tables don't include any species with a modulus higher than about 15 GPa, and that is for solid wood. Plywood would be expected to be at least a bit lower than that. I know you are detail oriented, so probably it really is 2.0 mm, but I had to ask!
I still have to look harder at the PS foam.
Eric
Here are the additional tests results from the plywood sample by order you describe them
In the second test, the mode from the first is still here and a second one appear...
The plate is perhaps not a strict Poisson Plate but something close.
Anyway if it gives you the possibility to extract the Poisson coefficient, that's fine.
Christian
- Home
- Loudspeakers
- Full Range
- Application of Impulse Excitation for DML Design and Analysis