Klaus,
Thanks for posting your results, it's good to see you're well-versed in measurement.
For a first run, your results are quite good. If the dB scale is re: 2.83Vp, then your peak difference error is only 126uV, which is quite amazing. I had no idea that a sound card could do this.
I'm more used to the freq domain view, but the general shape of the difference signal is very much like what I often see. Not surprising, because the rate of change is greatest on either edge. The "ringing" is up in the 20kHz range, it's likely caused by the rising and falling edge being the same and causing a freq. notch. Can you calculate your haver waveforms with some symmetry offset? That will help smooth things out in the 20kHz range.
Something bothers me about the plot, though. If this is a repetitive signal as you described, then the post-pulse decay should continue into the next pulse. But that isn't what we see here. The noise to the left of the pulse is much higher than the post-pulse. If it is indeed a continuous sequence then you should be able to rotate the data set around at will and it still makes sense. Is this an artifact of chaining the + and - pulse into one sequence? Your technique is very efficient, but I wonder if it's better to do each polarity pulse in a separate data set, then do the math. At least until everything is well understood.
Are the output and input DC or AC coupled?
I have certainly seen that, above a certain repetition rate, the DC level does indeed "sag." Since this isn't the phenomena I'm testing for, though it is indeed interesting by itself, I have kept my rep rates low - 4 to 8 per second - so that I don't cause that to happen.
Reading through this thread a bit, I too wonder if flat source impedance is necessary for a power supply. I would expect the impedance to sort of match load impedance for best results.
Hi jbau,
http://www.diyaudio.com/forums/showthread.php?postid=1337413#post1337413
All in all this is not an easy task as there are so many variables and setup conditions to consider with pretty unkown sensivity to the results, as of yet. I probably won't have the time to refine my approach in all detail and I also don't have an explicit need for it at the moment (except for my general interest in reliable measurement techniques using a good soundcard as an alternative to racks full of HPxxxxx's etc) but I'm looking forward to try at least some of the above modifications in the near future in order to find an accuary baseline for this type of measurent und specific conditions. At the moment I'm pretty much tied up in improving my knowledge in DSP techniques. It's only a few days that I can write and visualize my own arbitrary (in both mag and phase) FIR filter kernels... heavy "dirac bending" so to speak...
Anyway I'm curious how your efforts will turn out, of course.
- Klaus
I think this is, besides the overall good specs of the card, mainly the effect of the massive averaging, which is a good and and thing at the same time... with heavy time domain averaging I also could lower the noise floor for THD measurement down to ~150dBFS, now I'm able to identify harmonics buried in the noise when measuring distortion at very low signal levels, like -90dBFS:Originally posted by jbau
For a first run, your results are quite good. If the dB scale is re: 2.83Vp, then your peak difference error is only 126uV, which is quite amazing. I had no idea that a sound card could do this.
http://www.diyaudio.com/forums/showthread.php?postid=1337413#post1337413
Uh, do you mean shifting one of the stimulus polarities by the corresponding time (a sub-sample fraction, as it looks)? I could do this, estimating the offset from the peaks in the difference... but then again doesn't that only cure symptoms? I agree if we were to design the test to get the maximum s/n (minimized "pulse core" in the diff) this could be a useful approach. Another way to get some spread into the sample values, trying to avarage out some DAC/ADC static nonlinearities, would be to *not* use a pulse freq at an exact fraction of fs. Together with the dithering applied to render the 24bit PCM-data from the original sequence (which is 64-bit double precision floats) this might improve resultant symmetry. Another test for steady-state symmetry would be to use a continuous sine and subtract the pos half from the neg, again using maybe the total dithering as described above to average out things we don't want to see. If the difference remains that strong something is wrong with overall symmetry of the total signal chain right to start with.The "ringing" is up in the 20kHz range, it's likely caused by the rising and falling edge being the same and causing a freq. notch. Can you calculate your haver waveforms with some symmetry offset? That will help smooth things out in the 20kHz range.
I don't think this is an artifact in the original sequence the way I constructed it (which might not be optimal, see above), the stimulus is really perfectly symmetric in all regards (time-symmetric pulses and identical absolute sample values). That left side noise, dominated mostly by the sinc ripple from bandlimiting the pulses, (and further having some neg "DC"-offset) puzzles me also. I can only hope that with improved stimuli this could be factored out (maybe it's better to drop the additional bandlimiting and trade that with potential aliasing, which might also combine to net zero after subtraction. The aliasing performance of the card -- Marian Marc88 -- is pretty well behaved anyway.Something bothers me about the plot, though. If this is a repetitive signal as you described, then the post-pulse decay should continue into the next pulse. But that isn't what we see here. The noise to the left of the pulse is much higher than the post-pulse. If it is indeed a continuous sequence then you should be able to rotate the data set around at will and it still makes sense. Is this an artifact of chaining the + and - pulse into one sequence?
That latter point is the core of the problem, as usual. So one would need to make a lot of sanity checks to understand what setup parameters result in what phenomena. Together with a DUT with an explicitly known-bad behaviour (say a TL071 with known impedance/ringing charactristics of its supplies).Your technique is very efficient, but I wonder if it's better to do each polarity pulse in a separate data set, then do the math. At least until everything is well understood.
The input is AC-coupled with an RC of k + 10uF, el cheapo electrolytic.The cap could be pretty well also be part of the result if it had symmetry issues (even harmonics, different/unstable leakage current etc), which is pretty likely for this type of cap. Hard to factor out unless I replaced it with a good film type.Are the output and input DC or AC coupled?
Strong point. Together with using two split stimuli instead of a combined one this would be needed to investigate.Also there might be better suited base pulses than haversines, maybe something "more analytic" like (windowed) gaussian pulses...I have certainly seen that, above a certain repetition rate, the DC level does indeed "sag." Since this isn't the phenomena I'm testing for, though it is indeed interesting by itself, I have kept my rep rates low - 4 to 8 per second - so that I don't cause that to happen.
All in all this is not an easy task as there are so many variables and setup conditions to consider with pretty unkown sensivity to the results, as of yet. I probably won't have the time to refine my approach in all detail and I also don't have an explicit need for it at the moment (except for my general interest in reliable measurement techniques using a good soundcard as an alternative to racks full of HPxxxxx's etc) but I'm looking forward to try at least some of the above modifications in the near future in order to find an accuary baseline for this type of measurent und specific conditions. At the moment I'm pretty much tied up in improving my knowledge in DSP techniques. It's only a few days that I can write and visualize my own arbitrary (in both mag and phase) FIR filter kernels... heavy "dirac bending" so to speak...
Anyway I'm curious how your efforts will turn out, of course.
- Klaus
jbau said:This video is a little technical but you should watch it:
http://www.youtube.com:80/watch?v=rLDgQg6bq7o&feature=related
Rockwell offers a superior version of the retro encabulator.
http://www.youtube.com/watch?v=RXJKdh1KZ0w&feature=related
This device basically uses a sinusoidal ding alarm to monitor side fumbling of six hydrocoptic marselvanes in a prefamulated amulite surmounted by a maleable logarithmic casing.
Sounds like a fan subwoofer to me! 😀
This will depend on the symmetry of all PSRR related effects -- might only be realistic for fully balanced circuits. A way of improving rail exitation spectra is by forcing class-A operation and when you use balanced circuits the net draw from the PSU is constant. This can also be done in single-ended by adding dummies (not part of the signal chain) for the sole purpose of getting that constant current draw action (very feasible and very effective, too, with dual opamps like good ol' 5532's and the like) -- together with a reasonably clean and flat impedance supply and proper local bypassing this IME does more good than a better supply with an amp stage design not drawing as constant a current as possible.soongsc said:Reading through this thread a bit, I too wonder if flat source impedance is necessary for a power supply. I would expect the impedance to sort of match load impedance for best results.
- Klaus
Klaus, all points well taken, and I understand you don't have the "burning need" that I do for this.
If it was easy, it would be as rewarding... I'm doing my best to sort things out as I go along.
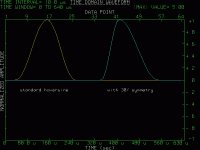
I see the confusion, we have two things being named "symmetry" now. I mean, alter the rising and falling slopes of the waveform so they are not the same. Here are a couple 5kHz haversine pulses: a standard one, and then one with a 30/70 slope ratio.
The frequency spectrum of these is in the next post.
KSTR said:All in all this is not an easy task as there are so many variables and setup conditions to consider with pretty unkown sensivity to the results, as of yet.
If it was easy, it would be as rewarding... I'm doing my best to sort things out as I go along.
Uh, do you mean shifting one of the stimulus polarities by the corresponding time (a sub-sample fraction, as it looks)?
I see the confusion, we have two things being named "symmetry" now. I mean, alter the rising and falling slopes of the waveform so they are not the same. Here are a couple 5kHz haversine pulses: a standard one, and then one with a 30/70 slope ratio.
The frequency spectrum of these is in the next post.
Attachments
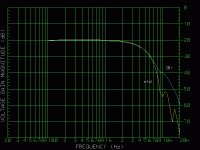
A standard haversine has a frequency spectrum that is -6dB down at the pulse frequency, then ever deeper notches at higher multiples. This is caused by the rising and falling slopes being the same. It's a bit clearer when plotted on a linear freq scale.
If you alter the rate of the slopes to each other, then the notches are filled in, giving a really well-behaved HF rolloff. It is a self-anti-aliasing, uni-polar lowpass response, pretty close to a 4th order Bessel response. As long as you have enough sampled points to define it well, it's a pretty ideal stimulus.
The graph below shows their reponse overlaid.
One could put together an ensemble of these with different rates and time placements, using Fibonacci ratios, to get steeper rolloff and more energy per window. But that's a project for another day.
Attachments
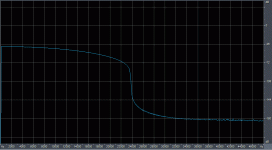
Yes, I get your point, something worth to consider. My bandlimited stimulus also has a nice roll-off, see attachment. Instead of linphase bandlimiting (as created by the upsampling) one might also try inverse minphase filtering, placing any ringing in front of the pulse. And preferably with Bessels or other low ringing filters as with 2x upsampling I have enough space to reach the stopband. Next soundcard will be a 192kHz model, so I expect to get good data to some 50kHz or so.jbau said:If you alter the rate of the slopes to each other, then the notches are filled in, giving a really well-behaved HF rolloff. It is a self-anti-aliasing, uni-polar lowpass response, pretty close to a 4th order Bessel response. As long as you have enough sampled points to define it well, it's a pretty ideal stimulus.
EDIT: I see the advantage of asymmetric haversines, impulse compaction on the rising edge to exite the DUT with a stronger dV/dt or dI/dt while having a benign spectrum at the same time
There really are many valid approaches it seems... your "ensemble idea" of differently parametrized pulse sets looks quite promising, too.
- Klaus
Attachments
This thread seems to have been seriously sidetracked. I thought it was about regulators.
Can jbau please tell me what his conclusions are about the final, absolute best configuration and component values for LM317/337 regs? There are so many options discussed but I've not seen it nailed down as yet.
A little sketch might be useful so we understand the config and values clearly.
Thanks
Gopher
KSTR said:My bandlimited stimulus also has a nice roll-off, see attachment.
Yes Klaus, that looks very good, too.
Next soundcard will be a 192kHz model, so I expect to get good data to some 50kHz or so.
Sounds interesting, keep us posted.
There really are many valid approaches it seems...
Yes, I agree. As long as the signal meets the test criteria, and one takes appropriate care in the post-processing, it will work fine.
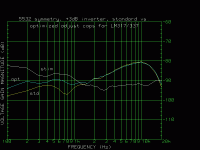
Minor update on the line-freq-related trigger modulation noted a few posts back: The problem was in the 625 generator. The "trigger in to pulse out" time was modulating over about a 1uS range when the rep rate was not exactly synched to line freq multiples. Very bizarre. I don't know how it happened and don't want to stop and investigate. I have a second 625, checked it out and it works fine. It's power supply impedance looks much better, and symmetry error is a good 20dB lower than the faulty one.
Based on that, I started making some measurements on a simple circuit (a unity-gain inverting 5532). It became clear quickly that, despite reliably good triggering, the 3437A is lacking the bit depth to be useful.
So, after seeing KSTR's good results with massive averaging, I am back trying to improve the triggering with the SD390 or Data 6000/610 to take advantage of their higher resolution. It turns out the Data 6000 can be configured to put out a synch signal "when all trigger conditions have been met" (that's the manual's wording). I'll use that to trigger the pulse and see if it improves the jitter.
Attachments
KSTR said:This can also be done in single-ended by adding dummies (not part of the signal chain) for the sole purpose of getting that constant current draw action (very feasible and very effective, too, with dual opamps like good ol' 5532's and the like)
This has been rolling around in my head since you mentioned it. Maybe two things can be accomplished at once to good end. Since the regs need to be loaded so their impedance doesn't modulate with current draw, why not distribute the load resistors around the pc board (next to local bypass caps) instead of loading the regs at the source.
Perserverence furthers. The search for stable, repetitive triggering has paid off in spades. I spent a couple hours last night combing through the volumnous Data 6000A manual, searching for a definition of the various system control signals that can be routed to the rear panel BNC connectors. Yes, there was the "trigger conditions" one mentioned earlier. But that wasn't working as expected. I tried one called "Gate A" which had no description, but it wouldn't trigger the 625 reliably, even when using a pulse generator to reconstruct the pulse for the 625's benefit. Viewed on a scope, it danced around the "trigger" output and in a seeming random manner.
So I looked in the old, original Data 6000 manual, and there was the Gate A signal description: "negative true pulse at the first and last sample in the frame." That's exactly what I'm looking for! And then I realized - the reason it "danced around" the trigger pulse is because the trigger pulse followed it in time and was a signal to the system cpu, while the "Gate A" pulse was the start signal to the ADC.
So I traced the line back from the BNC connector to a 74LS355 mux on the plugin's ADC control board, looked at the schematic, and voila. That's the source. The 625 wants to see a positive-true trigger pulse, and the 74LS355 has both + and - true outputs, so I moved the output from the negative true pin to the positive true pin. Put the system back together, and hooked the Gate A signal through a pulse generator with a couple microseconds delay to allow the system trigger to catch up, fired it up, and there it was on the screen, motionless. At first I thought, hey, this thing isn't moving, maybe it's not really collecting new data. But varying the pulse level changed the pulse immediately, so I knew then it was triggering as solid as a rock. Less jitter than the HP 3437A, even. Exactly what I was looking for. The haver pulse is now perfectly synchronized to the ADC.
The chart below shows the symmetry error between + and - pulses (top trace), then between two + pulse records, and then the noise floor with pulse output defeated. All made using 512 averages. The scaling is dbV, and I'll use that from now on for consistency. (Note, these were taken with 5V pulses so drop the curves by 14dB for dB re: full scale.
These are really quite good measurements, especially for a 14-bit system, with excellent repeatability. (Note: the noise floor measurement was higher at low freq's because the 625 is ground-lifted and I removed it's connection to the pulse gen where it found it's ground reference to the analyser.)
BTW, if anyone has a Data 6000/6100 with 610 or 611 plugin and wants to make this mod, email me. It's quite simple to do.
Also interesting to note is the plot of the difference between two positive pulse records. It is essentially at the noise floor below 2kHz. So, when making measurements of a DUT, it looks like the way to avoid the symmetry error of the analyser is to use a second transformer: one to flip the pulse polarity, and the second to flip the DUT's output to keep it in the same polarity for the analyser.
The trigger jitter issue has been licked. Measurements can now begin!
Attachments
You have all ears and eyes!jbau said:Measurements can now begin!
Probably this weekend I'll also try to move foreward with all the suggestions which are avaliable to explore. I have a pending cable comparison measurement that fails to show results with conventional methods so far, maybe this +-haversine thingy opens up new insights there...
- Klaus
Well I thought I was ready to start posting DUT measurements... but I've run into a bit of a technical snag. The plan was to use the 2nd transformer in the 353A patch panel to invert the polarity of the DUT output. Doing so would eliminate the Data 6000's errors and give a -110dB or better measurement floor. Well, those xfmrs are 600:600 ohms (i.e. optimized for a 600 ohm termination and presenting roughly that impedance at the input.) That's not a problem for the 625 generator, whose output stage handles that easily. But driving 5V pulses into an inductive 600 ohm load with an opamp is a recipe for output stage nonlinearities, and that's what I saw in the very first test. Something like a 10k:10k xfmr is needed, to present a more benign load.
So I went looking for my box of transformers. I've been a bit of xfmr freak since 1980, when I struck up a friendship with Deane Jensen (peace to his soul.) For decades I've collected mic and line-level xfmrs, throwing them into a couple boxes, more than a hundred of them at least. And now, the boxes are nowhere to be found. Frustrating.
If I can't locate them today, I'll see how high the termination impedance on the HP xfmr can be raised while still retaining it's reactive balance over the audio range.
Every piece of equipment in this test is being run at the bleeding edge of it's performance limits, requiring extreme care in the setup.
Sadly, the box of xfmrs was not found. And a 2.2k Ohms termination on the 2nd 353A xfmr resulted in flat input Z of 2k Ohms, but the Zphase worsened above 2kHz and the xfmr lost it's balance and symmetry. It could also be that this 2nd xfmr isn't as inherently well-balanced as the 1st one - HP's specs only guarantee 60dB balance at 1kHz. So... these first tests are done direct into the Data 6000, and the upper "measurement floor" symmetry curve on the graph in post #173 applies.
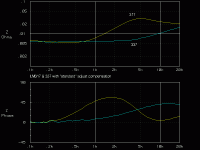
Each measurement will consist of two symmetry difference traces with nominally +-15V supplies using the LM317/337 regs: one with "standard" adjust circuit, and one with the adjust circuit "optimized" for flat Z and Zphase. The idea is to compare the symmetry diff traces to each other and to their respective Z/phase curves and see if any patterns emerge. All plots are 100Hz-20kHz and normalized to dBV.
The regulator adjust circuits are:
Standard: (except for load R, both regs have the same values)
Vin-Vout = 6V
out to adjust - 240 ohms
adjust to gnd : 2.7k ohms || 100uF
output cap: 1500uF w/ 10uF film
load resistance: 165 Ohms (317) and 330 Ohms (337)
Optimized:
LM317: Vin-Vout = 2.7V
out to adjust - 240 ohms
adjust to gnd : 2.7k ohms || 120nF
output cap: 1500uF w/ 10uF film
load resistance: 165 Ohms
LM337: Vin-Vout = 2.7V
out to adjust - 240 ohms
adjust to gnd : 2.7k ohms || 33nF
output cap: 1500uF w/ 10uF film
load resistance: 330 Ohms
So the only difference between std and opt. is the Vin-Vout and the adjust caps.
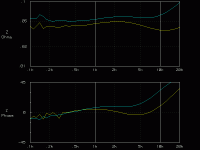
Here are the reference Z/phase curves for the "standard" config, measured at the output caps. It's connected to the DUT board with 3" of #22 wire, 100nF ceramic bypasses there.
Each measurement will consist of two symmetry difference traces with nominally +-15V supplies using the LM317/337 regs: one with "standard" adjust circuit, and one with the adjust circuit "optimized" for flat Z and Zphase. The idea is to compare the symmetry diff traces to each other and to their respective Z/phase curves and see if any patterns emerge. All plots are 100Hz-20kHz and normalized to dBV.
The regulator adjust circuits are:
Standard: (except for load R, both regs have the same values)
Vin-Vout = 6V
out to adjust - 240 ohms
adjust to gnd : 2.7k ohms || 100uF
output cap: 1500uF w/ 10uF film
load resistance: 165 Ohms (317) and 330 Ohms (337)
Optimized:
LM317: Vin-Vout = 2.7V
out to adjust - 240 ohms
adjust to gnd : 2.7k ohms || 120nF
output cap: 1500uF w/ 10uF film
load resistance: 165 Ohms
LM337: Vin-Vout = 2.7V
out to adjust - 240 ohms
adjust to gnd : 2.7k ohms || 33nF
output cap: 1500uF w/ 10uF film
load resistance: 330 Ohms
So the only difference between std and opt. is the Vin-Vout and the adjust caps.
Here are the reference Z/phase curves for the "standard" config, measured at the output caps. It's connected to the DUT board with 3" of #22 wire, 100nF ceramic bypasses there.
Attachments
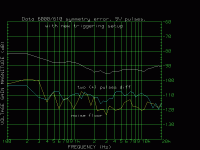
And here are the first measurements. Remember, lower dBs = less symmetry error.
The DUT is a Signetics NE5532A, with 3.2dB gain in inverting mode to avoid common mode errors. Impedance at the + and - inputs are balanced to minimize DC errors and for FET opamps if they are used. Load resistor is 10k Ohms, then a 75 Ohms output R to isolate the output from the cable C. So we're not pulling much current from the supplies at all, maybe half a mil each side.
There are two "apparent" problems with the curves.
First, below about 1.2kHz, the measurement floor is higher than the DUT measurements in either config, which is unlikely, unless this is the magic of negative feedback at work. 🙂 My only explanation for this is that, when making the reference measurements to see the generator's measurement floor, I had to raise the output level of the haverpulse generator by 3.2dB in order to get the same full-range input to the analyser, which raises it's output noise by that much. So it's possible that this curve should be at least 3.2dB lower. Other than that, I don't know how what could cause this. There were no other changes in the measurement setup.
Second, above 1.5kHz, the symmetries with the std and opt. supplies are nearly identical, swamping any other details, and looking very much like the shape of the high-jitter curves we saw earlier. That raised enough doubt that I re-did the stimulus symmetry measurement of the generator, and overlaid it on the graph (labelled "stim"). Compare this to the the upper "measurement floor" symmetry curve on the graph in post #173, and you can see how consistent and repeatable the measurement is. So the high-freq. symmetry error is real. Is this revealing an inherent high-freq. nonlinear distortion of the 5532? Or is it something else? The time trace didn't show any signs of jitter so that isn't the cause.
Below 1.5kHz, the std regs have lower and better-matched impedance in this range, and that trace has less symmetry error there. So that part makes sense.
Beyond that there isn't much to say right now. More measurements of different DUT's need to be made and examined. Perhaps lowering the opamp load R some to draw more current would help bring out details. Perhaps exaggerating the Z/phase difference of one of the rails would be illustrative. We shall see.
Stay tuned...
Attachments
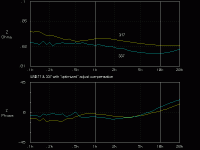
I've been unable to do anything that significantly improves the worsened symmetry error at high freqs. I've tested different opamps; NI 4562, AD 2132 and AD 746, and the lowly TLO72 and the pattern holds. This is the test circuit, by the way. I'm using it because it's the I/V circuit in the Sony DAT I'm modding.
39pF
|-----| |----|
|----/\/\/\--|
| |\ 20k |
13k8 | | \ |
in ----/\/\/\----|- \ | 75R
| \------|----/\/\/\--- out
------|+ / |
| | | / |
/ | | / /
\ | |/ 10k \
8k2 / - /
\ - 39pF \
| | |
| | |
| | |
------------------------- Gnd
I did find one interesting thing, however, about the question of balancing the impedance seen by an opamp's + and - input. In past distortion tests, for noninverting configurations, I've measured (and heard) that it's very worthwhile, especially for FET inputs. But for inverting configs, measurements and listening tests have been inconclusive.
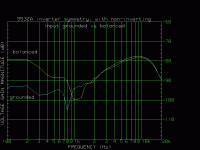
While looking for a possible cause to the high-freq rise, I ran the symmetry test with the 5532A + input grounded. See the graph. No significant difference at high freqs, but quite a large difference below say 1kHz. I can't say whether this is just lower noise or actual improvement in symmetry, but regardless, a 10-15dB improvement is hard to argue with. Also, the DC offset was actually less with the + grounded.
I'll run it again with one of the FET opamps and see if the same results hold true.
EDIT: Well it appears that drawing circuits with ascii characters doesn't work with any of the fonts here, how does one post simple circuit drawings?
39pF
|-----| |----|
|----/\/\/\--|
| |\ 20k |
13k8 | | \ |
in ----/\/\/\----|- \ | 75R
| \------|----/\/\/\--- out
------|+ / |
| | | / |
/ | | / /
\ | |/ 10k \
8k2 / - /
\ - 39pF \
| | |
| | |
| | |
------------------------- Gnd
I did find one interesting thing, however, about the question of balancing the impedance seen by an opamp's + and - input. In past distortion tests, for noninverting configurations, I've measured (and heard) that it's very worthwhile, especially for FET inputs. But for inverting configs, measurements and listening tests have been inconclusive.
While looking for a possible cause to the high-freq rise, I ran the symmetry test with the 5532A + input grounded. See the graph. No significant difference at high freqs, but quite a large difference below say 1kHz. I can't say whether this is just lower noise or actual improvement in symmetry, but regardless, a 10-15dB improvement is hard to argue with. Also, the DC offset was actually less with the + grounded.
I'll run it again with one of the FET opamps and see if the same results hold true.
EDIT: Well it appears that drawing circuits with ascii characters doesn't work with any of the fonts here, how does one post simple circuit drawings?
Attachments
The same way you post your measurements. If your circuit drawing software does not support conversion to .gif .jpg or .pdf, make a screenshot (Ctrl + Print), paste it into your graphic software (Ctrl + v in Paint, IrfanViewer, Photoshop, whatever), save it as .jpg and upload.jbau said:how does one post simple circuit drawings?
- Status
- Not open for further replies.
- Home
- Amplifiers
- Power Supplies
- Another look at the LM317 and LM337 regulators