The analog clocks P,P2 being common to both channels, it is better to have it on a separate PCB or annexed to the PLLs.
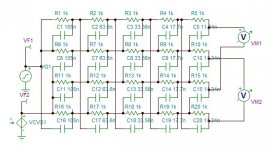
Designing the quadrant phase splitter.

This filter splits the signal not 0°/180° as normal splitters do but 0°/90° all keeping the amplitude constant, within a certain frequency range defined Fu/Fl.
The number for cells gives higher range or higher side band rejection.
The formula that governs this filter is as follows.

The dn is calculated from one of the 12 Jacobi elliptic functions.
My need is from 2khz to 14khz why?
When in 44.1khz sample mode the 20khz becomes 2.05khz and the 10khz,12.05khz. With 48khz sample rate, they becomes 2.4khz and 14khz.
So I will start by 1.5khz to 15khz gives a range of 10 similar to the bellow table 300/3000

The attenuation of 52db I choose to start with, this gives 5 cells.
To calculate the dn, I went on line Matlab trial for 30days and applied the script I found on line, no, it didn't work.
My knowledge with Matlab dates back to 2 decades and this on 90's old version, nevertheless I could make it function with manually entering the parameters and got the five dn values as this.

Probably the values given on the above table can be proportioned to my frequencies.
This filter splits the signal not 0°/180° as normal splitters do but 0°/90° all keeping the amplitude constant, within a certain frequency range defined Fu/Fl.
The number for cells gives higher range or higher side band rejection.
The formula that governs this filter is as follows.
The dn is calculated from one of the 12 Jacobi elliptic functions.
My need is from 2khz to 14khz why?
When in 44.1khz sample mode the 20khz becomes 2.05khz and the 10khz,12.05khz. With 48khz sample rate, they becomes 2.4khz and 14khz.
So I will start by 1.5khz to 15khz gives a range of 10 similar to the bellow table 300/3000
The attenuation of 52db I choose to start with, this gives 5 cells.
To calculate the dn, I went on line Matlab trial for 30days and applied the script I found on line, no, it didn't work.
My knowledge with Matlab dates back to 2 decades and this on 90's old version, nevertheless I could make it function with manually entering the parameters and got the five dn values as this.
Probably the values given on the above table can be proportioned to my frequencies.
Attachments
Last edited:
There is a free Matlab clone called GNU Octave. I never used either of them, I just know they exist.
Matlab works is done. It worked at first run. Here is the circuit 1.5k to 15khz.

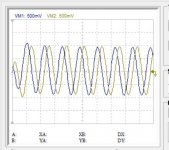
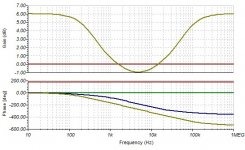
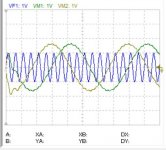
bellow are 14k 8k 2khz with transients.


You can see near constant level on steady state but on transient the story is told by the bode curves.

I need to meditate on this filter for a while.
bellow are 14k 8k 2khz with transients.
You can see near constant level on steady state but on transient the story is told by the bode curves.
I need to meditate on this filter for a while.
Attachments
Last edited:
I formed the Hartley modulator to reconstruct the 20khz, horrible, The steady state not perfect but acceptable, only the transient ......

I will see if I can quadrant phase shift the original signal instead of heterodyned, the range than is 20k/10k instead of 14k/2k actually.
I made the same circuit in LTspice, it doesn't start, waroom?
I will see if I can quadrant phase shift the original signal instead of heterodyned, the range than is 20k/10k instead of 14k/2k actually.
I made the same circuit in LTspice, it doesn't start, waroom?
Attachments

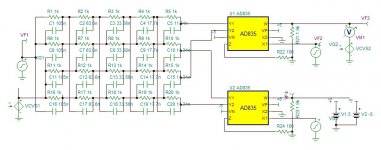
I changed completely the principle. No more Hartley or Weaver but my way.
With 2nd order quad phase shifter I shift directly the signal of the DAC. The two phases are multiplied by two quadrant Fs. This results to four products, by adding and subtracting two by two I get a pair of frequency shifted in 90° phase shift.

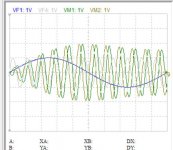
Don't ask me now how it works, it is now just a product of mathematics but the result is here, 20khz input and this is the 2khz frequency shifted.
The greatness is that it doesn't require much filtering.
With 2nd order quad phase shifter I shift directly the signal of the DAC. The two phases are multiplied by two quadrant Fs. This results to four products, by adding and subtracting two by two I get a pair of frequency shifted in 90° phase shift.
Don't ask me now how it works, it is now just a product of mathematics but the result is here, 20khz input and this is the 2khz frequency shifted.
The greatness is that it doesn't require much filtering.
Attachments

Last edited:
I went back to my initial approach, to extract the image and subtract from the interpolated signal.
Using 2nd order quadrant shifter to dephase the frequency shifter by square wave Nyquist and filtered by RC, I could separate the image here 24khz.


I could also get the imaginary version of it by Tina but yet with LTspice.
Using 2nd order quadrant shifter to dephase the frequency shifter by square wave Nyquist and filtered by RC, I could separate the image here 24khz.
I could also get the imaginary version of it by Tina but yet with LTspice.
Attachments
The filter works down to 15khz with 12db side band residual from its image 32khz. A high pass filter above 22khz can decrease this 15khz component which will subtract the signal. Subtract is not so sure, the character of sinc mod modulation due to sampling seams to be different, may be imaginary components act in the sidebands.
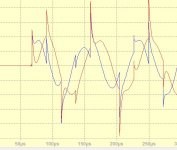
The heterodyne modulation down shifting the frequencies is done with square waves, I also tried to up shift in Hartley's modulator using square waves, bellow is the result for 20khz. The 3rd harmonic of 22khz modulator is also modulating giving in 60khz band. I think it is much easier to filter this out using band pass instead of high pass before subtraction, than transforming the square waves into sine ones.
The heterodyne modulation down shifting the frequencies is done with square waves, I also tried to up shift in Hartley's modulator using square waves, bellow is the result for 20khz. The 3rd harmonic of 22khz modulator is also modulating giving in 60khz band. I think it is much easier to filter this out using band pass instead of high pass before subtraction, than transforming the square waves into sine ones.
Attachments

The sinc function
On matlab I do have the sinc instruction ready made, the problem with on line that I must prepare the script before hand and copy/past to change any parameter. So I found from a serious DAC manufacturer on line calculator, which rendering me perplex. ATX7006: DAC frequency response

The fc on the graph looks to be the Nyquist fs/2. But when I give on the calculator 22k for sample and 20k for signal, I get -20db. If I give for sample 44k I get -3db this is the good one, but if I ask for 22k the Nyquist that I should get very low I have about -4db!.
Where I am wrong?
On matlab I do have the sinc instruction ready made, the problem with on line that I must prepare the script before hand and copy/past to change any parameter. So I found from a serious DAC manufacturer on line calculator, which rendering me perplex. ATX7006: DAC frequency response
The fc on the graph looks to be the Nyquist fs/2. But when I give on the calculator 22k for sample and 20k for signal, I get -20db. If I give for sample 44k I get -3db this is the good one, but if I ask for 22k the Nyquist that I should get very low I have about -4db!.
Where I am wrong?
It looks to me like fc = fs and the calculated response is the response of a zeroth-order hold filter (uniform weighting over one sample period). Uniform weighting over 1/44100 s indeed gives only 3.92 dB of suppression at 22.05 kHz.
I understood my error from the AN837 document. I am dealing with both ADC and DAC response, The Sinc concerns only the DAC.
But still it is not clear to me how the ADC can transmit the Nyquist frequency that the DAC can covert it with some attenuation.
My delta-sigma, as it is fs/2 high pass + integrator, attenuating the image components by 1st order. After S/H 10khz has relative image of -12db, after the delta-sigma it is -30db.
This makes still more difficult to estimate the exact image subtracting filter I need.
I tried several measurements vs calculations not a single coincidence. Forgetting the Nyquist, the amplitude of images or the frequency levels nothing corresponding. I have all doubt about the Sinc function involved in this story. Sadly Tina cannot be used to check the LTspice's exactitude.
I want an opinion on this phenomena.
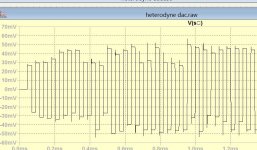
This is my sampling clock 44.1k perfect 50% duty cycle.

This is the response at Nyquist frequency 22.05k

I do have a notch yes? Where is this notch on Sinc function post 130, that should be the sampling frequency response?
All I understand, the Sinc function is used for interpolation based on Whittaker-Shannon method.
Whittaker–Shannon interpolation formula - Wikipedia
This is my sampling clock 44.1k perfect 50% duty cycle.
This is the response at Nyquist frequency 22.05k
I do have a notch yes? Where is this notch on Sinc function post 130, that should be the sampling frequency response?
All I understand, the Sinc function is used for interpolation based on Whittaker-Shannon method.
Whittaker–Shannon interpolation formula - Wikipedia
Last edited:
With the risk of telling you something you already know:
The equations of a Fourier transform and an inverse Fourier transform are actually rather similar. So similar that a rectangular impulse response corresponds to a sinc-shaped frequency response while a rectangular frequency response (brick-wall low-pass) corresponds to a sinc-shaped impulse response.
The figure in post #130 shows the sinc-shaped frequency response of a zeroth-order hold function, that is, a filter with a uniform impulse response of one sample period long. The sinc filter used in the sampling theorem has a sinc-shaped impulse response and a frequency response that falls off abruptly at the Nyquist frequency.
I looked up and down right and left, there is no any curve, transfer function, modulation equation that shows a notch at Nyquist. As you mentioned, all is based on the impulse Fourier transform which yields the sinx/x but the modulation function has been since Shannon forgotten to this day.
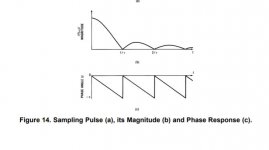
An excellent document from TI AN 236 An Introduction of the Sampling Theory, gives the magnitude (absolute of Sinc) and the phase, I don't have any phase shift on simulator up to 10khz.
https://www.ti.com/lit/an/snaa079c/snaa079c.pdf
An excellent document from TI AN 236 An Introduction of the Sampling Theory, gives the magnitude (absolute of Sinc) and the phase, I don't have any phase shift on simulator up to 10khz.
https://www.ti.com/lit/an/snaa079c/snaa079c.pdf
Attachments
Last edited:
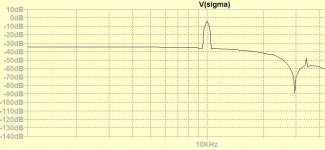
The DFT graphs in post #134 are so noisy I find it difficult to recognize any notch. I certainly didn't see one at 22.05 kHz.
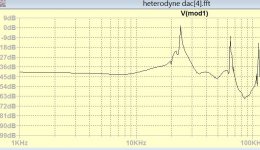
You can read the level in db -30db, 1v input 30-50mv after S/H. This is the pretending equation that it should follow, there is no any singular point at Nyquist.

This graph shows the signal and the image. Where is the Nyquist notch?

This graph shows the signal and the image. Where is the Nyquist notch?
Attachments
Last edited:
This is the first success in subtracting the image. I started by 10khz as it is out of the range of my quadrant phase shifter.

The image which originally from the sampler was -12db, my delta-sigma reduced it to -30db and now by radio technic I got it down to -50db and still adjusted grosso modo.
As the real magnitude phase of sampled wave has not been yet formulated correctly on this planet, I will proceed empirically, subtracting frequencies 10k.15k 17k and 20k individually then figure it out the require filtering.
Attachments
You can read the level in db -30db, 1v input 30-50mv after S/H. This is the pretending equation that it should follow, there is no any singular point at Nyquist.
View attachment 915621
This graph shows the signal and the image. Where is the Nyquist notch?
View attachment 915626
There isn't any, but why on Earth do you think there should be one?
- Home
- Source & Line
- Digital Line Level
- Analog Delta-Sigma interpolation DAC