Ah, hidden as light grey line! I've only looked to the sides of the graph.. well, live and learn 😀 Thanks!
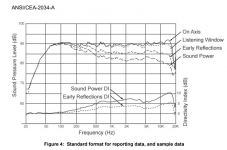
This is what it should look like, it is still compliant as long as the vertical scale for the DI is the same. It will almost always trend to zero at some point helping to identify where the 5 and 10 dB lines are meant to be, but Klippel helps by adding the dashed line.

Attachments
No, this has no relevance here.On another thread mabat hinted lumped compression driver model is coming to ATH, maybe comparable graphs are possible in the future.
- I never felt a need for the CEA-2034 style "summary" chart. Maybe some day I'll add it as an option but honestly I'm lazy to look it all up again. What would it bring in addition to what is already in the current report? The listening window and the "early reflection" stuff. That's all guaranteed for a good waveguide.
I could send you the calculations if you wanted to add it and that would help.Maybe some day I'll add it as an option but honestly I'm lazy to look it all up again.
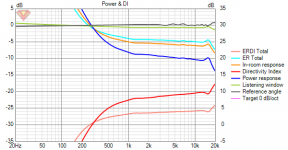
VituixCAD outputs something like that in the Power / DI window. I think member nc535 has imported some ATH generated sims into VituixCAD, not sure how? In addition visualizing the data in various ways one could test out the directivity with a measured woofer box before printing the waveguide.
Well the most flexibility is still via VACS (the visualization tool that comes as an ABEC complement) - all that is calculated is possible to export and process or import elsewhere. You are free do to just about anything with the data available...
Last edited:
Yeah, that would be very helpful, as I have all the data already available - all it needs is just to calculate the rest and present it in a report.I could send you the calculations if you wanted to add it and that would help.
VituixCAD outputs something like that in the Power / DI window. I think member nc535 has imported some ATH generated sims into VituixCAD, not sure how? In addition visualizing the data in various ways one could test out the directivity with a measured woofer box before printing the waveguide.
You export the data from VACS, preferably from a normalized set of polar curves unless you want to see raw which also works but just looks odd.
Then rename the 37 files to the format Vituix wants and add those as responses to a driver.
This is for the CE360.
I have attached my Advanced renamer 0-180 degree preset to automatically rename the files properly. Just Export the data from VACS as e.g. CE360_Hor_.txt
A number will be appended by VACS and the script will change it. Or you rename them all by hand each time 🙂
You may want to simulate to a low frequency to get a flat output that can then be filtered to represent the crossover slope. Otherwise Vituix interpolates and the curves go up as above.
Attachments
I'll get something ready for you, would you prefer the email on your ath site or PM from here?Yeah, that would be very helpful, as I have all the data already available - all it needs is just to calculate the rest and present it in a report.
I don't mind, choose what suits you best. Thanks!I'll get something ready for you, would you prefer the email on your ath site or PM from here?
That's pretty weird. I see you have to be careful when working with VituixCAD. Why would it modify the input data this way?...You may want to simulate to a low frequency to get a flat output that can then be filtered to represent the crossover slope. Otherwise Vituix interpolates and the curves go up as above.
When the data ends at 500Hz like in the example Vituix makes a best guess interpolation to make up the missing data down to 20Hz or whatever the frequency range was set to and just continues the slope upwards. The phase doesn't import properly either but that doesn't matter for the 2034 curves.
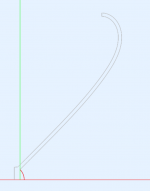
I wanted to show this in the other thread, mainly for the impedance, but perhaps it is more suitable here for showing what the vanes are supposed to be good for -
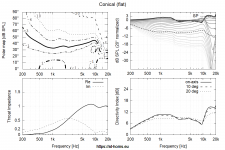
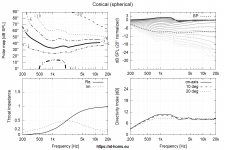
The following is a conical waveguide (1.4" throat, ⌀600 x 180 mm), driven with 1) a flat wavefront and 2) spherical wavefront. Notice the difference in the DI and beamwidth above 5 kHz. That's what the vanes should do one day 🙂
(This particular profile was not optimized in any way - it could still be improved considerably.)
Attachments
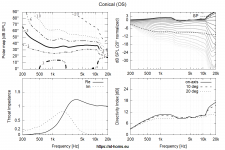
... with the throat changed to OS -
Attachments
Last edited:
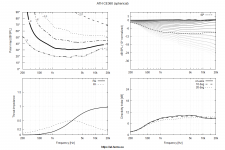
This is the CE360 modified for a spherical source. Quite interestingly, it would take some further tweaking in order for the beamwidth not to increase at high frequencies...
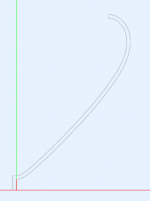
BTW, I still have this notion that the acoustic load could be increased within the vanes by making them expand slowly, while they could still form a spherical wavefront at the waveguide entrance.
BTW, I still have this notion that the acoustic load could be increased within the vanes by making them expand slowly, while they could still form a spherical wavefront at the waveguide entrance.
Attachments
Last edited:

This is the CE360 modified for a spherical source.
If only spherical sources existed we'd be all set!
- Home
- Loudspeakers
- Multi-Way
- Acoustic Horn Design – The Easy Way (Ath4)