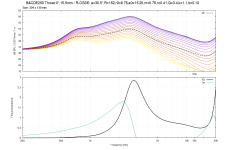
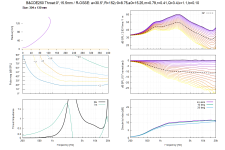
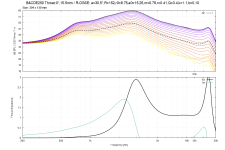
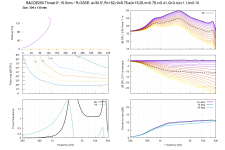
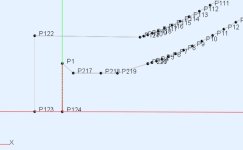
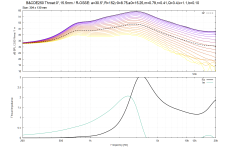
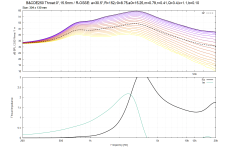
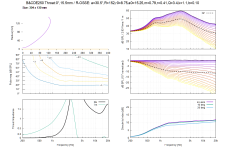
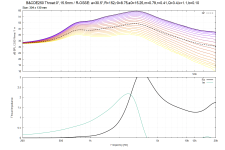
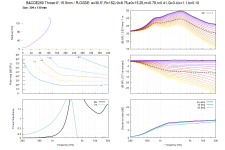
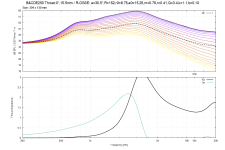
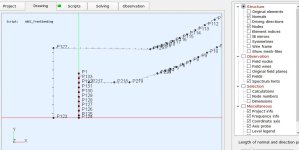
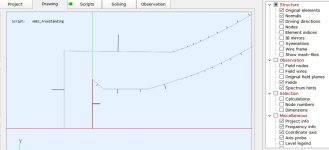
I simulated a few Throat Ticklers to show impact on impedence but wasn't able to use the waveguide I measured in REW because I had report problems - I'd get a Normalized Report instead of a Raw SPL Report over the Impedance Report. I think it might be because I used arcterm in that waveguide but I didn't troubleshoot to be certain. Consequently, I reverted to an earlier 30.5 degree waveguide I made in ATH 4.8.3.
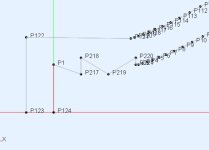
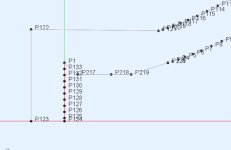
Simulations are for B&C DE250 compression driver, 30.5 degree waveguide. Zip File includes: 1) waveguide configuration file, 2) modified nodes.txt, 3) modified solving.txt, and 4) the custom raw SPL/impedance report. If you want to experiment with the throat tickler nodes they are located at the bottom of the "nodes.txt" file. I used ATH 4.8.3; gmsh-4.11.1-Windows64; 4.9.0 gnuplot.
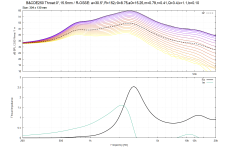
Here's the empty throat duct without modifications:
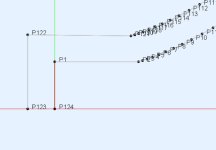
Duct expanded between 2mm and 10mm in length and 10mm diameter
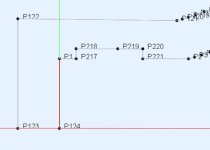
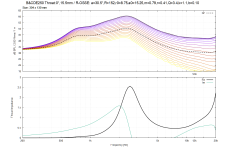
Duct expanded between 2mm and 10mm in length and 12mm diameter in the center
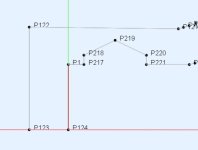
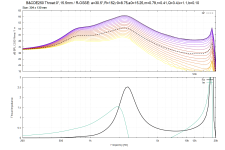
Duct expanded between 2mm and 10mm in length and reduced to 8.75mm diameter in the center
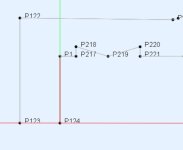
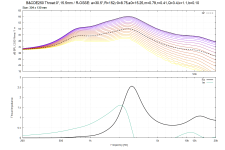
Duct expanded between 6mm and 14mm in length and 10mm diameter
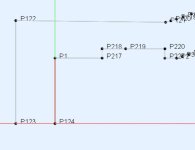
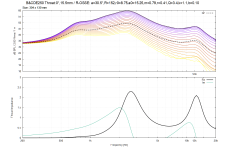
Duct expanded between 8mm and 10mm in length and 10mm diameter
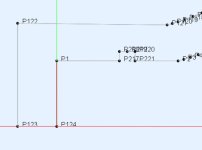
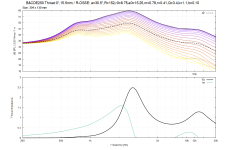
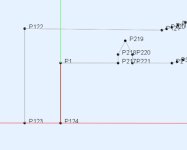
Duct expanded between 8mm and 10mm in length and 12mm diameter in the center
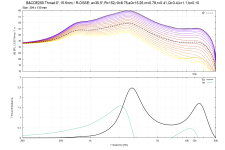
Simulations are for B&C DE250 compression driver, 30.5 degree waveguide. Zip File includes: 1) waveguide configuration file, 2) modified nodes.txt, 3) modified solving.txt, and 4) the custom raw SPL/impedance report. If you want to experiment with the throat tickler nodes they are located at the bottom of the "nodes.txt" file. I used ATH 4.8.3; gmsh-4.11.1-Windows64; 4.9.0 gnuplot.
Here's the empty throat duct without modifications:


Duct expanded between 2mm and 10mm in length and 10mm diameter


Duct expanded between 2mm and 10mm in length and 12mm diameter in the center


Duct expanded between 2mm and 10mm in length and reduced to 8.75mm diameter in the center


Duct expanded between 6mm and 14mm in length and 10mm diameter


Duct expanded between 8mm and 10mm in length and 10mm diameter


Duct expanded between 8mm and 10mm in length and 12mm diameter in the center


Attachments
I need to trouble shoot the waveguide I printed to see if I can get that one to show the raw SPL curve. But if I can't then maybe I can try to make the impedance curve look like these narrow waveguides and get a similar raw SPL that I can test with the microphone.
Before examining the reports further, I would check that the mesh resolution is high enough for this. Try to increase it to e.g. 80 kHz (just set MeshFrequency in solving.txt) and watch if there is a difference.
The results so far seem suspiciously smooth to me, but of course it's still possible due to the reduced throat radius.
The results so far seem suspiciously smooth to me, but of course it's still possible due to the reduced throat radius.
BTW, it's also possible to test the effect on higher order modes of the source:
Source.Contours = ::duct w00, w01, w02
Parameters w00, w01, w02 are the weights of the first three axisymmetric duct modes (0,0 - 0,1 - 0,2):

So to test the first mode only (0,1), it would be: Source.Contours = ::duct 0.0 1.0 0.0
But I suspect that in your case the cut-on frequencies will be already pretty high. Would be interesting to see anyway.
Source.Contours = ::duct w00, w01, w02
Parameters w00, w01, w02 are the weights of the first three axisymmetric duct modes (0,0 - 0,1 - 0,2):
So to test the first mode only (0,1), it would be: Source.Contours = ::duct 0.0 1.0 0.0
But I suspect that in your case the cut-on frequencies will be already pretty high. Would be interesting to see anyway.
Last edited:
Great, so it should be reliable. Yet one more thing - please check the orientation of normals. Those are set by the order of nodes when connecting into elements. All normals shall point inside the waveguide -

Last edited:
No, that doesn't seem correct but I don't know what can be wrong (haven't you forgotten to save the results?).
Never mind, I only hope it still works.
Never mind, I only hope it still works.
Yes, that's all correct. 👍
(Simply follow the order of nodes from the throat on and it will be correct...)
(Simply follow the order of nodes from the throat on and it will be correct...)
After all that, I don't really understand the benefit of modifying the impedance curve or what shape we should target. Is it primarily an advantage for passive crossovers?
I don't recall anyone mentioning that as a target. The throat impedance is just a clear indication of eventual reflections from within the device, reaching the source again. When it's clean and smooth, there are no such reflections in the device - that should be the target. Anyway, the impedance has only a mild effect on the resulting performace, as you have shown, after all. As long as the reflections are not too severe, all should be fine and eventually correctable via a simple EQ. The far-field polars are always the key result. That's where the Ring Plug shines.
Does this mean we can reduce larger compression drivers to smaller exit diameters (if they have a suitable conical throat exit)?
Potentially, at least. I still don't understand the source contours modes so maybe that prevents reducing a larger compression driver.
Potentially, at least. I still don't understand the source contours modes so maybe that prevents reducing a larger compression driver.
Of course! They can be noticeably improved by this, as you have shown with your examples. (Well, not the drivers, but the combinations with horns.)Does this mean we can reduce larger compression drivers to smaller exit diameters (if they have a suitable conical throat exit)?
The common conical exits just stand in the way for getting the best possible results. They can be "bypassed" however.
Actually, for a DIY there are not many excuses why not to do it anymore 🙂
Last edited:
- Home
- Loudspeakers
- Multi-Way
- Acoustic Horn Design – The Easy Way (Ath4)

