can anyone share an explanation of how to interpret the data in the graphs in Veleric's post?
Turk.
Us20060159293A1 patent has pretty much everything you need to know ,but it is rather long winded,and hard to decipher.
The trouble with a triangle is the panel area is very small compared to the long sides.
Steve
Us20060159293A1 patent has pretty much everything you need to know ,but it is rather long winded,and hard to decipher.
The trouble with a triangle is the panel area is very small compared to the long sides.
Steve
Hi Eric, I am a bit confused on what your FE results are showing? What are the color lines representing? Also what is the size of the FE groups that yo are using?
Many thanks in advance.
Cheers,
Steve
Many thanks in advance.
Cheers,
Steve
Pics
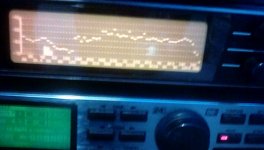
This is a very bad pic of a 1cm thick vh grade eps panel about 40 cm wide as you can or can't see because of the bad pic the fr from about 400hz to 16k is within plus and minus 2.5db ,I had forgot that I had done a lot of experiments with this panel which has reduced the hf from 20k,and I think it went down a lot lower,I'll have to have a look at the audiocircle site and check.
Had too many problems trying to take these pics noise,dogs,wife,me !!!
So am giving g up for now.
Steve
P.S.
The three blips in the response was me banging about.
Attachments
Last edited:
Hi Eric, I am a bit confused on what your FE results are showing? What are the color lines representing? Also what is the size of the FE groups that yo are using?
Many thanks in advance.
Cheers,
Steve
tagis (and turk),
Let me take a shot at a more in depth explanation. Without knowing your background(s)it's a little hard to know where exactly to start, but I'll take a stab in the dark and hopefully it helps.
There's a good introduction here:
Eigenfrequency Analysis
Note that they don't get to plates until about 3/4 down the page.
DML speakers are vibrating plates. And plates, like guitar strings, and drumheads, etc, have a certain set of "natural" (or preferred) frequencies that they prefer to vibrate with over other frequencies. These frequencies may be referred to as "resonances", "natural frequencies" or "eigenfrequencies". The set of natural frequencies of a plate will depend on the mechanical properties of the plate (primarily it's stiffness and it's weight per unit area), the dimensions of the plate, and how the plate is supported. By "supported" I mean basically how is the plate held in place. One type of support, for example, is hanging from strings. At the other extreme, the plate could be clamped along all four edges. So called "simple supports" are between those two extremes, and indicate essentially a hinge type support.
So a particular plate material, of a particular size, supported in a particular way, will have a particular set of natural frequencies, and each of those frequencies is associated with a specific vibration "mode", where "mode" basically means "deformed" shape. The link posted above shows the first six of the mode shapes for a simply supported rectangular plate, which correspond to the six lowest natural frequencies of vibration of the plate.
So far, a DML seems like a pretty bad idea. You want a device that produces a flat frequency response over a very broad range of frequencies, and to do that you choose a vibrating plate that only wants to vibrate at a few very particular frequencies? Sounds dumb.
Well, maybe it is (dumb, that is) and maybe it isn't. The first reason that maybe it's not so dumb is that at higher and higher frequencies there are more and more natural frequencies. Secondly, damping tends to spread out the natural frequencies somewhat so that particular modes can be excited at not just a single frequency, but rather over a range of frequencies. Even with damping, a particular mode is excited most effectively (and hence creates the most sound) at the associated natural frequency, but will still produce some level of sound at neighboring frequencies.
Hence, for sufficiently high frequencies, there are enough modes and associated natural frequencies, with enough overlap (due to damping), that it is possible to produce a relatively flat frequency response from a vibrating plate.
The bigger challenge is at low frequencies. At low frequencies, the natural frequencies are more spread out, at least in terms of natural frequencies per octave. And of course, below the lowest natural frequencies, there are necessarily no (i.e. zero) natural frequencies. So it's reasonable to expect that the lowest natural frequency effectively represents the lowest frequency (or nearly so) at which that panel can possibly be expected to produce much sound. Additionally, at low frequencies, where there are fewer natural frequencies (per octave) than at higher frequencies, it's reasonable to expect that the frequency response will be "lumpy" since there are simply not enough natural frequencies available to sufficiently overlap and fill the voids between them.
The NXT patents are partially built around the idea of maximizing the number of modes/frequencies at low frequencies (by choosing panels with particular "golden" aspect ratios) and positioning the exciters at locations to excite as many of those modes/frequencies as possible (i.e. the 2/5 rule).
Oh yeah, my plots. So the plots simply show how the set of natural frequencies changes for a particular panel when you go from a square panel (600 mm x 600 mm)to a tall skinny panel. The left edge of the plots (side length ratio of 1.0) represents a square panel. The dots at particular frequencies along the left edge of the plot are the natural frequencies of a square panel. In the plot for "Simple Supports on Long Edges" the lowest natural frequency is about 20 Hz. This suggests that about 20 Hz is the lowest possible frequency at which you could hope to have sound output with this panel. Of course, 20 Hz is plenty low, so that seems good, until you notice that there is a pretty big jump to the next lowest natural frequency, and then an even bigger jump to the next. Maybe that's not so good.
The far right of the plots (side length ratio = 4.0) represents a panel with the same total area, but a tall skinny one (300 mm x 1200 mm). Note that here the lowest natural frequency is quite a bit higher, at about 80 Hz. However, now the jumps between the first several of the lowest natural frequencies are much more evenly spaced along the vertical axis. This suggests the possibility that such a long, skinny panel might not be capable of producing output as low as the square panel, but might be able to produce a smoother frequency response in it's lowest octave, since it has relatively more, and more evenly spaced, natural frequencies at the low end.
The lines on the plots simply follow the natural frequency for a particular mode shape.
Finally, I should add this: As far as I can tell, having a panel with a fundamental frequency of "X" is a necessary, but by itself not sufficient, condition, to guarantee a panel capable of output down to "X". I'm still trying to sort out for myself the rest of the necessary conditions!
Hope that helps!
Eric
Veleric.
On top of all this going on on the panel ,the fact that you have a coil attached to the panel that is for the most part pushing the panel into pistonic mode all through the frequency spectrum,and the more powerful the exciter the more capable it is of overcoming the weight and air pressure at low frequencies.
This is of course is what a bmr does with the coil in the centre,large panels are not so easy to move ,and offsetting the exciter causes more interesting things to happen,there are so many variables.
The question is I suppose ,how much should,or do you want to ,push your panel into pistonic mode,is heavily driving a 6ft panel into a bendy type of piston a good idea,the same can be said for a 1ft panel.
Rigidity can also be a problem,I could go on,but the more you think about it The more complicated it gets.
Steve
Hi Eric,
Thanks for getting back to me on your measurements. I have some understanding of the theory behind DML as my background is in optical physics and have been working with laser cavities and their modes so O see what you are saying. It the dots and lines that are not gelling in my brain yet will have to do some more thinking of what they represent.
Here is a little more confusion to think about if one replaces the exciting mechanical oscillator with a noise source rather than a sinusoidal source and then try and factor the energy being loss is what is the acoustic output into the air (the acoustic impedance over the surface) it gets so messy that listening test probably make the most sense.
Again I may be rambling so thanks again for your explanation and response.
Cheers,
Steve
many thanks Veleric(Eric) that explanation was spot on, so how much does the overall shape of the panel affect things? or do other factors take precedence?
Turk.
I presume you haven't looked at the patent I posted yet,figs 3a to 3d should be of interest to you I would have thought.
Live long and prosper 🙂
I was thinking of the well known kef B 139 ,this unit could be used up to 1k if I'm not mistaken, can't imagine this not going into dml mode before this point,it would have been considered as cone brake up I would have thought.
this patent us3164221A looked interesting from about 1962 I think,and is shown in the previous nxt patent in fig 8 ,but in a different form but basically the same, probably where ABR came from maybe?
Anyway ,just thinking aloud.
Steve
Spedge you are right about the KEF B139's. KEF designed it as a bass driver and were surprised when it reached over 1kHz cleanly. One design at the time combined a KEF B139 with a Kelly Ribbon Horn tweeter with the XO set to 1kHz.
Burnt
Burnt
Burntcoil.
When I look at the BES Bertagni speaker patent ,I can't but help seeing an oversized B139 unit ,this is a good example of a dml being pushed heavily into piston mode at low frequencies.
Turk.
It's hard work I know,there are a lot of throw away comments that don't seem important ,but are,every time I re-read it I find more,it's all there but it's hard to decipher,for me anyway!
There was another patent with different shapes but i seem to have misplaced (wife deleted it probably) it!
Steve
Veleric.
On top of all this going on on the panel ,the fact that you have a coil attached to the panel that is for the most part pushing the panel into pistonic mode all through the frequency spectrum
Steve
The boundary conditions I was looking at (hinged on two or four sides) would pretty much eliminate any pistonic type motion, I expect. But certainly I can imagine the possibility that for less constraining boundary conditions there could be a pistonic mode, in addition to the bending modes the model predicts.
Eric
Hi Eric,
It the dots and lines that are not gelling in my brain yet will have to do some more thinking of what they represent.
tagis,
Maybe I can clarify about the dots and lines. Each set of vertical dots (at length ratios of 1.0, 1.5, 2.0, 3.0 4.0 etc) represents an aspect ratio for which I actually ran the calculations with the FEM. For all the other intermediate aspect ratios, I did not bother to run the model. Rather I just let Excel draw smooth lines connecting the dots between the aspect ratios that I actually did model. So the dots are actual model calculations and the lines between them are just curve fits.
You might notice for one graph I modeled an aspect ratio of 1.1 and for the other I modeled 1.3 instead, but that has no real significance.
Eric
Alright, but what does the line represent? Why are those dots connected? Same number of eigenfrequency? Like connecting all the first eigenfrequencies and then all the second and so on.tagis,
Maybe I can clarify about the dots and lines. Each set of vertical dots (at length ratios of 1.0, 1.5, 2.0, 3.0 4.0 etc) represents an aspect ratio for which I actually ran the calculations with the FEM. For all the other intermediate aspect ratios, I did not bother to run the model. Rather I just let Excel draw smooth lines connecting the dots between the aspect ratios that I actually did model. So the dots are actual model calculations and the lines between them are just curve fits.
You might notice for one graph I modeled an aspect ratio of 1.1 and for the other I modeled 1.3 instead, but that has no real significance.
Eric
Did you have air in this model?
I've been thinking about analysing this using COMSOL, both the eigenfrequency-part and a frequency-sweep (with resulting SPL-curves at different angles).
/Anton
Veleric.
Can we agree that if it wasn't for the exciter coil moving the panel back and forth in the exciter area there would be no dml produced, in the old days they used a violin bow to set the plates in motion.
It does not matter how you mount the panel ,you will not eliminate the forward and back motion which sends out the ripples through the panel (primary wave).
This also sets up the so called tin can effect that tectonic mention in their videos, another problem no one gives a single thought to that I have seen.
I also noticed that tectonic panels don't have the corners rounded ,maybe because they are mounted near the corners?
Steve
Alright, but what does the line represent? Why are those dots connected? Same number of eigenfrequency? Like connecting all the first eigenfrequencies and then all the second and so on.
If I'm not wrong it's just an interpolation of the underlying model based on the given datapoints. So you get an idea where the specific eigenfrequencies for "all" the different aspect ratios between 1 and 4 are.
Alright, but what does the line represent? Why are those dots connected? Same number of eigenfrequency? Like connecting all the first eigenfrequencies and then all the second and so on.
Yes, exactly. Lines follow the same mode.
Did you have air in this model?
No.
- Home
- Loudspeakers
- Full Range
- A Study of DMLs as a Full Range Speaker