Christian.
Is there any chance of a photo of you test setup with microphones in position, just to give a better idea of your measurement results.
Just in case I have misunderstood what you are doing.
Steve.
Is there any chance of a photo of you test setup with microphones in position, just to give a better idea of your measurement results.
Just in case I have misunderstood what you are doing.
Steve.
Christian,Hello Eric
I see my explanations were not fully clear and I should have added more pictures.
So :
- yes the basic idea is to measure the delay between the signals of the 2 microphones
- the formula you mention is what I expected by the theory of bending waves in a plate
- after having the IR, I apply to them a band-pass filter to limit them in frequency
- it is between the IR band-pass filtered I measure the delay, not between the raw IR which are for sure broadband
- when I plotted the delay as a function of the central frequency of the band pass filter, I didn't get what is expected from the theory but something "erratic".
Something is wrong somewhere.
Now I see. Thanks for that explanation, Your idea makes sense to me. But I see what you mean that the results were erratic. I don't have a guess as to the reason for the erratic result.
I am curious, I must admit, about exactly what was your objective when you made this measurement. That is, what exactly did you want to measure, and for what purpose? Was it just a matter of curiosity? As in, "Hey, I have these tools which should enable me to to this test, and it should work like this...I should try it and see if it does"? Or was there something more specific you wanted to know? For example, if it had worked out, you should have been able to use the results to calculate the ratio of B/m (stiffness/areal density), from which you could then calculate Fc, for example. What were you aiming at, if anything?
Eric
@spedge
@Veleric
Unfortunately, I have no pictures of this test set up... but you will find attached a hand drawing to visualize it.
The aim of this test was to try to measure what happens away from the exciter :
Christian
PS : when I started to read about DML, I was surprised that the exchange of experiences was not based on the comparison of the m (areal density) and B (stiffness) which are according to the theory the basic data. I tried to collect some. To measure m it is easy, the evaluation of B for not too small panels is possible. My initial target for m is between 600 to 800g/m² (low m gives a better efficiency but the membrane is then more transparent). For B or perhaps more precisely the ratio B/m or m/B I have no target as I don't know where to place the Fc.
As I mentionned in the post about my first test of a canvas (and my wife agree, up to now we prefer the plywood panel) we don't have with it (at least in the one I built) the very fast transient neither the image, the sound scene. This canvas seems to have another m, B/m balance... so is it the reason?
I can share (need some preparation) how to evaluate B and graph of m and B for different materials. Let me know if you want I post it (pretty sure of the answer!)
@Veleric
Unfortunately, I have no pictures of this test set up... but you will find attached a hand drawing to visualize it.
The aim of this test was to try to measure what happens away from the exciter :
- how is the attenuation with the distance (which I see I don't have extract...) and then to estimate when a panel becomes to large (no more energy far from the exciter)?
- does the reality fit with the thin plate theory?
- how long it take for the wave to reach this point and then is it possible to evaluate B (I have a basic method to evaluate B in static in the larger dimension of a rectangular panel)
- is it possible to observe the reflections coming back the edges (I am fan of the "pebble in the pound" image) and how dead or adapted is the suspension?
Christian
PS : when I started to read about DML, I was surprised that the exchange of experiences was not based on the comparison of the m (areal density) and B (stiffness) which are according to the theory the basic data. I tried to collect some. To measure m it is easy, the evaluation of B for not too small panels is possible. My initial target for m is between 600 to 800g/m² (low m gives a better efficiency but the membrane is then more transparent). For B or perhaps more precisely the ratio B/m or m/B I have no target as I don't know where to place the Fc.
As I mentionned in the post about my first test of a canvas (and my wife agree, up to now we prefer the plywood panel) we don't have with it (at least in the one I built) the very fast transient neither the image, the sound scene. This canvas seems to have another m, B/m balance... so is it the reason?
I can share (need some preparation) how to evaluate B and graph of m and B for different materials. Let me know if you want I post it (pretty sure of the answer!)
Attachments
Me too. Back in 2019 (post 599 in this thread), I tried to initiate a conversation about the significance of B and m but no one was interested. Geosand raised some good points in reply (about things other than B or m), but no one else even replied.PS : when I started to read about DML, I was surprised that the exchange of experiences was not based on the comparison of the m (areal density) and B (stiffness) which are according to the theory the basic data.
Eric
Unfortunately, I have no pictures of this test set up... but you will find attached a hand drawing to visualize it.
The aim of this test was to try to measure what happens away from the exciter :
So any additional observation that should help in comparing, designing those bending wave panel that sound so good!
- how is the attenuation with the distance (which I see I don't have extract...) and then to estimate when a panel becomes to large (no more energy far from the exciter)?
- does the reality fit with the thin plate theory?
- how long it take for the wave to reach this point and then is it possible to evaluate B (I have a basic method to evaluate B in static in the larger dimension of a rectangular panel)
- is it possible to observe the reflections coming back the edges (I am fan of the "pebble in the pound" image) and how dead or adapted is the suspension?
Good questions! If you manage to find ways to test that seem to answer those questions, please continue to share your methods.
I'm not super pressed about the peaks and dips as I can EQ those out. The square panel shape is something I didn't factor in as problematic; I should have went with the 1:1.6 ratio that's recommended.Hello Cheapvega,
DMLs are in the same family than OB or other panels : the back is opened, the wave from the back bounces on the wall behind the panel and comes back. The standard recommendation is to have 1m free behind... which is often not possible. In your case you are even below the 30cm with something like 10cm. It is what Robixxx1 answered to your question in an other thread. It might be reason of the peak at 400Hz. For the hole at 300Hz, I think more investigations are needed. At least a measurement without the sub and perhaps in several listening points.
For sure , there are several elements in your design that make it challenging :
There are suggestion in previous posts to limit the effect of the close back wall with absorber glued on the panel (Burntcoil 993) and the use of "Magic sponges" (I don't know this materiel!)
- the low distance to the ceiling
- the square shape of the panels (high symmetry concentrates the problem in few frequencies)
- two exciters. One can expect effects on the treble
So I don't think you won't have better results with OB. The way seems in the understanding of the effect of the room boundaries and perhaps the interactions between the panels (you said 4?).
Why 4 panels instead of 2 lager one? Some in other posts seem happy to have left and right exciters on the same physical panel which make sense thinking about DML : the membrane and the baffle are the same part.
Christian
Right now I only have 2 panels active so the interactions aren't a factor. I will have to re-EQ when I wire the other 2 up. My main objective with moving to OB is to get the ceiling speakers to reach down lower without losing a ton of off-axis dispersion.
I just had a silly thought that might solve all my problems........ I can keep my panels as is and just add a small OB baffle for the woofers. Again a very inelegant solution but a potential solution nonetheless.
To measure m it is easy, the evaluation of B for not too small panels is possible. My initial target for m is between 600 to 800g/m² (low m gives a better efficiency but the membrane is then more transparent). For B or perhaps more precisely the ratio B/m or m/B I have no target as I don't know where to place the Fc.
As I mentioned in the post about my first test of a canvas (and my wife agree, up to now we prefer the plywood panel) we don't have with it (at least in the one I built) the very fast transient neither the image, the sound scene. This canvas seems to have another m, B/m balance... so is it the reason?
I can share (need some preparation) how to evaluate B and graph of m and B for different materials. Let me know if you want I post it (pretty sure of the answer!)
Christian,
Concerning B, I use a very crude three point bend test to estimate it. I could certainly make a better measurement of B if I used the Instron machine at work but so far I have not bothered to do that. Are you doing something similar to measure B?
Regarding the right target for Fc, I have given it a lot of thought, but still am not sure of the right answer. For a long time, I was focused mainly about improving efficiency, which mainly requires high B and low m, and therefore a low Fc. So I was basically thinking that the Fc should be as low as possible, limited only by how large the panel had to be for it to reach down to say, 160 Hz or so.
But, at frequencies above Fc, theoretically, the off axis radiation could be too much. And some panels with high B/m could easily have an Fc of 2000 Hz or lower, smack in the middle of the audible range. So lately I've been wondering if Fc should perhaps be targeted higher, maybe even above (just barely) the audible region (or at least, above MY audible region, which is close to 11 kHz). What are your thoughts on this?
What do you mean by "low m gives a better efficiency but the membrane is then more transparent"? Especially, what do you mean by "transparent" in this context? It sounds like maybe you think it is a bad thing.
Eric
Trying to determine the correct equations and parameters took NXT Researchers millions of dollars over several years to figure out. The best most of us can do is simply understand the parameters and make best guesses as to what seems to work best based on all the research that is available.
By the way, a paper published by Azima (more of a marketing paper for NXT, but also published in Audio magazine in the 1990's (yes the Audio article is available via google as well) gives the above info as well as a few tips on the how and why a DML works. Its easy reading and may give you more insights:
21st-NXT/Azima
Veleric.
As you say, geosand made some good points in his reply(post 600) with all those millions of dollars ,no perfect panel was produced ?
Computer generated graphs showing waves moving through a material does not tell you how it sounds.
Dml is a very complicated yet simple .
Soundboards have been around for many many years , with only our ears to tell us what works and what does not, but NXT couldn't sell us that !
Although the link to Azima is one of easier reads ,and explains dml quite well.
Steve.

Eric, I remember now your try...Me too. Back in 2019 (post 599 in this thread), I tried to initiate a conversation about the significance of B and m but no one was interested. Geosand raised some good points in reply (about things other than B or m), but no one else even replied.
Eric
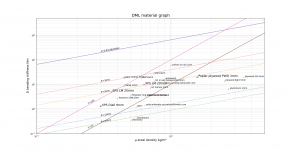
You will find attached a graph I made plotting the DML materials I crossed while reading or testing in m, B axis. I added some lines to see where are those materials in Fc, needed area to reach low freq or some B/m^3 (=T)
In my documents D is for B and µ for m.
I copy here below the list of materials (list1 was collected in readings, list2 in my own tests)
If somebody likes python script, I attach it (change .txt to .py extension; need numpy and matplotlib)... but helping to learn how to use a python script is out of scope (thank you for your understanding). Something similar can be done with excel, OpenOfficeCalc
To come back to you post 599, I think you had the basics :
- f0 (lowest frequency) is driven by B/m
- fc (coincidence frequency) is driven by m/B
- efficiency is driven by B/m^3 (here is link to piano sound board thesis )
I am convince that keeping an eye on those values should help while testing or comparing realizations (ie for panels made from XPS, EPS or plywood).
Lists from the script
material_list1 = [('NXT?', 0.55, 1.2), #(material, µ kg/m², D Nm)
('unknown2', 0.5, 0.33),
('unknown4', 0.6, 18.),
('balsa 3mm', 0.45, 8.4),
('plywood std 5mm', 3.5, 19.5),
('plywood light 5mm', 2.5, 13.7),
('aluminium 1mm', 2.7, 6.4),
('foamboard', 0.55, 0.4),
('paper nomex 5mm', 0.44, 18.4), # Podium?
('GF nomex 3mm', 0.7, 7.), # Loudspeaker-and-headphone-handbook-third-edition
('unknown3', 0.74, 26.6), # https://ir.nctu.edu.tw/bitstream/11536/27128/1/000188195100016.pdf
('unknown5', 0.89, 16.2), # 5mm honeycombe like polycarbonate core with thermoplastic skin, http://www.ipcsit.com/vol49/018-ICITM2012-DE0011.pdf
('glass on polycarbonate core', 0.89, 10.4), # https://patentimages.storage.googleapis.com/84/f3/0a/9cc2410c81ae28/US6553124.pdf
('carbon on alu core', 1., 57.6),
('polycarbonate on polycarbonete core', 0.64, 1.39),
('Carbone on Rohacell', 0.65, 3.33),
('Tectonics DML100?', 0.4, 2.6), # Extrapolated from Tectonics DML100/500 tech specs
('Polyester imp. paper honeycomb', 0.5, 3.4), # Allicante University https://www.researchgate.net/public...f_multi-exciter_distributed_mode_loudspeakers
('GF on alu honeycomb 4mm', 0.75, 13.5) # high-performance-loudspeakers-optimising-high-fidelity-loudspeaker-systems-7
]
material_list2 = [('XPS LM 20mm', 0.63, 9.9), #LM=LeroyMerlin (french DIY store)
('XPS Diall 9mm', 0.3, 1.3), #Diall=BricoDepot/Castorama brand (french DIY store)
('EPS LM 20mm', 0.36, 4.95),
('Poplar plywood PWD 3mm', 1.57, 19.6)
]
Attachments
Eric,Christian,
Concerning B, I use a very crude three point bend test to estimate it. I could certainly make a better measurement of B if I used the Instron machine at work but so far I have not bothered to do that. Are you doing something similar to measure B?
Regarding the right target for Fc, I have given it a lot of thought, but still am not sure of the right answer. For a long time, I was focused mainly about improving efficiency, which mainly requires high B and low m, and therefore a low Fc. So I was basically thinking that the Fc should be as low as possible, limited only by how large the panel had to be for it to reach down to say, 160 Hz or so.
But, at frequencies above Fc, theoretically, the off axis radiation could be too much. And some panels with high B/m could easily have an Fc of 2000 Hz or lower, smack in the middle of the audible range. So lately I've been wondering if Fc should perhaps be targeted higher, maybe even above (just barely) the audible region (or at least, above MY audible region, which is close to 11 kHz). What are your thoughts on this?
What do you mean by "low m gives a better efficiency but the membrane is then more transparent"? Especially, what do you mean by "transparent" in this context? It sounds like maybe you think it is a bad thing.
Eric
I will be happy to read about your method to evaluate B. You will find attached how I proceed. This kind of things were part of my education (to get my degree) but it was a long time ago now and never used since so do not hesitate to tell me if I am wrong.
About fc, I have the same thoughts... with no conclusions. From the graph posted just before, fc seems not being above 10kHz (may be not feasible...). I am happy with the plywood panel, like I think other builder with plywood. 3mm poplar plywood like XPS 20mm often used or EPS 20mm have a 5kHz fc (at least evaluated like this). A little above make sense as you mentionned but then the trade off with the area to reach the low frequency is perhaps not keep.
For the efficiency, I wouldn't go for m above the one of the 3mm poplar plywood.
About low m, I have no real facts but you are right, I am suspicious. I read from a Focal paper about their linen sandwich membrane material that they targeted 0.6kg/m² and I am still wondering about my 2nd prototype made from 9mm sort of XPS (0.3kg/m²) which gave bad results. I wonder if there is a bad effect of the rear wave that could pass through the membrane with a too high level. Only thoughts
Christian
Attachments
Hi Steve,Veleric.
As you say, geosand made some good points in his reply(post 600) with all those millions of dollars ,no perfect panel was produced ?
Computer generated graphs showing waves moving through a material does not tell you how it sounds.
Dml is a very complicated yet simple .
Soundboards have been around for many many years , with only our ears to tell us what works and what does not, but NXT couldn't sell us that !
Although the link to Azima is one of easier reads ,and explains dml quite well.
Steve.
Chaos on the whole surface or a wave propagating gently from the exciter to the edges without bouncing... what gives us the sound we expect?
Since my beginning with those panels I have been in difficulty with a representation in steady state. There is perhaps something I don't understand between DML and bending wave panel. In his interview for 6 moons audio shelley Katz (Podium designer) says the Podium are not on the NXT patents. What about the panels we build?
Christian
It still baffles me that NXT patented something that has been around for a long time.
although I'm not sure if the patent was on the idea of the panel or the dml prediction software ?
Steve.
although I'm not sure if the patent was on the idea of the panel or the dml prediction software ?
Steve.
Chistian.
Thank you for your drawing.
When I have taken very close measurements (1or2cm) in front of the coil area ,this is mainly to find out what the exciter and panel surface is actually producing or should I say outputting.
this area is pistonic in nature it is a pulse or the primary drive of the panel.
I always think of this as being like having a full range cone driver which starts the panel in motion(and yes I know it's not a cone driver).
If the surface and exciter are a good match you should have a full flat ish response from about 20hz to 20k in this area.
This will produce a wave that will move across the panel .
So when you measure the exciter area you are measuring the exciter .
And when you measure the single point or dot on the panel,you are measuring the output at that single point ,not of the whole panel (not forgetting it is a wave).
Once you get any reflections from the edges (which it looks like you maybe getting the further down the panel you go)
Your panel will start to look like fig2 in the Azima link posted by geosand post 600.
You can see that the panel is in and out of phase with itself, and at varying states inbetween.
If you move the microphone by only an inch of so the response will change from + to - and somewhere inbetween, it is chaotic in nature.
This might be the reason you are not getting the responses you are hoping for ?
When measuring the response from my seating position I use peak hold and move the microphone from left 2ft to right 2ft and up and down for a better average.
This will give a more accurate response of what is going on in that area.
a single point measurement in this area may look bad ,but as before with the near field response moving the microphone by only a little can make a great difference.
a dip in response can disappear within a few inches.
I hope that's enough for now.
it's getting late.
Steve.
Christian.
I just weighed my 2mm 3 core 6x4inch ply panel I used for my canvas panel.
It was between 16g to 17g ,I think the core material is supposed to be balsa and the outer is another type of wood ?
It is very rigid and hard to flex, 2 ply balsa may not be rigid enough ?
My art panel if I remember correctly ,had quite a large hump in the response below about 100hz to the sharp roll off at 40hz.
Also the measurement of the panel before I attached it to the canvas was pretty much the same from 20k down to about 400hz where the panel rolls off.
The canvas helps the ply fill in the response below the 400hz point.
Because of the ply used it will have a similar sound to the larger ply panels I have used but maybe slightly more damped by the canvas and glue?
Steve.
Steve.
Hello Steve,It still baffles me that NXT patented something that has been around for a long time.
although I'm not sure if the patent was on the idea of the panel or the dml prediction software ?
Steve.
Agreed. Sound board is not new think.
I just went quickly through BuntCoil's patent list in post 1458 (very usefull, thank you Burntcoil), NXT patents mention "method and panel..."; a bit difficult for me to read the english of patent. It seems the basics of the patent is in the method, the few parameters used to describe a panel which are the input of the software.
If somebody had a careful reading... welcome.
One good point in the paper you reminded is how the force of voice coil in used in a pistonic loudspeaker (basically against the whole membrane mass) compared to the DML where the voice coil sees the mechanical impedance of the panel leading to a larger bandwitdth. I don't have the time right now to show them but I made measurements to compare the canvas to an identical size OB made with a standard full range... the canvas is a real full range.
Christian
My intention by measuring a single point was to see what happens at this point (for sure the whole response comes from the wave created) like its delay from the exciter and to see if bounces can be observed.Chistian.
Thank you for your drawing.
When I have taken very close measurements (1or2cm) in front of the coil area ,this is mainly to find out what the exciter and panel surface is actually producing or should I say outputting.
this area is pistonic in nature it is a pulse or the primary drive of the panel.
I always think of this as being like having a full range cone driver which starts the panel in motion(and yes I know it's not a cone driver).
If the surface and exciter are a good match you should have a full flat ish response from about 20hz to 20k in this area.
This will produce a wave that will move across the panel .
So when you measure the exciter area you are measuring the exciter .
And when you measure the single point or dot on the panel,you are measuring the output at that single point ,not of the whole panel (not forgetting it is a wave).
Once you get any reflections from the edges (which it looks like you maybe getting the further down the panel you go)
Your panel will start to look like fig2 in the Azima link posted by geosand post 600.
You can see that the panel is in and out of phase with itself, and at varying states inbetween.
If you move the microphone by only an inch of so the response will change from + to - and somewhere inbetween, it is chaotic in nature.
This might be the reason you are not getting the responses you are hoping for ?
When measuring the response from my seating position I use peak hold and move the microphone from left 2ft to right 2ft and up and down for a better average.
This will give a more accurate response of what is going on in that area.
a single point measurement in this area may look bad ,but as before with the near field response moving the microphone by only a little can make a great difference.
a dip in response can disappear within a few inches.
I hope that's enough for now.
it's getting late.
Steve.
I probably go to fast and not deeply enough by not trying to figure out what would be the delay and time for bouncing from what we know from the panel. something to investigate in the next weeks?
Thank you for mentioning your measuring method. You have perhaps already explained it in previous post. Currently I use 3 different methods :
- Moving Microphone Measurement : a Pink noise is played, the microphone is moved all over the listening area. REW gives the average spectrum
- Single point IR with REW
- Multiple IR. It is a kind of mix of the previous methods. 27 short logsweep are played. During a logsweep the mic is at a fixed position and then move to a next one during the silence between 2 logsweep. At the end I got several IR than can be average or not to have an overall view.
Could you tell us (or remind) more about your method? pinknoise? peak and hold = keep the peak or has a certain releasing time? 1/3rd of octave? Is it the spectrum analyzer from a DEQ?
Christian
Thank you SteveChristian.
I just weighed my 2mm 3 core 6x4inch ply panel I used for my canvas panel.
It was between 16g to 17g ,I think the core material is supposed to be balsa and the outer is another type of wood ?
It is very rigid and hard to flex, 2 ply balsa may not be rigid enough ?
My art panel if I remember correctly ,had quite a large hump in the response below about 100hz to the sharp roll off at 40hz.
Also the measurement of the panel before I attached it to the canvas was pretty much the same from 20k down to about 400hz where the panel rolls off.
The canvas helps the ply fill in the response below the 400hz point.
Because of the ply used it will have a similar sound to the larger ply panels I have used but maybe slightly more damped by the canvas and glue?
Steve.
Steve.
I see you pad is closer to the first one I cut before being afraid by its weight! Seems more plywood from a light wood (poplar? basswood?) than balsa. I saw from a famous internet site small sheet of plywood called "balsa" which are not balsa.
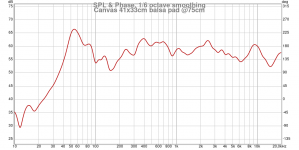
The panels I built has its resonance at 55Hz. A little bit higher what you get (my pad is lighter, the tension of the canvas is quite high). See FR below (at 75cm on axis)
At the moment, I think 3mm plywood is too heavy and perhaps a bit too stiff. The mix thinner plywood plus fabric seems promising would be the next?
Christian
Attachments
Christian.
When I ordered base wood from Amazon they sent me ply .
It looked very similar to the small 4x6inch ply I already had accepted larger.
I was tempted to keep it and use it but I was so annoyed !!
I sent back the order and complained about wasting my time .
they said they would look into it ,but The site is still selling the product .
I looked at other sellers but when I looked closely at what they were selling , it was also ply ?
I gave up in the end and continued testing the veneer I had at hand.
as you say the canvas panel is a good full range panel ,as long as you do not place it up against the wall !
Unless you toe them out from the wall , as demonstrated in my recordings of the panel close to walls.
This would be my choice if I was using them full range, I might even have them hinged on the side wall and swing them out when I wanted to listen to them ? Or even the ceiling ? And obviously the front wall of course.
But as I use my tls for the low end duties below 300hz I will stick to my various ordinary dml panels for my main system.
Steve.
Christian,I will be happy to read about your method to evaluate B. You will find attached how I proceed. This kind of things were part of my education (to get my degree) but it was a long time ago now and never used since so do not hesitate to tell me if I am wrong.
Your method of measuring D (i.e. B) is equivalent to mine. I simply use a three-point bending geometry, instead of the cantilever beam that you use. That is, instead of the cantilever geometry, I use the geometry shown here:
http://mi.eng.cam.ac.uk/IALego/bender_files/bend_theory.pdf
For this case, the equation is the same except the constant needed is 48 (in place of 3). The only reason I slightly prefer the three-point method over the cantilever methods is that I think it's a little harder to be sure you have a true cantilever. But either method should give the same result if done with a little care.
Also, as I suspect you know, for some materials you can easily calculate D.
For example, for a homogeneous, isotropic material:
D=Et^3/12, where E is the elastic modulus and t is the panel thickness. For materials whose modulus you can easily find in a textbook or reliable internet reference, this should work well.
For a sandwich composite with skin layers of equal thickness on both top and bottom you can use this:
D= (2/3)(E1)f^3+(2/3)(E2)h^3+2(E1)fh(f+h)
where E1 is the elastic modulus of the skin(i.e. face) layers and E2 is the elastic modulus of the core layer. Also, f is the face thickness and 2h (yes 2h, not just h) is the core thickness.
if I've typed correctly, this matches the first (least simplified) equation in the wiki link:
Sandwich theory - Wikipedia
Eric
- Home
- Loudspeakers
- Full Range
- A Study of DMLs as a Full Range Speaker