I would try lateral first reflection points, across the room corners and behind the listening position if there is wall close behind.
Take some measurements and look at the ETC and early decay plots to see the effect.
Adding to the above: the side wall first reflection points, as well as the wall behind the listener gets reflections with the high frequencies,
the wall behind the speakers will get the 'omni' frequencies, but not the higher frequencies at full force.
You can guess the positions of first reflections using their 'ray' behavior, meaning if you would place a mirror flat on the wall and see the speaker reflecting from your listening spot, that's about where to expect the biggest reflection. While seting up your measurement equipment in the listening spot, zoom in on the first ~20 ms of the IR and spot the peaks behind the main pulse. The first appearance of those peaks are the best to remove using the panels. Which could very well be the wall behind the listening spot. The panels in the picture seem a bit too close together. Placing them just a little wider out on both sides would make sense, if they are big offenders (which I doubt).

Yes, panels are OK, but small in comparison with total surface of the walls. Plus you have tiles on the floor, everything highly reflective.
Just buy some nice additional furniture, one of those thick fluffy carpets of large surface and things will go into acoustically much better direction....small rounded wooden table and tabure pieces for sitting do wonders to scatter and absorbe reflections between you and speakers.
Measure empty room and then filled room and you will see large difference in middle frequencies....
So I did some experiments today. My sonar works mic cable got damaged so I had to adjust with my MiniDSP UMIK-1 which has a problem with a little too much tilt down at higher frequencies.. 😀
But still, there are a few interesting observations (I measured only the right speaker seen in the pic with the big absorber panels positioned at the best locations in terms of measurements I got)
1) A good, thick carpet will make some measurable difference in this room, as many of you have pointed out.. 🙂
I just placed a relatively thin foldable mattress on the floor, as shown below and it shows some good trends.

ETC showing the effect of that mattress (/carpet). The mattress attenuates the first peak in ETC and helps with some absorption at mid to high frequencies.

Spectrogram (with no mattress)

Spectrogram (with mattress)

2) The panels seem to be more effective placed at 1st reflection points than both of the panels behind the speakers. Due to the toe in of the speakers some absorption happens due to the panel at back wall also, I think
3) Some absorption at the back of the sofa might help (For the experiment, I used only 1inch thick basotect panels, but a better thicker panel might help more, I think)
I cannot bring in much new furniture due to the rented house from which I may move soon. But I need to buy a good carpet and a few more manageable size/ wall-hangable acoustic panels.. 😀
That is all I have for now. I need to do some more experiments with panel positioning and then start with using the DRC software.. 🙂
But still, there are a few interesting observations (I measured only the right speaker seen in the pic with the big absorber panels positioned at the best locations in terms of measurements I got)
1) A good, thick carpet will make some measurable difference in this room, as many of you have pointed out.. 🙂
I just placed a relatively thin foldable mattress on the floor, as shown below and it shows some good trends.
ETC showing the effect of that mattress (/carpet). The mattress attenuates the first peak in ETC and helps with some absorption at mid to high frequencies.
Spectrogram (with no mattress)
Spectrogram (with mattress)
2) The panels seem to be more effective placed at 1st reflection points than both of the panels behind the speakers. Due to the toe in of the speakers some absorption happens due to the panel at back wall also, I think
3) Some absorption at the back of the sofa might help (For the experiment, I used only 1inch thick basotect panels, but a better thicker panel might help more, I think)
I cannot bring in much new furniture due to the rented house from which I may move soon. But I need to buy a good carpet and a few more manageable size/ wall-hangable acoustic panels.. 😀
That is all I have for now. I need to do some more experiments with panel positioning and then start with using the DRC software.. 🙂
Last edited:
Great progress. I like that you are attempting to measure what you hear.
Sometimes what I hear makes such a dramatic difference I get lost in listening to music, and never follow-up and measure again. But that is not the scientific method. My lazy method.
Try putting the centre acoustic panel landscape-wise, and at the level of the tweeter/midrange, if you only have one panel.
If I could count the number of times I've done the same 😉Sometimes what I hear makes such a dramatic difference I get lost in listening to music, and never follow-up and measure again.
Now and then I have and it's changed the way I do things. Like the time I designed a tweeter waveguide to cut the ceiling at -3dB. When it came time to make the next iteration I went axisymmetric and used a cloud. The first simple cloud I made cut the lower tweeter frequencies by 2dB more than the previous waveguide, and the device was smaller and more accurate geometrically.
Not that it matters but I find it easier and more helpful to look at the ETC in dBFS rather than percentageETC showing the effect of that mattress (/carpet). The mattress attenuates the first peak in ETC and helps with some absorption at mid to high frequencies.
Hi fluid,Not that it matters but I find it easier and more helpful to look at the ETC in dBFS rather than percentage
Here is the same data as above in dBFS:
Please let me know if any additional insights can be got from this plot?
The panels are knocking the 2ms reflection down by 10dB which is good and keeps it less than 20dB below the main peak. The next candidates would be at 5.5ms and 10 to 12ms.
My aim was to be at -20dB or below for at least the first 15ms. If you stretch the vertical scale it will be easier to see as 120dB of range in the graph will make things look flatter.
My aim was to be at -20dB or below for at least the first 15ms. If you stretch the vertical scale it will be easier to see as 120dB of range in the graph will make things look flatter.
Thanks @fluid.. 🙂
Below is the zoomed-in graph for completeness

Is there an easy way/a calculator sort of thing to identify which surfaces contribute to all these reflections based on room geometry? (Just to avoid working out manually/pen and paper analysis) 🙂
Does VituixCAD room tab help in this?
Below is the zoomed-in graph for completeness
Is there an easy way/a calculator sort of thing to identify which surfaces contribute to all these reflections based on room geometry? (Just to avoid working out manually/pen and paper analysis) 🙂
Does VituixCAD room tab help in this?
For each 1ms there is 344mm of path length difference, so either pen and paper or getting a tape measure / piece of string and adding on the extra distance to see which surface could account for it, Vituix has Auxiliary calculators that can help, window length would tell you floor and or ceiling delays and the wavelength can work out the distance based on ms just put it in the full wavelength box.Is there an easy way/a calculator sort of thing to identify which surfaces contribute to all these reflections based on room geometry? (Just to avoid working out manually/pen and paper analysis) 🙂
Does VituixCAD room tab help in this?
Every now and then, I too, get a feeling like that.. 😀Sometimes what I hear makes such a dramatic difference I get lost in listening to music, and never follow-up and measure again.
Like the speakers sound nice, why not just listen to more music and leave it at that.
But I don't stop these ever continuing experiments because of the fear of stopping of all these interactions, all this learning, and all these chances to communicate with like-minded, knowledgeable people here on this forum. 🙂
The probability of finding people with similar interests in speakers and audio is close to zero where I live and work. There are local audio forums and WhatsApp groups too which I am part of but I feel out of place in most of them. Nobody goes deep into all these aspects or bother with helping people like me learn more. Most people here are not even open to experimenting and just believe that what they have is best subjectively and that everybody else is just wasting time with measurements and all. Most discussion these days on local forums is focussed on LPs and turntables and their superiority over digital formats and whatnot.
Anyway, I like it here.. A LOT.. 😀
A word of caution if I may, if you find a way here, to manage that "live" room of yours, I'd concentrate on the very early offenders. The first large peaks you find after the main pulse.
Above all, listen to what it does for your perception. People vary in what their preference is. And that's OK. See this quote and the next from Dr. Toole.
Personally I tried to absorb all early reflections in the first ~20 ms after the main pulse (and was successful at that). That completely changed what I perceived. Some good, some not that good. I'll explain...
Removing the early reflections made it possible to really notice the positions of sounds within the recording, in other words imaging became much more clear. But what was lost was a bit of that 'thrilling' feeling I had when I played something like large scale music, in my case often a soundtrack from a movie with an orchestra. The reflections added that extra energy, the vibe of 'being in the middle of it'... but it also left some things a bit more fuzzy, imaging wise plus it was hard to get my tonal balance right.
I had planned to add a sort of "virtual environment", adding ambience speakers to give back the energy I robbed from the room, but timed a little different. It wasn't until I added the ambience speakers, that created a sense of 'being in a better room' than I really have that it all came together. I could keep the imaging and get back the feel or vibe of 'being in the middle of it'. So that became my preference, as now it was much easier to get a good tonal balance that worked across a large library of music. I'll have to add that I added some EQ specifically targeted to combat the inter-aural cross talk, to get the most satisfying tonal balance over the entire "stage". I can imagine that a road like I have taken isn't for everyone. It's kind of like diving into the unknown and learning to swim while doing it. But I enjoyed it as a learning experience and found out what I really liked.
What I'm trying to say is that each step you take in this audio experience will have new consequences, stop at any time if you like, it is quite the rollercoaster ride. Find out what you like, and accept it if it may vary from the next guy... take inspiration from others and above all else, keep experimenting to find your own recipe. 🙂
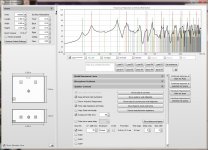
As long as we're talking about, and sharing room tweaks, from my most recent measurement session, here's my left and right speaker results:

In a relatively 'normal' looking living room. Planning for it helps 😉. It still is a lively enough room though.
In a relatively 'normal' looking living room. Planning for it helps 😉. It still is a lively enough room though.
Last edited:
My eye catches lots of reflection decay even after 100ms in wavelet spectr... despite of remarkable attenuation of first reflections
Even I have the same doubt..My eye catches lots of reflection decay even after 100ms in wavelet spectr... despite of remarkable attenuation of first reflections
I think that the attenuation of the first reflections with the relatively less wide panels that I have might help reduce interference to the direct sound and some amount of absorption of energy. However, it is still nowhere near enough to tame/bring the room under control w.r.t decay of energy at different frequencies, as seen in the spectrogram. Maybe a lot more absorption is needed for this room..
What does the RT60 tab in REW look like? Before and after the panels/mattress on the above measurements?
I am not sure about which metric in the RT60 tab is relevant in this case.What does the RT60 tab in REW look like? Before and after the panels/mattress on the above measurements?
This is how the EDT looks like with and without absorption:
Is there an easy way/a calculator sort of thing to identify which surfaces contribute to all these reflections based on room geometry? (Just to avoid working out manually/pen and paper analysis) 🙂
Does VituixCAD room tab help in this?
You could use REW's built in room "Room Sim" app.
Attachments
I am not sure about which metric in the RT60 tab is relevant in this case.
This is how the EDT looks like with and without absorption:
View attachment 1119546
Could you show Topt? This EDT graph isn't an RT60 graph, as it shows:
REW help said:Early Decay Time, based on the slope of the Schroeder curve between 0 dB and -10 dB. This is not an RT60 figure, but rather an indication of how quickly the initial sound at the measurement position decays - it is much more location dependent than RT60. A fast early decay (low EDT figure) indicates better clarity than at positions where the EDT is higher.
It does indicate that your clarity must have gone up 😉.
Topt explanation reads:
REW help said:An "optimal" RT60 decay time based on the slope of the Schroeder curve over a variable range chosen to yield the best linear fit. If the early decay time is much shorter than T30 the Topt measure uses a start point based on the intersection of the EDT and T30 regression lines, otherwise it uses -5 dB. REW tests every end point in 1dB steps to the end of the Schroeder curve and chooses the one which gives the best linear fit.
For a reference, here's an old one of mine with a Stereo pair of speakers running:
I kind of aimed for that 500 ms average, you see the EDT being lower. This is an old graph (unshaded arrays), I didn't make any new comparisons with everything running yet.
Last edited:
- Home
- Loudspeakers
- Multi-Way
- A 3 way design study