Here is the Topt 😀Could you show Topt? This EDT graph isn't an RT60 graph
It shows you could use some more absorption surface in general 🙂. Doesn't all need to be panels though.
It will be harder to integrate it in the living room while keeping all the good stuff. I guess the panels can be moved easily to the right spot for "listening mode".
More soft materials would do the room some good.
It will be harder to integrate it in the living room while keeping all the good stuff. I guess the panels can be moved easily to the right spot for "listening mode".
More soft materials would do the room some good.

I guess you meant to be on this thread?: https://www.diyaudio.com/community/...ssibly-affordable.392381/page-13#post-7202721Hey StigErik, what happened to the BG RD75s ? 😱
welcome back👍
A word of caution if I may, if you find a way here, to manage that "live" room of yours, I'd concentrate on the very early offenders. The first large peaks you find after the main pulse.
Above all, listen to what it does for your perception. People vary in what their preference is.
Personally I tried to absorb all early reflections in the first ~20 ms after the main pulse (and was successful at that). That completely changed what I perceived. Some good, some not that good. I'll explain...
Very helpful post. Your practical experience in this matter gives us valuable insight. Thanks! ......... j.What I'm trying to say is that each step you take in this audio experience will have new consequences, stop at any time if you like, it is quite the rollercoaster ride. Find out what you like, and accept it if it may vary from the next guy... take inspiration from others and above all else, keep experimenting to find your own recipe. 🙂
Found a first reflection point calculator.. 😀
Posting it here for reference.. 🙂
https://www.acoustic.ua/forms/calculator4.en.html
Posting it here for reference.. 🙂
https://www.acoustic.ua/forms/calculator4.en.html
Wishing a very happy, peaceful, and prosperous new year to everyone.. 😀
I haven't got much time to experiment these days. So whenever I get time, I read posts on the forum, learn things little by little about in-room response shaping and try to improve some on room acoustics.. 🙂
I got a proper new 2inch thick shaggy type carpet in front of the speakers 😀

With that the ETC looks like this (similar to the measurements earlier where I found that having a carpet does some good):

Still have to cut down on those peaks at 3ms, 7ms, and 8ms. I have to get 2 more smaller panels now. For more furniture, I have to wait.
In the meanwhile I have been listening to the wavcor mid-based 3 way speakers a lot.. I really really like it. So much that I don't want to touch this configuration for further experiments with the ST260/other waveguide. I will probably get/use another driver to continue with those experiments. I also have that nice SICA coax and a set of sica 5.5inch and some other 8inch woofers in hand (I am wondering about making a smaller pair of bookshelf type speakers for my desktop with those)...
Anyway, wishing that we all get time to work our own projects and other important things in life in this new year. 🙂
Regards
Vineeth
I haven't got much time to experiment these days. So whenever I get time, I read posts on the forum, learn things little by little about in-room response shaping and try to improve some on room acoustics.. 🙂
I got a proper new 2inch thick shaggy type carpet in front of the speakers 😀
With that the ETC looks like this (similar to the measurements earlier where I found that having a carpet does some good):
Still have to cut down on those peaks at 3ms, 7ms, and 8ms. I have to get 2 more smaller panels now. For more furniture, I have to wait.
In the meanwhile I have been listening to the wavcor mid-based 3 way speakers a lot.. I really really like it. So much that I don't want to touch this configuration for further experiments with the ST260/other waveguide. I will probably get/use another driver to continue with those experiments. I also have that nice SICA coax and a set of sica 5.5inch and some other 8inch woofers in hand (I am wondering about making a smaller pair of bookshelf type speakers for my desktop with those)...
Anyway, wishing that we all get time to work our own projects and other important things in life in this new year. 🙂
Regards
Vineeth
I'm not a gambling man, but if I had to gamble, I'd say one of those peaks is the wall behind the couch in the above picture...
That is exactly where I am targeting/ going to experiment first with new panels.. 🙂I'm not a gambling man, but if I had to gamble, I'd say one of those peaks is the wall behind the couch in the above picture...
Let's gamble, I expect a reduction in the peak just before 7 ms 😉.
@wesayso: In the previous plot, I had not done changes to get the impulse peak at time=0.
Here is the plot after doing that for the left and the right speakers (By left speaker, I mean the speaker which has a broadband absorption panel at its first reflection point on the sidewall. The right speaker has no such absorber as of now and there is just a stone-studded sidewall ase seen in above room pic).
So now I tried to compare both speakers ETC curves. Here is how it looks.

The listening position/mic location for measurement is 3.1m away from each speaker.
So the 7ms reflection that we were talking about earlier is actually about 9.3ms from the main impulse peak for the left speaker.
In the green plot (right speaker), I am guessing that those big secondary pics around 3ms maybe from lack of absorber near its sidewall as this one is much attenuated in the red curve. Then the reflections which occur around 5ms are there in both speaker responses.
Strangely, that 9.3ms peak is only there for the left speaker (the one which has a broadband absorber on sidewall) and not there/much attenuated for the right speaker. This is why I have now become suspicious about where it is originating from.. 😀
Also when I did the measurements, the mic was below the height of that couch's headrest and hence the wall was not directly behind it. Based on its relatively longer time of travel and its attenuation compared to main impulse, I am guessing that it is from a path where the sound hits the ceiling, then the wall behind the couch and then comes to the mic or something like that. I am still not sure why it is not seen on the right speaker though.. 😀
Or it could even be from the left speaker sound getting reflected from that stone studded wall without absorber. much larger path length.
Only way to be sure is to experiment with absorption at different places I guess. I will try to do this in coming days.. 🙂
Here is the plot after doing that for the left and the right speakers (By left speaker, I mean the speaker which has a broadband absorption panel at its first reflection point on the sidewall. The right speaker has no such absorber as of now and there is just a stone-studded sidewall ase seen in above room pic).
So now I tried to compare both speakers ETC curves. Here is how it looks.
The listening position/mic location for measurement is 3.1m away from each speaker.
So the 7ms reflection that we were talking about earlier is actually about 9.3ms from the main impulse peak for the left speaker.
In the green plot (right speaker), I am guessing that those big secondary pics around 3ms maybe from lack of absorber near its sidewall as this one is much attenuated in the red curve. Then the reflections which occur around 5ms are there in both speaker responses.
Strangely, that 9.3ms peak is only there for the left speaker (the one which has a broadband absorber on sidewall) and not there/much attenuated for the right speaker. This is why I have now become suspicious about where it is originating from.. 😀
Also when I did the measurements, the mic was below the height of that couch's headrest and hence the wall was not directly behind it. Based on its relatively longer time of travel and its attenuation compared to main impulse, I am guessing that it is from a path where the sound hits the ceiling, then the wall behind the couch and then comes to the mic or something like that. I am still not sure why it is not seen on the right speaker though.. 😀
Or it could even be from the left speaker sound getting reflected from that stone studded wall without absorber. much larger path length.
Only way to be sure is to experiment with absorption at different places I guess. I will try to do this in coming days.. 🙂
Last edited:
I did some experiments to see if the sidewall near the left speaker was causing some of the issues in previous ETC plots. Seems like it is.. 😀
I did some experimental wall treatment with a thin mattress and 2-3 pieces of 1-inch thick basotect foam as shown below.

It is definitely helping as per the ETC measurement below of the speaker shown in above pic

Those strong twin peaks around 2ms are significantly attenuated. There seems to be good reduction in reflections all the way till 20ms.
Next is the comparison between Left and right speakers in the same scenario.

Again it seems to be slightly better than before.. 🙂
The ones that are not at all affected are the reflections around 5ms. It is there for both speakers. Maybe it is from the ceiling.
Yesterday's 9.5ish ms peak is still there in the right speaker. So it might be somewhere else like the back wall like @wesayso predicted.. 😀
Overall definitely some motivation to put some absorption on that sidewall and the back wall. 🙂
I did some experimental wall treatment with a thin mattress and 2-3 pieces of 1-inch thick basotect foam as shown below.
It is definitely helping as per the ETC measurement below of the speaker shown in above pic
Those strong twin peaks around 2ms are significantly attenuated. There seems to be good reduction in reflections all the way till 20ms.
Next is the comparison between Left and right speakers in the same scenario.
Again it seems to be slightly better than before.. 🙂
The ones that are not at all affected are the reflections around 5ms. It is there for both speakers. Maybe it is from the ceiling.
Yesterday's 9.5ish ms peak is still there in the right speaker. So it might be somewhere else like the back wall like @wesayso predicted.. 😀
Overall definitely some motivation to put some absorption on that sidewall and the back wall. 🙂
Every reflection under about 6-7 ms has a pretty significant effect on our perception. those early 2-3 ms reflections being especially detrimental.
Do you perceive a difference when listening? Most probably: yes, because you put the absorption there so you know things have changed (lol).
But it should be quite obvious in terms of imaging and tonal stability.
A warning though, when it starts to sound very good: stop! The more you bring down all early reflections (say in the first ~20 ms), the more obvious the slight flaws of Stereo (such as cross talk) will present itself.
So you don't need to make your room into an anechoic space to be able to enjoy it 😀.
I only became aware of that after reducing the reflection levels by quite a bit, but then my speaker topology also helped with reducing those levels. While that may not be obvious by looking at arrays, they do not reflect as much from floor and ceiling, which makes them more prone to notice the absence of reflections that normally hide the negative cross talk effects somewhat.
I can honestly say I started to miss the back wall reflections that arrived outside of the first 6 ms. They brought a certain level of excitement to the listening experience. Sure imaging became even more clear, but not having those reflections present meant it all became much more sterile sounding.
I've done quite some work to recover from that with ambience speakers and mid/side EQ.
Don't be as crazy as I was, know when to stop or be prepared to work even harder to keep/recapture all of the good things too 🙂.
Last edited:
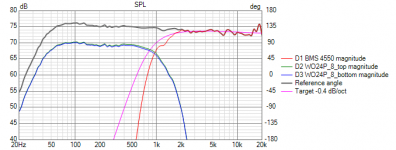
I have been listening to the current 3-way system for some time now. 🙂 It is good. But then I wanted to try out and hear how the BMS 4550 drivers would fit in with the system and what kind of sound it will have. So I took the driver attached it on that ST260 KVAR horn that I have, made some horizontal polar measurements and tried to make a system out of that and the 2 x Satori WO24P drivers.
Here is how it looks. I had a little bit of aggressive tiltdown in CD+horn response of -0.4 dB/ocatve based on previous experience with the peerless CD 😀


I dont know, for the moment, what is causing that 7.5kHz resonance. I am also a little doubtful about the phase matching at crossover due to the woofer phases drifting apart from each other and with the CD+horn phase response around the crossover region. A reverse null test shows this.

The step response & ETC plots look like this:

Just for comparison the following are the responses of the 3 way system


The ETC curves for the horn system looks a little less neat compared to the 3 way due to that secondary peak around 2ms poking its head out around -20 dB (somewhere I read that we would like to have such things happening below -30 dB)
Need to hear this new system and decide how it sounds soon.. 🙂
Please let me know if anymore insights can be obtained from above plots
Regards
Vineeth
Here is how it looks. I had a little bit of aggressive tiltdown in CD+horn response of -0.4 dB/ocatve based on previous experience with the peerless CD 😀
I dont know, for the moment, what is causing that 7.5kHz resonance. I am also a little doubtful about the phase matching at crossover due to the woofer phases drifting apart from each other and with the CD+horn phase response around the crossover region. A reverse null test shows this.
The step response & ETC plots look like this:
Just for comparison the following are the responses of the 3 way system
The ETC curves for the horn system looks a little less neat compared to the 3 way due to that secondary peak around 2ms poking its head out around -20 dB (somewhere I read that we would like to have such things happening below -30 dB)
Need to hear this new system and decide how it sounds soon.. 🙂
Please let me know if anymore insights can be obtained from above plots
Regards
Vineeth
Hello,
Have you tried a 12 dB Bessel around 1100 hz? Many are saying the BMS whatever the 800 hz datasheet that the 4550 sounds best from 1100/1200 hz... Maybe higher slope,around 950 hz ? The little 7.5 k according the room and the ears could sound a little sibilant, but depends of the final power response of course...
Thanks Vineeth for this cool tests.
@diyiggy: Thanks for sharing this information 🙂
I had applied a 1st order Butterworth filter (at close to 6kHz) electrically but the acoustic slope of the high pass seems close to LR4 around 1150Hz, as shown by the pink line in the below plot.

Acoustically it has much higher slope than the bessel 2nd order shown by the pink line in below plot (2nd order bessel at 1200Hz)

Is the bessel 2nd order electrical or acoustic slope (ideally we should be considering only acoustic slopes no?)
I will try to investigate that resoance around 7.5kHz as well and try notching it if investigation doesn't go anwhere.
I had applied a 1st order Butterworth filter (at close to 6kHz) electrically but the acoustic slope of the high pass seems close to LR4 around 1150Hz, as shown by the pink line in the below plot.
Acoustically it has much higher slope than the bessel 2nd order shown by the pink line in below plot (2nd order bessel at 1200Hz)
Is the bessel 2nd order electrical or acoustic slope (ideally we should be considering only acoustic slopes no?)
I will try to investigate that resoance around 7.5kHz as well and try notching it if investigation doesn't go anwhere.
Attachments
This speaker already sounds phenomenal 😀
An in-room measurement from listening position without room EQ

Will need to tame that bass a little bit 🙂
Somehow or the other I keep gravitating back to compression drivers on horns compared to other top modules for the woofer box.. 😀
An in-room measurement from listening position without room EQ
Will need to tame that bass a little bit 🙂
Somehow or the other I keep gravitating back to compression drivers on horns compared to other top modules for the woofer box.. 😀
Somehow or the other I keep gravitating back to compression drivers on horns compared to other top modules for the woofer box.. 😀
I wonder whether there’s a difference in the top two octaves dispersion?
Have you looked at the directivity chart from 5-20KHz? Perhaps change the scale so the range is only 30dB
@tktran303: Did you mean directivity comparison between 3way and above 2 way?
Here is the overlaid directivity curves on a scale with 30dB dynamic range
The red curves are those of the 3 way system while the green ones are for the above discussed 2 way. They do look different

Here is the same plot as above but the x axis restricted from 1kHz to 20kHz (vituixCAD is not allowing me to limit range from 5kHz to 20kHz)

Regards
Vineeth
Here is the overlaid directivity curves on a scale with 30dB dynamic range
The red curves are those of the 3 way system while the green ones are for the above discussed 2 way. They do look different
Here is the same plot as above but the x axis restricted from 1kHz to 20kHz (vituixCAD is not allowing me to limit range from 5kHz to 20kHz)
Regards
Vineeth
- Home
- Loudspeakers
- Multi-Way
- A 3 way design study