Right you are. I designed a pre for Shure V15 III And now AT-VM95C (ML) .
Top end is really quite good on this cart.
I expect it to beat an MC simply due to the 20+ dB gain difference.
Top end is really quite good on this cart.
I expect it to beat an MC simply due to the 20+ dB gain difference.
According to Richard Visee's impedance measurements, the V15 III has quite substantial iron losses and needs a substantial mechanical resonance to have a flattish overall response. I have no idea about the more modern stuff, but maybe they are in Hans Polak's document from https://www.diyaudio.com/community/...ts-with-individual-transfer-functions.397815/
By the way, someone on this forum recently measured the Shure V15 III impedance and got the same result within 1 degree, except that the electrical self-resonance frequency was a bit lower. Unfortunately I don't remember on what thread.
Edit: it was mason_f8, at the bottom of post #29 of https://www.diyaudio.com/community/threads/op27-phono-preamp.393127/post-7964991 (For some reason the link goes to 21 instead of 29.)
Last edited:

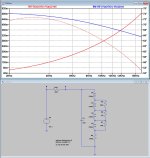
I made a more accurate model from the table that you and Richard Visee made, see first attachment, where in red the Impedance and it's phase are shown and in blue the inductance versus frequency from 2kHz to 20kHz.I have no idea about the more modern stuff, but maybe ......
Phase starts in rounded figures at 72 degrees and ends at 53 degrees while |Z| goes from 6K to 49K, almost identical to the given table measurements.
To make both curves visible in the same image, Impedance has been divided by 1e5.
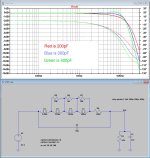
The second attachment shows the resulting frequency response with a termination of 47K // to resp. 200pF, 300pF and 400pF.
What still remains from earlier conclusions is that it's obvious that to get a flat overall response up to 20kHz that the mechanical part needs to produce the inverse of the electrical part, meaning a stark uplift at 20kHz, which will happen by it's supposed mechanical resonance at 38kHz.
Hans
Attachments
Last edited:
I wonder why your green curve is so different from my blue curve from post #17, https://www.diyaudio.com/community/threads/im-interested-in-riaa-preamps-design.425946/post-7977851 There is a 50 pF load difference and I don't take the detour via a lumped model, but otherwise they are supposed to be the same. Maybe I made an error in the calculation somewhere?
Last edited:
Hi Marcel,
I ran the model again with 450pF to make the termination load identical to yours in #17 and projected the result on your image in solid red.
There is indeed a large difference between your blue curve and my red curve.
What exactly did you do to get your curves.
As you can see in #124, I made a model replicating Impedance and Phase of your measurements,
That model was consequently used to measure the frequency response with 47K//450pF.
LTSpice does not make errors with models like this, so we must be doing things differently ?
Quite remarkable is that you blue curve has the same shape as the phase that is dotted in red, a coincidence ?
Hans
Attachments

I just calculated the transfer using the equation for voltage division with admittances, but I forgot to take the opposite of the phase angle of the impedance when calculating the cartridge admittance, silly me... When I correct that, I get this:

Attachments
Hans, is this SHURE V15 type III? I sorta think it is from Marcel's posts.I made a more accurate model from the table that you and Richard Visee made, see first attachment, where in red the Impedance and it's phase are shown and in blue the inductance versus frequency from 2kHz to 20kHz.
Phase starts in rounded figures at 72 degrees and ends at 53 degrees while |Z| goes from 6K to 49K, almost identical to the given table measurements.
To make both curves visible in the same image, Impedance has been divided by 1e5.
The second attachment shows the resulting frequency response with a termination of 47K // to resp. 200pF, 300pF and 400pF.
What still remains from earlier conclusions is that it's obvious that to get a flat overall response up to 20kHz that the mechanical part needs to produce the inverse of the electrical part, meaning a stark uplift at 20kHz, which will happen by it's supposed mechanical resonance at 38kHz.
Hans, Bill Shurv & Marcel. Are there more lumped parameter electrical cartridge models which you gentlemen have dreamt up? I've painstakingly gone through 2,300+ posts from 5 threads and found only 3.
AT 150, AT 24 & SHURE V15 type III.
If there are more, please link to them as my eyesight is going and my single brain cell overloaded.
I'm dreaming up my own take on OPA RIAA noise to see if I can replicate some Real Life measurements from nearly 50 yrs ago. Marcel has convinced me that simple L & R cartridge electrical models are NBG.
This has bearing on Nick Sukhov's idea that 150k & Lo C loading is appropriate for 'modern' MM. All MM cartridges are designed for flat response (at least to 20kHz) with 47k & 100p+ C loading. Simple L & R models say Nick's assertion cannot be true but it might if real life cartridges have significant 'losses' at HF eg Marcel's 30k resistance at 20kHz
Nick's assertion that all modern MMs have a mechanical resonance well above 20kHz is somewhat dubious. My contention is that most MMs have a broad mid HF trough from this resonance that needs the 47k & 100p+ C loading to be flat. This is mostly historical. But it is entirely possible that even cheapo MMs could be designed not to need this .. as most MCs, even in da 90s seem to be.
But my practical question is if 150k & Lo C loading with a Real MM Cartridge can have the same response as 47k & 100p+ C ... at least below 20kHz. For this I need 'accurate' models of Cartridge Impedance, preferably in lumped parameter form so I can use LTspice to do da hard sums.
😊 Found Han's Audioexpress article withAre there more lumped parameter electrical cartridge models which you gentlemen have dreamt up? I've painstakingly gone through 2,300+ posts from 5 threads and found only 3.
AT 150, AT 24 & SHURE V15 type III.
DL107 & DL109
Ortofon 40, S120 & OM10 super
Technics 205-IIx
I would be very grateful if someone could make a small summary of what is being investigated here. I think I know this is about 47k vs 150k loading, but which is the hypothesis you're working on? Lower noise performance or more lineair HF response or further extending the (lineair) HF response. Or is this about gaining a better understanding of the MM carts behaviour in general and being able to generate an accurate model on MM carts? I'm with @kgrlee on this, I find it very interesting, but am getting a little lost. There also seems to be some overlap with the topic on capacitive loading of MM cartridges. Could this be merged into one topic?
Yes, that´s the one.Hans, is this SHURE V15 type III? I sorta think it is from Marcel's posts.
Hans
I think that question could be best answered by Nick, who developed this alternative loading.I would be very grateful if someone could make a small summary of what is being investigated here. I think I know this is about 47k vs 150k loading, but which is the hypothesis you're working on? Lower noise performance or more lineair HF response or further extending the (lineair) HF response. Or is this about gaining a better understanding of the MM carts behaviour in general and being able to generate an accurate model on MM carts? I'm with @kgrlee on this, I find it very interesting, but am getting a little lost. There also seems to be some overlap with the topic on capacitive loading of MM cartridges. Could this be merged into one topic?
But in the end, when you want to be sure that the FR responds to your expectation, no matter what alternative you have chosen, carefully measure the FR from what you have made.
Noise with modern components will not be the first thing to worry about, because in most cases it will be quite a bit below the LP´s surface noise.
When you don´t hear noise from your listening position, with your amp on normal listening level, you´re O.K.
Hans
Those are all the ones I ever made, with blood, sweet and tears 🤣😊 Found Han's Audioexpress article with
DL107 & DL109
Ortofon 40, S120 & OM10 super
Technics 205-IIx
Hans
I just calculated the transfer using the equation for voltage division with admittances, but I forgot to take the opposite of the phase angle of the impedance when calculating the cartridge admittance, silly me... When I correct that, I get this:
View attachment 1450177
Marcel,
The simulation in LTSpice with the three different loads, 47K//450pF, 150K and 4794 ohm corrected with a 75usec zero, was again projected on your image.
The first two loads are now spot on, while the third in yellow was probably not yet corrected by you and still differs a bit with the LTSpice outcome in light green.
All in all, we can conclude that the model for the V15 III is most likely quite correct.
Hans
This is a dead end. 'Accurate' models of cartridges (taking into account the mechanical characteristics) are more difficult to build than to measure their frequency response. There is a thread where measurements of different cartridges are published, but this is done only for the load of 47 kOhm. It is necessary to do the same for the load of 150 kOhm and low C. But this will need to remove the cable and place the RIAA-preamp next to the tonarm, which is unlikely to do.But my practical question is if 150k & Lo C loading with a Real MM Cartridge can have the same response as 47k & 100p+ C ... at least below 20kHz. For this I need 'accurate' models of Cartridge Impedance, preferably in lumped parameter form so I can use LTspice to do da hard sums.
I grovel in thanks at your great endeavour Hans 😲Those are all the ones I ever made, with blood, sweet and tears 🤣
I managed to find R, L & recommended C for 7 of the 9 cartridges that Hans analysed. The exceptions being the Denons
Bill Shurv, I believed these are your cartridges. Do you happen to have datasheet specs for R, L & recommended C for the Denons?
Leoniv, I only want the difference between 150K & Lo C and the recommended 47k & 100p+ C. We can do this purely electrically but need 'accurate' models of the electrical side for which I'm really grateful to Hans
Hans, et al and other researchers have shown the mechanical characteristics are NOT affected by the electrical stuff. and vice versa. I pontificate on 'NOT' in another forum under my (pseudo?) electrodynamic designer guru hat.
You can simply extract the R&L values from the models at DC.I managed to find R, L & recommended C for 7 of the 9 cartridges that Hans analysed. The exceptions being the Denons
Be aware however that not all manufacturers use the same way of specifying, some specify the figures at a certain frequency, which of course does not give the same values as at DC.
Hans
You are right, an electric model is enough to obtain a difference. But still the easiest way is to measure the frequency response of the cartridge with a load of 150 kOhm using a test LP.Leoniv, I only want the difference between 150K & Lo C and the recommended 47k & 100p+ C.
Marcel,
The simulation in LTSpice with the three different loads, 47K//450pF, 150K and 4794 ohm corrected with a 75usec zero, was again projected on your image.
The first two loads are now spot on, while the third in yellow was probably not yet corrected by you and still differs a bit with the LTSpice outcome in light green.
Whatever may be the cause of the 0.6 dB difference, that's not it. I corrected the phase at a place that is used for the calculations for all load impedances and besides, a wrong sign of the cartridge susceptance has no effect on the magnitude of the transfer when the load is purely resistive.
@Hans Polak A difference between the 4794.5333... ohm case and the other two cases is that below 10 kHz, the 4794.5333... ohm case is much more sensitive to the cartridge impedance than the other two. As you know, the magnitudes of the impedances in the table are rounded to multiples of 1 kohm. The reason is that Richard hadn't saved the raw data, so I had to read everything off from an A4 hardcopy with 15 kohm/division scale (using a ruler to read it off as accurately as I could). The resulting read-off errors have a relatively large impact at the lower frequencies, where the magnitude of the cartridge impedance is not very large yet; 1 kohm is 1/6 of 6 kohm and only 1/37 of 37 kohm.
- Home
- Source & Line
- Analogue Source
- I'm interested in RIAA preamps design